
Good morning from Paul & Graham. Thank you to Roland for standing in yesterday - great output as always!
UPDATE at 12:52 - I'll keep going for a while, as I want to look at SHOE and OTB today.
UPDATE at 14:42 - I'll leave it there for today, hope to look at OTB tomorrow.
Explanatory notes -
A quick reminder that we don’t recommend any stocks. We aim to review trading updates & results of the day and offer our opinions on them as possible candidates for further research if they interest you. Our opinions will sometimes turn out to be right, and sometimes wrong, because it's anybody's guess what direction market sentiment will take & nobody can predict the future with certainty. We are analysing the company fundamentals, not trying to predict market sentiment.
We stick to companies that have issued news on the day, with market caps up to about £700m. We avoid the smallest, and most speculative companies, and also avoid a few specialist sectors (e.g. natural resources, pharma/biotech).
A key assumption is that readers DYOR (do your own research), and make your own investment decisions. Reader comments are welcomed - please be civil, rational, and include the company name/ticker, otherwise people won't necessarily know what company you are referring to.
What does our colour-coding mean? Will it guarantee instant, easy riches? Sadly not! Share prices move up or down for many reasons, and can often detach from the company fundamentals. So we're not making any predictions about what share prices will do.
Green - means in our opinion, a company is well-financed (so low risk of dilution/insolvency), is trading well, and has a reasonably good outlook, with the shares reasonably priced.
Amber - means we don't have a strong view either way, and can see some positives, and some negatives. Often companies like this are good, but expensive.
Red - means we see significant, or serious problems, so anyone looking at the share needs to be aware of the high risk.
We're a bit overwhelmed with the workload today, so will do our best with this lot, but won't be able to cover everything -

Summaries of main sections below
CentralNic (LON:CNIC) - down 2% to 112p y'day (£321m) - Q1 Results - Paul - AMBER
I have a good rummage through the Q1 numbers below, and it's better than I expected overall, although some concerns remain.
Zytronic (LON:ZYT) - 100p pre-market (£10m) - Interims - Graham - AMBER
A recent profit warning was just the latest blow here. Cash is c. half the market cap. A possible recovery play with the sales pipeline due to start maturing over the next year.
Accrol group (LON:ACRL) - 36.5p (+4%) (£116m) - Interims - Graham - RED
I stubbornly maintain my stance despite share price momentum and an earnings upgrade for FY April 2024. I’m not convinced that its real profitability is particularly high or sustainable.
Boohoo (LON:BOO) - up 12% to 43p (£547m) - FY 2/2023 Results - Paul - AMBER
A fair bit of detail below. Profitability has collapsed, but that was already forecast. Outlook is in line. I think the bull & bear points are all worth considering. BOO isn't at all financially distressed, providing the £325m borrowing facility remains available, so I need more information on that to form a firmer view on this share. Trading could well improve as supply chain problems recede, but the glory days of big profits look behind us. Will it remain a listed company? Lots more issues discussed below.
Quick comments
Equals (LON:EQLS)
101.3p (+4%) (£183m) - AGM TU - Graham - AMBER
Equals, the banking and international payments group, confirms that it is “confident in achieving expectations” for FY December 2023. The heavily adjusted forecasts (as of March) suggested an adjusted PBT of £11.5m this year, rising to £15.5m in 2024.
The company is experiencing fast revenue growth and reports that in the 90 working days to 15th May 2023, revenues were up 47% year-on-year to £32.7m. The full-year revenue forecast (again, as of March) was £89m so that looks very achievable based on performance so far. The gross margin has risen to over 50%, which is another significant improvement over performance in 2022.
I’m leaning towards a favourable view on this one. Perhaps I’ll be late to the party, but I’d like to see proof of strong unadjusted performance before I get too excited. But the signs so far are encouraging and I do recommend this for further research. I’d like to understand the USP of Equals’ products, compared to all of the many competitors in the forex/payments sector.
Shoe Zone (LON:SHOE)
Down 16% to 203p (£97m) - Interim Results - Paul - AMBER
I was quite surprised to see the share price down 16% to 203p today, but on reading the interims, can see why some people decided to bank their profits from a terrific bull run over the last 2-3 years. H1 profit is down - adj PBT of £2.5m (H1 LY: £3.1m). I don’t think this matters too much, given that H1 is the seasonally slower half.
Outlook is one brief line, which seems to be trying to say that FY 9/2023 will be in line with market expectations. That’s not really good enough, as checking my previous notes, the bull story with SHOE was that it repeatedly raised forecasts, and had set them low for this year. Zeus has 13.5p forecast adj EPS for this year, so at 203p the PER is 15.0x, which is probably enough for now.
The balance sheet looks OK, and note it’s been paying out divis & buybacks, so cash is reduced. Capex is also increased.
Paul’s opinion - I was more keen on SHOE last time, as the newsflow was more upbeat, with a series of earnings beats last year. This is a bit more subdued today, so I think a reset of the share price back to 200p is probably justified for now. It should benefit from improved supply chains & lower freight cost, and there’s a good chance it might pull off a beat against forecasts in the full year results. So overall I’ll say I’m AMBER on Shoezone, based on today’s rather lacklustre figures, and just an in line outlook statement.
Paul’s Section:
CentralNic (LON:CNIC)
Down 2% to 111.9p
Market cap £321m
Another $4m share buyback has been announced. This follows a $4m buyback which was implemented in Q1 (Jan-Mar 2023) - as shown in the cashflow statement for Q1.
The rest of this announcement sounds standard. Buybacks make sense when the share price is bombed out, although debt reduction might be a good idea too. I like the change in focus (previously announced) from an acquisitions spree which has greatly enlarged, but complicated the group, to organic growth and instead using cashflows to pay down debt and pay some (modest so far) shareholder returns too.
What does CNIC do? Two divisions -
Digital advertising - this is the larger division by revenue, but I can’t find a profit split between the 2 divisions. This seems to be centred on “advertorial” and review websites. Does anyone know if CNIC has disclosed which websites it owns, so we can check them out? (I know they have mentioned some acquired websites, but what others are there?) This doesn’t sound a high quality activity to me. Similarities with XLMedia (LON:XLM) or Tremor International (LON:TRMR) maybe? (which are also on low PERs).
Domain name management solutions - with recurring revenues & revenue sharing agreements.
Q1 Results (Jan-Mar 2023)
The obvious first question - why is a UK-listed company issuing quarterly results, when the requirement here is six-monthly accounts? I queried this with an adviser, who replied that it’s for transparency, so investors and analysts can better get our heads around the numbers, seeing a clean set of quarterly figures without acquisitions muddying the water. OK, that’s fine, I’m happy with additional voluntary disclosures. I wonder if it might also be a precursor to the company trying to list its shares in the USA, where quarterly reporting is required?
Strong revenue growth in Q1, up 24% to $195m (note US dollar reporting).
Zeus has just raised its FY 12/2023 revenue forecast by 7% to $826m - a substantial business? Well, yes and no. It’s low gross margin of only 23.5% in Q1, down a bit from 24.4% gross margin in FY 12/2022. Therefore I am seeing revenue as a vanity number, with most of it being pass-through revenue, so not a share to value on a price to sales ratio (never a good idea in my view!). Indeed, the company calls gross profit “net revenue”. On this basis, the more realistic number is net revenue/gross profit, forecast at $190m for FY 12/2023 (Zeus).
Profitability - Q1 generated adj EBITDA of $21.3m, but only $7.7m operating profit, and just $2.9m of profit after tax (PAT) - here’s the reconciliation -
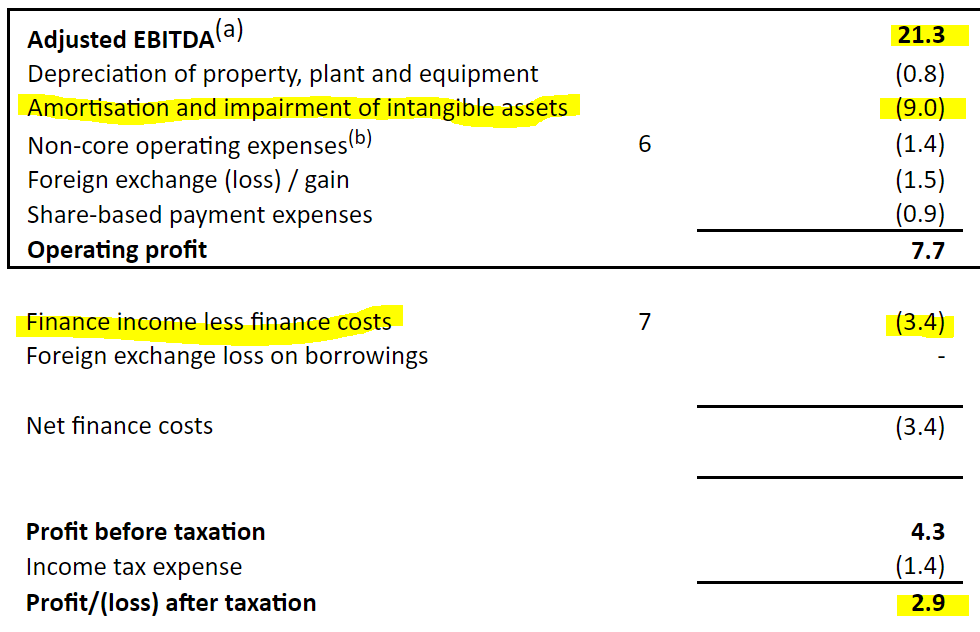
As you can see above, the largest reconciling item is $9.0m (just in Q1, so annualised c.$36m) of amortisation/impairment of intangible assets. The argument is that this is a non-cash charge, so can be reversed out. Is that reasonable? This might surprise you, but having delved into the numbers, I actually think this adjustment can be justified.
The thing I always check, is what type of amortisation is it? Amortisation of goodwill (and similar) can safely be ignored when valuing a company - that’s what most investors and analysts do, and I agree.
Whereas amortisation of other internal costs that have been capitalised onto the balance sheet is very different. The place to look is on the cashflow statement, to see how much of its (usually) payroll costs are being capitalised into intangible assets on the balance sheet, and compare that with the amortisation charge. In this case, not much is being freshly capitalised, as you can see here -
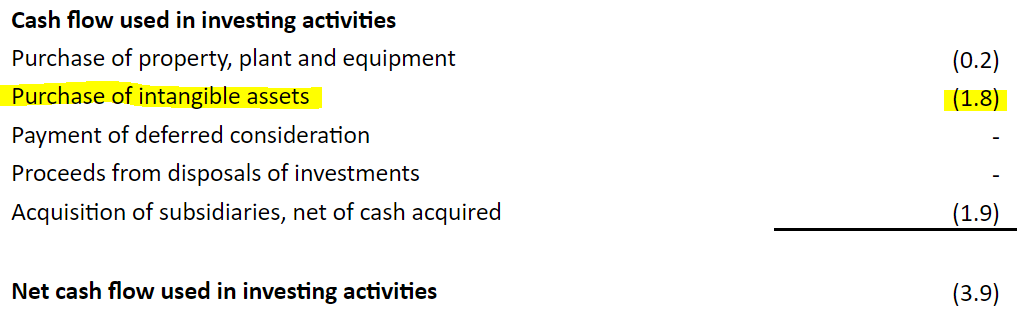
Hence the freshly capitalised costs of $1.8m in Q1 is only one-fifth of the amortisation charge. Therefore, it seems to me that CNIC is indeed cash generative, and its adj EBITDA figure does at least hold some water.
We can’t completely ignore finance charges, and tax though, which is partly why EBITDA is a fairly unreliable concept to me, and doesn’t translate into real world cashflows, precisely because interest costs and tax still have to be paid, so why would you ignore them? Maybe an acquirer might remove these costs, if planning a private equity type deal, with debt loaded up, and taxes avoided? Hence possibly why EBITDA is widely used in acquisition deals.
So I would use a fairly low multiple of EBITDA to value CNIC, maybe 5x its forecast $91.8m FY 12/2023 adj EBITDA? That would be $459m. Add on net debt of $49.3m at end Mar 2023, we get EV of $508m, divided by 1.25 to convert into sterling, and I get £407m. Stockopedia is showing an EV of £377m, so pretty similar, suggesting this share might be priced about right, or slightly too low? But it depends what EV multiple you’re happy to use.
EPS measures for Q1 again show the gulf between statutory & adjusted numbers -
Basic EPS Q1: 1.06 US cents.
Adj EPS Q1: 5.54 US cents
Zeus forecasts 20.8 US cents for the full year, so 16.6p, giving a FY 12/2023 PER of 6.7x - which looks cheap.
What adjustments should we make for the debt? This is a problem area. Net debt reported at 31 March 2023 sounds modest, at $49.3m. However, I’m not at all comfortable with this net figure. Why? Because that net figure breaks down into two large gross numbers -
Gross cash $102.9m, and
Gross bank debt of $147.3m L/T, plus $4.1m S/T = $151.4m
That makes net debt of $48.5m, and there’s a difference of $0.8m relating to derivatives, as explained in note 9, hence we get to net debt of $49.3m.
Simplifying the numbers, CNIC is saying that at 31 March 2023, it was sitting on cash of 2, whilst having outstanding bank borrowings of 3. That doesn’t make any sense! It would cost millions in extra finance charges to borrow a large amount, then sit on the cash, earning a lower level of interest income on it. I think it fixed some of the debt costs, using SWAPs? But I've not done too much digging on the terms of the debt, so you would need to do more work on that yourself if considering a purchase.
What it suggests to me, is that the period end dates are probably spikes up in cash, maybe customers pay at the end of the month? Then a lot of that cash probably goes back out again, days later, thus giving a favourable (but untypical) period end cash balance. That's my hunch, I should emphasise, and could be wrong.
If that wasn’t the case, i.e. if the company sits on c.$100m of cash all the time, then it would just pay off ⅔ of it’s bank debt, surely?
We can get to the bottom of this by the company disclosing its average daily net debt position. All companies should do this routinely, as it’s the only meaningful measure for reported cash/debt. Whereas a snapshot on one day (a balance sheet date) means little to nothing, as it can easily be managed so that it shows a favourable position that is not typical of the day-to-day average cash/debt position.
This is why I find the whole concept of Enterprise Value (EV) to be so dangerous, as you can easily end up over-valuing shares due to basing your valuation on an unrealistically favourable snapshot of net debt/cash position on one day. Average daily net cash/debt (audited) is the number we need, for all companies.
Dividends - a 1.0p maiden divi is being paid on 16 June 2023. That’s a start. With 286.1m shares in issue, it’s a £2.86m cash cost, not much in the overall scheme of things. The buybacks are larger, with $4.0m done in Q1, and $4.0m being done in Q2.
Although note that a 12.4m Euro cash outflow occurred on 8 May 2023, for deferred consideration, which seems to be buried in trade creditors. So I would like to see a full breakdown of what is in trade creditors.
Share based expenses (i.e. free money for the Directors, on top of generous 2022 salary/bonuses of £1m each for the 2 Execs, plus £2.3m for the outgoing CEO) are too high in my opinion, at $5.7m last year. I can understand why outside investors feeling the squeeze of a poor share price performance probably won’t be impressed with nil-cost share options being issued.
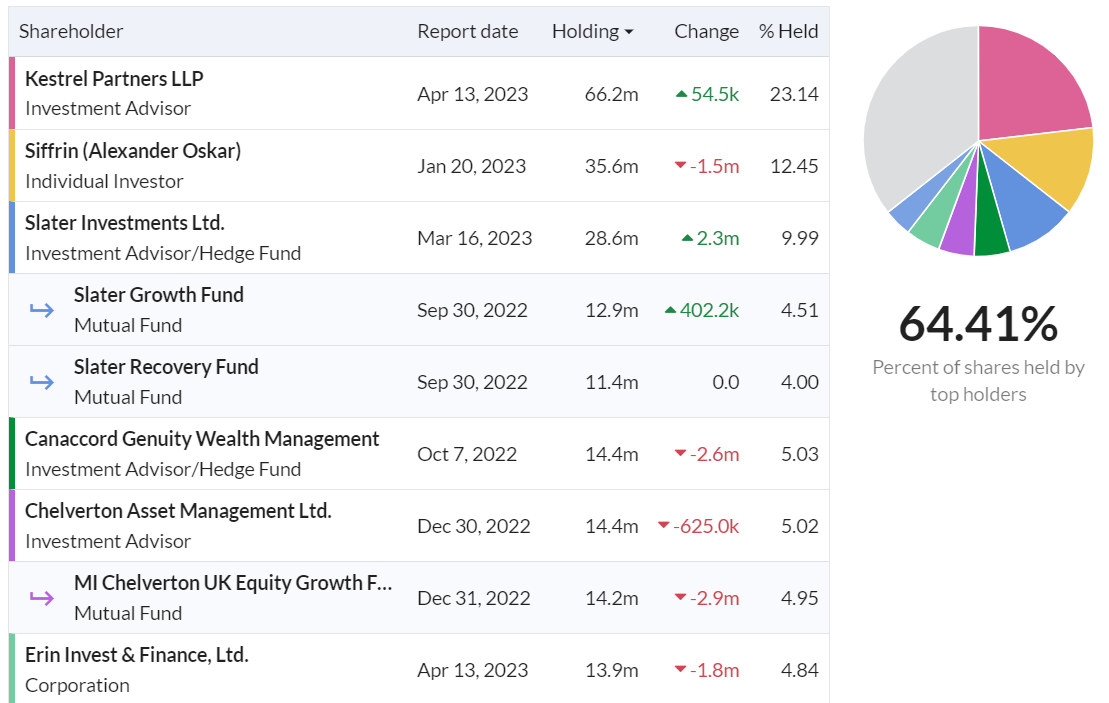
The Director dealings page is mixed, with Max Royde (of Kestrel Partners, the biggest shareholder) making repeated purchases, whilst Dayani and Siffrin have been £ multi-million sellers.
Shareholder register is concentrated, with Kestrel owning 23.1%, Siffrin owns 12.5%, Slater 10.0%, Canaccord 5%, Chelverton 5.0%.
Kestrel and Slater seem to be buyers, with the other large holders all having been sellers -
It’s probably time to wrap this up!
Paul’s opinion - here are my conclusions.
Bull points -
I do think CNIC looks genuinely cash generative, and a large part of the gulf between adjusted, and statutory profit is due to amortisation charges related to previous acquisitions, so I think we can safely ignore that amortisation.
With the acquisition spree now having stopped, it should be possible for CNIC to reduce net debt.
The PER is low, at 6.7x
Over time, assuming it does generate cash in future, the market might re-rate this share.
Bear points and queries -
Awful balance sheet, with negative NTAV of $(175)m. I would be inclined to use this number for valuation purposes, not the (I think probably window-dressed) period end net debt figure of $49m.
Are profits sustainable? We’ve seen many times in the past that digital advertising companies can be big cash generators one minute, and dead ducks the next, when Google or Facebook change their algorithms. The current lowly valuation suggests to me that the market doesn’t think CNIC can necessarily keep churning out good numbers.
How will it be affected by AI and cookies? CNIC says that it doesn't use cookies, so will benefit from them being banned. I don't know anything about this sector, so don't trust my judgement on what the future holds, so am not making any predictions.
Overly rapid expansion - although to be fair, management has addressed this concern, with a revised focus on cash generation & debt reduction.
Gross cash of $103m, and gross bank debt of $151m - this doesn’t make sense. So we need average daily net debt to be disclosed, to better understand reality.
No divisional split of profitability that I can see, so where does the profit actually come from? Advertising, or domain services? What's the split?
Overall, for me, I wouldn’t want to invest in a digital advertising group. I’ve seen too many of them turn out to be bad investments, despite often looking superficially cheap, because things can suddenly change in this sector, and blow up business models overnight. That's often why insiders are keen sellers.
That said, the numbers here are superficially quite attractive, so if you think that profit/cash generation will be sustainable, then it could be worth a look.
Hence overall, I’ll just be neutral, as I can see both sides of the story here. AMBER.
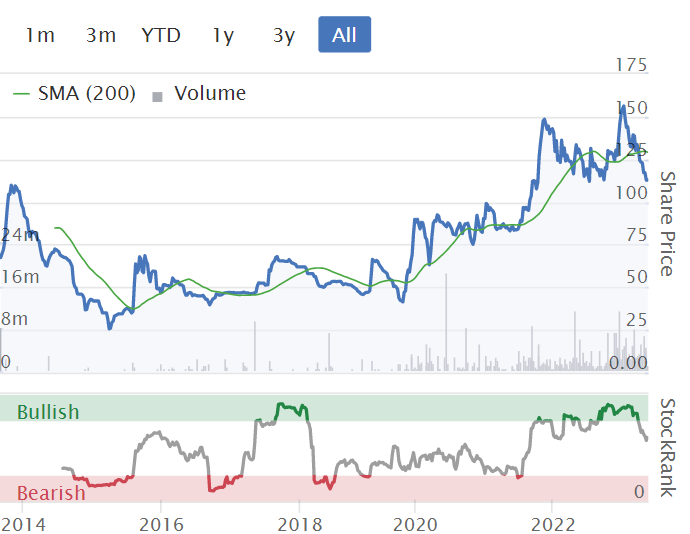
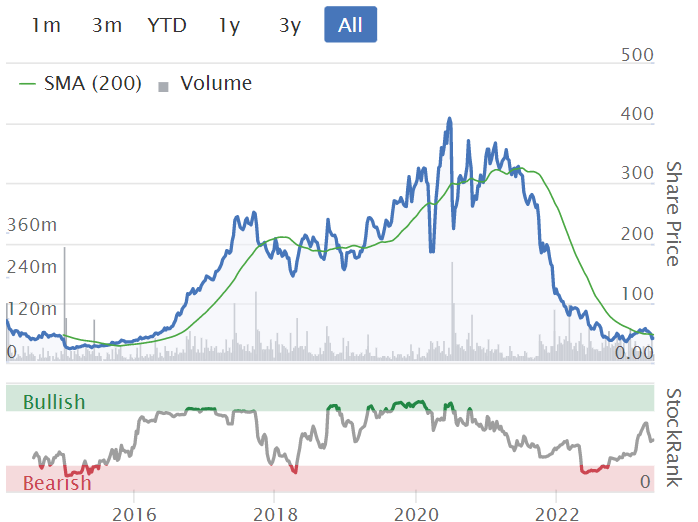
The share price has roughly doubled in the last 4 years - not too shabby -
Boohoo (LON:BOO)
Up 12% to 43p (at 10:15)
Market cap £547m
Lots to digest in this fashion eCommerce group’s accounts.
Key numbers -
Revenue £1,769m (down 11% on LY) - remember that BOO introduced an admin charge for returns this year, so is trying to lose unprofitable orders from customers who are serial returners, and/or treat it like a hire shop.
Gross margin reduced from 52.5% LY to 50.6% this year. Not great, but it’s tons better than Asos (see my recent negative review here). Factory gate and freight cost inflation has hit the whole sector hard. So it’s reasonable to expect some margin improvement in future, as those factors ease.
Profitability has collapsed, but adj PBT actually came in better than broker Zeus expected, at £(1.6)m loss, vs Zeus’s £(8.5)m forecast. Last year adj PBT was £82.5m positive, so that’s a big backward step in performance - which is why the share price has collapsed over the last couple of years.
Adjustments to profit look aggressive to me, so I think reality (subjective) is probably somewhere between the £(1.6)m adj PBT loss, and the £(90.7)m statutory loss before tax.
Net cash is still fine, at £5.9m (a slight improvement on £1.3m last year). The main factor which has boosted things is a dramatic reduction in inventories from £279m last year, to £178m this year. That’s a big difference to Asos, which is very significantly over-stocked, compared with BOO’s now quite lean stocking position.
Net cash also hides a very strange position, with a fully drawn £325m RCF (I still cannot find any disclosure of who the lender is), and a gross cash pile of £331m. As with CNIC in today’s report, why would it borrow all that money, then just sit on the cash pile? We need more information. Note 20 is coy on the facts, but says its a long-dated (2026) borrowing facility, with (no detail) 2 covenants on interest cover, and adj leverage (presumably a multiple of EBITDA?). It’s unsecured too, which is very unusual. We’ll have to scrutinise the Annual Report for more detail on who is providing this large borrowing facility, and what the more detailed terms are. We can’t properly risk assess it without that info.
Exceptional costs of £44.9m looks to be stretching things.
Balance Sheet - apart from the oddity of large gross cash, all of which has been borrowed, the rest of the balance sheet looks fine. Anyone saying BOO is financially distressed is wrong, providing the borrowing facilities remain available. That’s why I think the borrowing covenants, and who the provider is, matter so much.
NAV is £400m, down from £464m last year. There were £132m of intangible assets, so NTAV is £268m, which I think is fine for the time being. This also includes £136m of unencumbered freehold property, in at cost. It’s probably safest to assume that the freeholds have dropped in market value by about a third, but that still means BOO could raise cash of maybe £90-100m if it needed to, from selling, or doing a sale & leaseback of property - a nice cushion there.
Guidance -
FY 2/2024 is seen as being H2-weighted (in revenue growth terms anyway), with H1 expected to be 10-15% fall in revenue. H2 expected to be a return to growth. I’m not bothered about revenue growth, achieving profitable sales is what matters, and that’s the strategy.
Adj EBITDA (not real profit remember!) is guided at £69-78m for FY 2/2024, in a 4.0 to 4.5% range. This is not good, but it’s better than 3.6% actual in FY 2/2023.
Back in the glory days when BOO was highly profitable, and the sector leader for profits, it made c.10% EBITDA margins. I’m struggling to see that returning. So is the company, with a medium-term target of 6-8%, which I’m taking with a pinch of salt.
Heavy capex of £80-90m is due to work on increasing & automating warehousing continuing, and it capitalises about £32m of IT costs onto the balance sheet, which is more than the 17m amortisation charge.
They reckon net debt will go up to 1x EBITDA by year end, so £69-78m. That’s not ideal, but it’s modest net debt still, and much better than Asos again, which is in real trouble with debt & excessive inventories, i reckon. BOO doesn’t have those problems.
It’s probably easiest if I summarise things, in a bull/bear format -
Bull points -
FY 2/2023 results slightly better than expected, and guidance for FY 2/2024 is in line with market expectations, probably why we’re seeing maybe a relief & short-covering rally today?
Big reduction in inventories by 36%, which has been a big benefit to cashflow, with BOO pivoting back to a test & repeat model & shorter lead times post-pandemic.
It should be possible to rebuild margins, at least partially, from the supply chain-driven problems of the last year.
Less competition, with several rivals having effectively gone bust.
Trading overall could improve as new brands, and product categories (e.g. beauty products) build up - having been a drag on profits in the period since acquisition.
Loads of liquidity headroom, but we need to know who the lender is.
Freehold property assets of £136m, unencumbered, gives financial flexibility.
Overall balance sheet is still strong, so I’m not worries about solvency/dilution.
USA distribution centre opening later this year - should dramatically improve the customer proposition (speed of deliveries & returns).
Warehouse automation in Sheffield should provide sector-leading logistics costs.
Bear points -
Profitability has collapsed. So investing here is now a bet on it being able to rebuild profits, which is a lot less attractive to investors than the previously superb profit track record.
SHEIN - the Chinese competitor. It’s difficult to get figures on this, but Shein seems to have devastated the sector, internationally and UK, by undercutting on price.
US legal case - I can’t find much clarity on this.
Departure of key people, especially the family founder of PrettyLittleThing.
Share based charge of £32m seems too high, given the share price collapse, I think mgt need to make more share of the pain.
Dubious exceptional charges - aggressive accounting?
Paul’s opinion - I’ve been very right (2015), and very wrong (2022) on this share in the past, so maybe I should just declare myself neutral to avoid any more controversy? Actually, that’s where I am. It’s not a broken business, and the figures are way better than Asos, which I think is in real trouble. BOO is not in trouble. But is the share an obvious buy right now, not really, if you think that it might be a struggle to rebuild profitability, which is probably how I see it right now.
I should also apologise again to the readers who followed me into BOO. We did brilliantly the first time, but the second time it was a disaster. I didn't think profits would just collapse entirely the way it has done, so sorry for not anticipating the business model would crash in this way. Supply chain has had some impact, but I suspect that Shein might have been the silent assassin in this sector, and only one fellow investor Investore, really rang alarm bells within earshot of me over Shein, but as I couldn't find any firm data on it, I disregarded it, which was a mistake.
But why would the founding family want to keep the shares listed? As mentioned before here, I think the logical thing for BOO to do, is return to a sweatshop model (fast fashion customers don’t give a monkey’s about where the product is made, they just want it at rock bottom price), and go back to being a private company, without all the ESG scrutiny which comes with a stock market listing (but doesn’t trouble its main competitor, which is now Shein).
Do I really want to bet on BOO rebuilding its margins? Not really. The attraction for me from this sector has largely gone. Remember its graphs used to be 45% straight lines upwards. This is how they now look - which is not at all attractive any more -
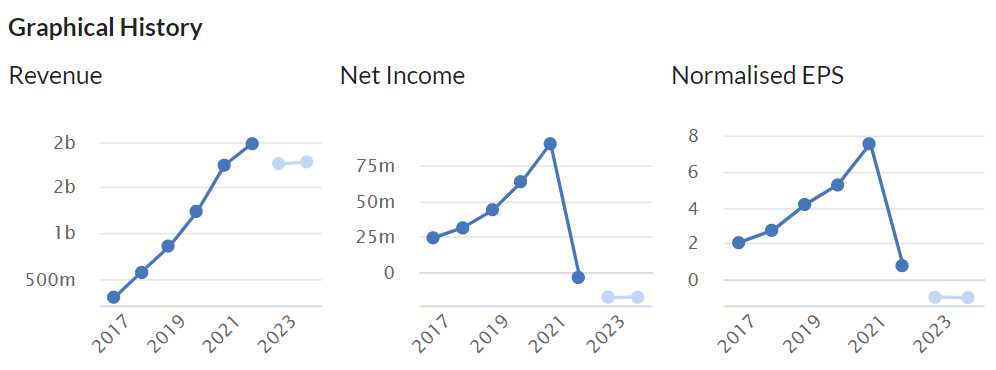
This is the reason that the share price has done this -
Everything else (like corporate governance, supply chain, ESG etc) is just background noise I think. The shares have collapsed because profits have collapsed. If we get a V-shaped profit recovery, then the shares could do really well, but I'm not convinced that's the most likely outcome. So for now, I'll just watch from the sidelines, AMBER on this one.
Graham’s Section
Zytronic (LON:ZYT)
Share price: 100p (pre-market)
Market cap: £10m
I’ll try to keep this brief given the very low market cap. We last covered this two weeks ago when it issued a nasty profit warning, as it emerged that a customer had overstocked Zytronic’s products, and another important end-customer was in Chapter 11 US bankruptcy.
Revenue forecasts for FY September 2024 were slashed from £13.5m to £8.0 - 8.8m, with (I presumed) another loss-making year. At least the company maintained its traditionally strong cash pile.
Today we have interim results (to March 2023), with the following headlines:
Revenue £4.7m (H1 last year: £5.9m)
Pre-tax loss £0.9m (H1 last year: profit £0.4m)
Net cash £5.4m
The interim chair describes the results as “disappointing”, and says the Board is “working on a number of initiatives to address the headwinds the Group is currently facing so that the Group may return to revenue growth and profitability as soon as practicably possible”.
Let’s skip ahead to the latest outlook statement:
The headwinds caused by the noted effects of the overstocking and Chapter 11 event are expected to remain to the end of the financial year. The positive resumption of business development activities and the Group's Board restructuring with the future Chair appointment, together with other initiatives being pursued, are expected to help position the Group more favourably for a future return to growth.
I note the reference to the “resumption of business development activities” - the company talks about business development taking two years for bespoke projects to mature, with Covid having caused a period of inactivity from 2020-2022.
In other words, they argue that they are still getting back on their feet post-Covid, but can point to a large number of open opportunities that they are working on in their sales pipeline. Supply chain issues also appear to have been resolved now.
Graham’s view
I won’t change my view here: this could be worth researching in more detail, as a potential recovery play, as the market cap is now covered half by net cash. Pre-Covid, they were able to generate a few million pounds of profit every year and their commentary suggests that they are looking to get back to pre-Covid performance levels as soon as their sales pipeline starts to mature (which will take more time).
Against that, you have to weigh the very poor current trading and the risk that the problems could be more fundamental than is apparent from the company’s releases.
I don’t feel confident in either direction and so I’m neutral.
Accrol group (LON:ACRL)
Share price: 36.5p (+4%)
Market cap: £116m
This is “the UK’s leading tissue converter”. We looked at its interim results in January. While acknowledging that it had some bull points, I nonetheless decided to give this stock the thumbs down. I was wary of its focus on adjusted EBITDA rather than real profitability, and its ongoing debt load.
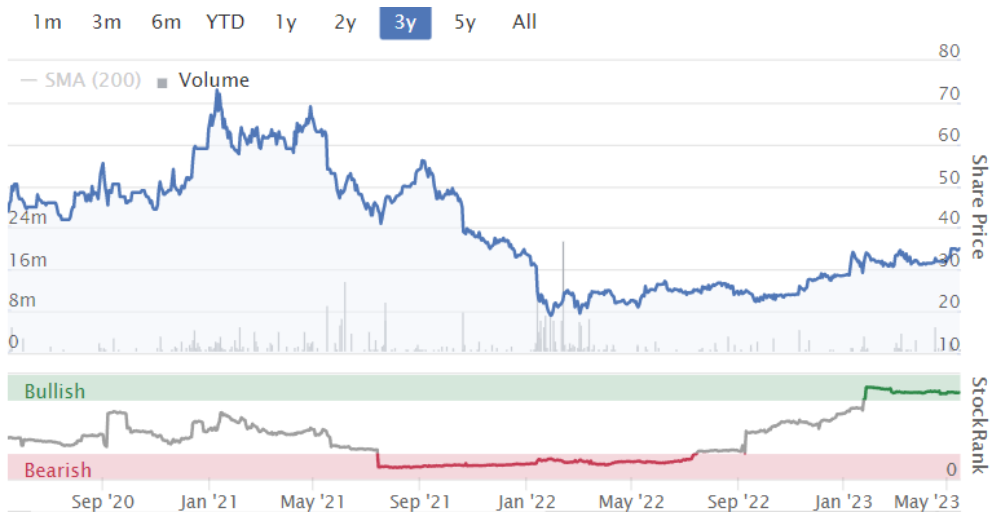
The shares are up another 20% since then as the stock makes a gradual recovery towards the levels seen in 2021:
Today’s trading update is again positive with FY April 2023 full-year results to be “at least in line with market expectations”.
Here’s the key news:
…the Group has continued to perform strongly, gaining further market share through its great value product range, broad retailer base, and new routes to market. The Group has successfully navigated and mitigated the well-reported and substantial inflationary pressures on a broad range of input costs through further process efficiencies and by engaging constructively with its customers to pass-on these additional costs.
Accrol makes paper for the likes of Aldi and Lidl, and the cost-of-living crisis is quite beneficial for discounters, so they are sitting pretty right now!
Some highlights:
FY April 2023 revenues £242m (vs. £230m forecast), up 52%
Adj. EBITDA to be “at least in line with expectations” of £15.5m
Adj. net debt to be higher than forecast (though the RNS does not say this) at £26.8m. The company failed to hit the leverage multiple of 1.5x that it was targeting by year-end.
Volumes up 7.7%, versus a flat tissue market.
Note that inflation is primarily driving the revenue gains, not volumes!
Outlook
Margins to “improve back towards pre-pandemic levels at a faster rate than previously reported”.
However, “prices are expected to soften in the year ahead, while volumes are expected to grow ahead of the overall private label sector”.
Net debt should go back to 1.0x EBITDA (latest was 1.7x).
20% of production capacity remains available to support further volume growth, and the company plans to build its paper mill by the second half of 2025.
Estimates for FY 2024
I’ve dug out a broker note to see the latest estimates.
With tissue prices expected to soften in the current year (FY April 2024), this has knock-on effects. Revenues for the current year are now expected to fall by nearly 5%, back to £230m.
However, with the help of a faster recovery in gross margin than previously anticipated, the adj. EBITDA forecast is raised to £19.3m (from £18.8m).
Graham’s view
They say that you should cut your losses and for that reason I’m tempted to withdraw my “Red” opinion on this stock, given that it has strong positive momentum behind it currently:
I will give the company credit for reducing its net debt. Even though it failed to hit its year-end target, it is moving in the right direction. That’s important especially as it plans to build a new paper mill, where costs could overrun.
However, I don’t want to change my negative view here as there are still several elements of the stock that make me uneasy, mostly to do with how it presents its results. Many, many different types of cost are excluded from the headline “adj. EBITDA” figure.
If you can find a broker who estimates the actual, reported profits of the business (Liberum is doing this), you’ll find that these estimates are a far cry from the adjusted numbers.
It sort of reminds me of this meme:
The current positive momentum in the share price may continue for some time, but this stock is not for me. It’s producing a commodity product and even if current conditions are favourable, I’m not convinced that it would be comfortable to hold this one for the long-term.
See what our investor community has to say
Enjoying the free article? Unlock access to all subscriber comments and dive deeper into discussions from our experienced community of private investors. Don't miss out on valuable insights. Start your free trial today!
Start your free trialWe require a payment card to verify your account, but you can cancel anytime with a single click and won’t be charged.