Some StockRank Portfolio Strategy Returns - 2013 to 2017

We’re working on some internal data research tools at Stockopedia which will contribute to a lot of editorial insights, and we hope, some really great product launches in future. Here’s a few insights from my own recent research into the performance of UK StockRanks strategies in the last few years.
(Disclaimer: Past performance not an indicator of future results etc).
1. Sector Diversification - does it reduce returns ?
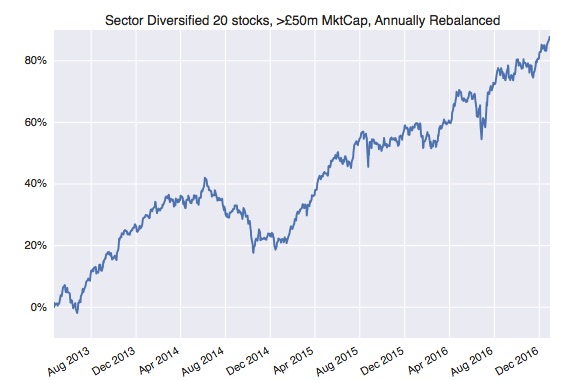
How did a NAPS portfolio process (picking the top 2 stocks from each sector) stack up against selecting the top 20 ranked stocks without any additional diversification ? Here’s a chart of the NAPS based approach…
Meanwhile the top 20 by StockRank without additional diversification:
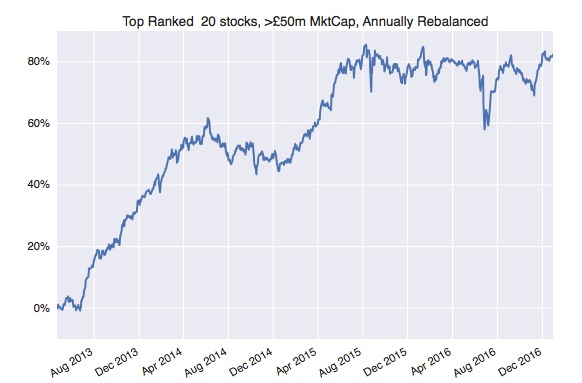
The performance was very similar, but the sector diversified portfolio performed much more smoothly. The “Top Ranked” portfolio was only invested in an average 3 sectors throughout the whole period, whereas the NAPS invested in 10 sectors consistently. Essentially, the NAPS process led to stronger risk-adjusted-returns.
The observant will know that my New Year’s NAPS portfolio (written up here) returned only just over 5% in 2017. The reason it didn’t keep up with the first chart above was because I meddled with my original rules ! Meddling with rules hasn’t paid.
2. Just 10 stocks - do concentrated portfolios outperform ?
Does extra breadth in a portfolio really add any performance ? I’ve long argued that if you are a systematic investor it makes sense to broadly diversify. If you are genuinely a talented stock picker (which you probably aren’t) then you should concentrate. Here’s a chart of a Top 10 only NAPS portfolio.
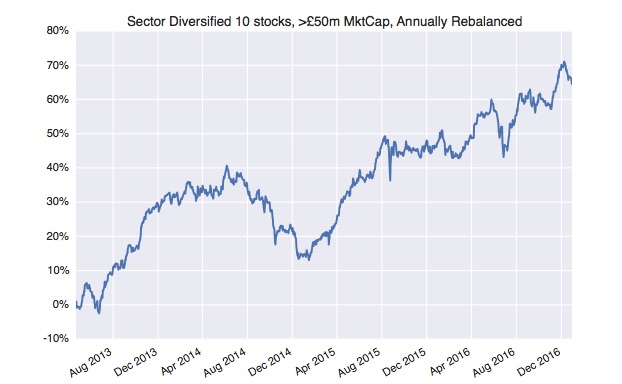
A nice performance, but it shows a significantly reduced return versus a more broadly diversified 20 stock portfolio and a lot more volatility. Concentration hasn’t paid.
3. Microcaps - is there an edge in hard to trade shares?
All the above tests have a minimum £50m market cap cutoff - i.e. they are excluding the microcaps. If we drop that to a £10m cutoff to let in the top ranking microcap shares how would it have done ?
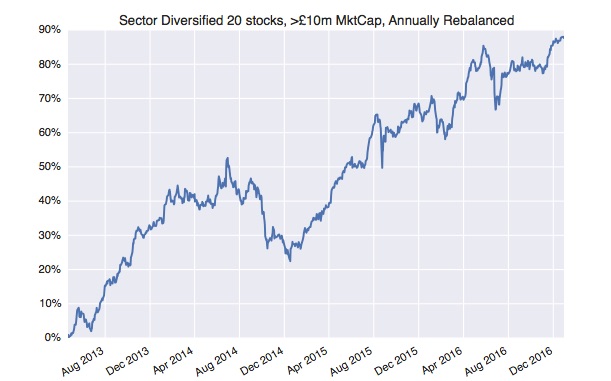
It’s squeezed a bit more performance, but I’d argue that the additional transaction costs and volatility may not warrant the extra effort required to trade them. Microcaps appear to pay… but at what cost?
4. Large Caps - can you beat the FTSE 100 ?
The FTSE returned 16% in the test period. If you had spent 10 minutes per year picking the top 2 ranked shares from each sector in the FTSE 100 and holding for a year what would the performance have been like ?
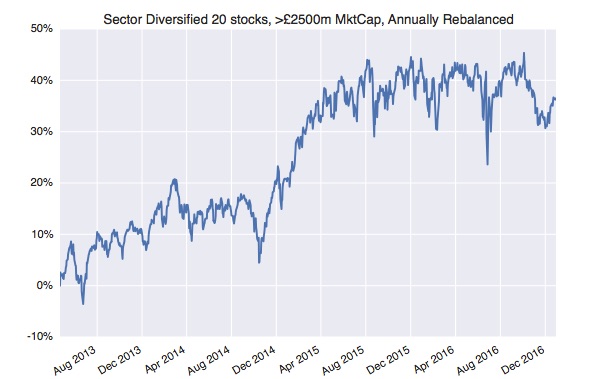
36% over nearly 4 years. That works out at over 8% annualised…. certainly better than savings rates and crushing the FTSE 100. I still wonder why so many people buy tracker funds… they are market cap weighted and not designed with sound investment principles at heart. FTSE trackers don’t pay.
5. Randomised NAPS portfolios ?
So let’s say we don’t select the top 2 shares from each sector… but we randomise. The following chart takes the top 10% or ranked shares in each sector and then selects 2 stocks at random. It then plots the performance of all onto the chart. This shows the range of outcomes that someone using their personal discretion to pick 2 stocks in each sector could have experienced.
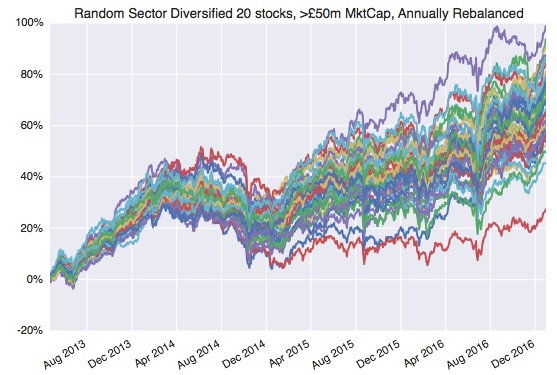
The average performance for all these portfolios was a 68% return - i.e. 15% annualised. Given there’s been a handy 3.5% dividend in most of these portfolios annually… it’s a chunky return. Even throwing darts pays.
Comparing against the first chart in this piece, it’s clear that selecting higher ranked shares generated a portfolio at the top end of the distribution. That’s an encouraging result, but there’s no guarantee it will continue in future !
NB - All the tests above were done using the LSE StockRank data we have on archive since the StockRanks were first published in April 2013. I used that April data set, then rebalanced each portfolio using the close price on the 31st December each year since. Only primary listed stocks were included in the analysis.
Onwards…
We’ll be doing some more work to investigate the benefits of diversification - across breadth, sectors, regions and size groups - in the coming few months. I’ll try and run the same tests across European, Asian and North American markets too. Watch out for it.
We’re working on some really superb new portfolio analysis tools which will come out near the end of the year.In the meantime the new Charts library is coming next. If you missed it check out the chart demo webinar here.
Disclaimer
This is not financial advice. Our content is intended to be used and must be used for information and education purposes only. Please read our disclaimer and terms and conditions to understand our obligations.

34 comments
As much as I agree that the FTSE100 index is flawed from the point of view that a few shares dominate the index, I cannot agree that tracker funds don't pay. They have 2 important advantages over NAPS portfolios, namely
no stamp duty on a FTSE ETF. OK, it's only 0.5% for a NAPS portfolio of large caps, but it still ads up
AND
no capital gains tax whilst held in the fund. A NAPS portfolio suffers a 20% drag on any increase which is equivalent to around a 4% reduction in growth. An equivalent ETF can roll up CGT free until the ETF is finally sold.
I'm sorry, but I don't agree with your second point about CGT. The rebalancing of the NAPS portfolio would effectively allow one to use part or all of the annual CGT exemption each year. The ETF would only be able to use one year's exemption when finally sold (unless sold partially spread over tax years).
Plus of course most investors use a tax free ISA or SIPP wrapper, so no CGT even if the annual allowance is used up.
The CGT position depends upon ones personal circumstances. In my own case the yearly CGT allowance is well and truly busted on other gains, so any NAPS gains on re-balancing becomes subject to CGT.
ETFs allow the capital gain to be rolled over, until the ETF is sold. As there is currently no CGT on death, a very large capital gain on an ETF could potentially be wiped out.
I accept that inside an ISA, an 8% gain is much more attractive than a 4% gain, but in a non tax advantage account, and assuming a yearly turnover of all the shares, the 8% with CGT at 20% only has a very small advantage over the 4% with rolled up CGT.
CGT is only an issue for non-tax relief portfolios.... most people here invest in ISAs and SIPPs.
I do agree of course that stamp duty does need to be taken into account in transaction costs.
But when a NAPS large cap performance has returned over 8% annualised, more than double the 4% annualised performance of a FTSE 100 tracker... it's a rather mute point to suggest that stamp duty is an advantage for tracker funds. The reality is that the market cap weighting & poor security selection criteria of the FTSE 100 kills the returns... that reality dominates any stamp duty advantage.
Have a read of Ben's article on the cap weighting topic. http://www.stockopedia.com/content/why-cap-weighte...
Hi Ed,
This is a very interesting article. However, it isn't much use to me personally at present, because I sold my NAPS portfolio and all my other individual company stocks after the Brexit vote last summer and I reinvested the proceeds in a portfolio of Investment Trusts. This was because I was worried (possibly incorrectly) that Brexit is likely to increase the volatility and risk of holding individual UK company stocks, and I wanted to diversify my portfolio internationally.
I found it very frustrating that I was unable to create screens on Stockopedia for Investment Trusts. What I was able to do, though, was to create a dummy portfolio on Stockopedia containing all the Investment Trusts that I might consider buying shares of. I find that useful, because it provides information about, and the ability to sort against, market capitalisations, spreads, dividend yields, Betas, and Share Price Changes over the previous 6 months, 1 year and 5 year, as well as the ability to view graphs of share prices over various previous periods for the Investment Trusts in my dummy portfolio. But it would be even more useful to me if Stockopedia would provide information about the discount of each Investment Trust to its Net Asset Value. As that is just a single item of data for each Investment Trust, Is there any chance of that happening in the near future?
pka
Personally I think NAPS portfolio strategies should be treated like a benchmark. There's no magic in them... just straightforward factor-investing (Value, Momentum etc) principles applied in a common sense way in an equal weighted, diversified portfolio.
Any active management (whether done personally, or done by a professional for you) should be compared against a passive benchmark. The NAPS process is a pretty passive benchmark... active managers should add some alpha beyond the returns available to such a simple process.
The reality is that most of them haven't. No idea what will happen in future of course !
Regarding Investment Trusts - we've bought the data - and I'm sure it will be launched soon enough ... after everything else in front of it ! Please vote here - http://ideas.stockopedia.com/forums/18977-stockope...
Thank you Ed for prompt reply.Got u ,makes a big difference..
Hi Ed,nice set up here,have been with you 6 weeks now & find it saves me a lot of time.The performance of the ftse 250 since the start of 2013 to 2017 has on my reckoning been up around 50% not including dividends.
The above charts start on StockRank day 1 - April 20th 2013. Rather than Jan 1st 2013.
FTSE 250 is a 33.4% return since then (excluding divis).
(18164-13616)/13616
Hi Ed,
Enjoyed reading this article.
Based on your own analysis of your NAPS screens what would be the coolest thing ever would be if one could backtest one's own custom screens with rebalancing.
Whilst we have Guru screens that are great and NAPS etc. The ability to do a genuine query of the Stockopedia database with ones own defined investment criteria, would really put Stockopedia well beyond any other private investor product out there.
Guess the main concern might be computer time used. I personally would gladly wait hours/days to be able to get the results.
rick - we're building a backtester at the moment... but it's a top secret development. These charts are a simple backtester that I built, but it's slow. We're building a blazing version... but I'm not going to say when it will be released !
Thanks for the prompt reply. You have already done an amazing job with Stockopedia, this would certainly be the icing on the cake for me and I'm sure many other users (and prospective users). To be able to put ones own investment ideas to the (back)test, would be a massive advantage over other available investment products. It is certainly a development worth waiting for !
Ed,
Thanks for the article. Do you see any significant improvement in performance if you rebalanced each quarter?
Thanks
Ben
Hi Ed, how does that compare to say the FTSE250 or similar over the same time period as really a graph showing out-performance or under-performance against the benchmark is most useful way to look at it, at least in my opinion. Be nice to see that index added into the chart and see the relative performance against it.
FTSE 250 is up about 33% in the same timeframe which these strategies have comfortably outperformed.
I'm not sure it's an appropriate benchmark though - it's a market cap weighted mid cap index... most private investors on this site deal in small caps in equal weight. An equal weighted FTSE + AIM All Share would be a good benchmark I think... but sadly it doesn't exist.
Hi Ed,
Rather than spreading my portfolio over all the top performers in all the sectors, I look at the 6 month RSI for my stock rank based investment strategy as well as the 3 month RSI for the sectors that are most improving relative to the 6mth RSI. For sectors read industry groups that gives me a sharper focus.
Would you please comment on this.
I also set up NAPS virtual portfolios for 2015/6/7 using £1000 for each stock. Some of the stocks I already owned. I use them to track my own portfolio against NAPS, some very interesting results. I wish I could be more disciplined about reading the ED's daily posts, could have prevented some costly losses e.g, GLOBO.
Keep up the good wok guys
Superb website by the way! New to this. Much prefer your approach to Motley Fool Share Advisor. Would you describe their approach as one of "story stock tips"? That's my impression.
Do these returns account for trading costs and dividends? If not, why is that? Surely some sensible assumptions could be made.
HI Ed,
No Alert in the chart? price and volume alert is very important ....
Just joined Stockopedia and must say i am very impressed, still finding my way through lots of pages and information .Is there a page that shows your nap selection portfolio for 2017 on a daily /monthly performance ?
which would be very interesting to follow.
Hi Blue,
Welcome to Stockopedia.
What I have done in the past is put together a shadow portfolio using the Folios feature above picking a selection of say 20 stocks from the Naps portfolio then buying a notional £1,000 of each (and depositing say £20k to cover the purchase). It will only take a few minutes to set up and the you can monitor all of the stocks daily and on a cumulative basis and also an overall P&L performance. It would also give you a live education on how to use this particular feature.
Best,
Gus.
I have a subscription to Stockopedia USA but I am not able to find performance comparable to the UK. Can anyone share their experience?
I really want some information on the US. I have a US subscription but I I get the impression that I need to be a stock picker to win in this market. Maybe because factors are so big now?
The Stock Rock performance is not clear like with the UK, see: http://www.stockopedia.com/stockranks/performance/?exchanges=NYQ%2CASQ%2CPCQ%2CNAQ%2CNMQ%2CNSQ&field=_QVMScore_lo?=50&period=1&buckets=deciles
Yes it's definitely a much more efficient market. We've found strong factor spreads in almost all international markets except the USA - the spread is much more moderate in the USA.
Why would this happen? The US has much more standardised reporting, instant data delivery from the SEC in XML format, and a much broader and more mature quantitative / algorithmic investing environment. I anticipate that all markets will eventually become more and more efficient and tend towards the USA.
In the meantime we're working on improving our ranks to be more regionally defined... I think we can squeeze more returns from US stocks. On top of improving the factor returns, there's quite a bit that can be done via alpha cloning - but we need to release SmartMoney for that.
Thanks Ed, that was a really useful reply.
So would you agree with the conclusion I am beginning to form, at least for the time being, that the US is better suited to stock picking. For example, a concentrated portfolio of good ideas using execution ideas from the book you previously recommended 'The Art of Execution'.
By Alpha Cloning are you referring to ideas such as following institutional money and common 'best ideas'?
Very interesting results. I have a suspicion that the optimum size of portfolio might be very dependent on the kind of rules used to build the portfolios.
It seems clear that there should be an ideal size of portfolio because below a certain size you will have insufficient diversity and hence too much volatility; but conversely if the portfolio has too many stocks then you will approach the index return and volatility and you have effectively built yourself a mini tracker fund. But what is that optimum size and how sensitive is it to other choices? For example, my own experiments seem to suggest that ten stocks is enough provided that you select from high Q stocks, but you need more if you select from a wider base, both of which tend to move the portfolio closer to the index return and volatility.
I have ranked the naps2017 selection by the estimated 256-day sharpe ratio of the combined portfolio as I add more stocks (So the table below is cumulative. Each row describes the effect of adding the stock on that row to all the stocks on the previous rows.) This suggests that you might only need ten stocks (the ten in blue) to get similar performance. So this can act as a hostage to fortune in 2017 if it manages to omit all the best performers going forwards!
Nick - thanks for the analysis. I'm planning on adding position size calculators in future, and include volatility weighting and mean variance weighting as options too. Just need time and/or more resources.
In the meantime I'm planning on exploring how returns could have differed using different weighting approaches. Watch this space.
Ed - this sounds very promising indeed. I am finding mean/variance ideas to work very well as an alternative to the momentum component of the QVM triangle.
Incidentally, the (complete) naps2017 selection has an extremely low variance. Obviously history is not an exact guide to the future but the signs are that it could be a very stable performer.
Hi ED
Great article as usual, many thanks.
With regard to volatility weighting, you might like to look at the work done with TradeStops https://tradestops.com/ which centres around a VQ (Volatility Quiotient) per stock (or ETF, Investment Trust or even index).
Using this VQ as a basis, the site also offers support to examine buy size, position size within portfolio as well as asset allocation.
I appreciate you might regard TradeStops is a bit of competition, but Stockopedia is unquestionably far superior across the board than TradeStops. Some if its ideas however, do offer a useful augmentation particularly for risk/reward balancing within a portfolio, making visible volatilities between different stocks and quite sophisticated alerting based not just on price movements but also historical stock volatilities.
(disclosure I am a subscriber to TradeStops but have no other connection with it).
Regards
Howard
Thanks Ed. I am running a small real portfolio along the lines of your randomised portfolio above. I can't bring myself to go entirely random but inject a discipline that I can only buy a stock if it is ranked 90 or above. will let you know how I get on.
I very much want to see an internationally diversified NAPS performance. Any further smoothing of performance?
Hi Ed
Interesting stuff as always. Can I just clarify the rules used to construct the performance of the first graph? Other than top 2 in each sector and Mcap over £50m was there anything else such as maximum bid/offer spread?
Regards
Unwise
No I ignored the spread rule in all these charts... it's a point of further testing. The £50m Market Cap should ensure the spreads are fairly tight . I'll try and post some more detail later.