Stock Comparisons - 20th May: Tesco vs Marks and Spencer

Which company would make a better investment? Coca Cola or Pepsi? Apple or Microsoft? I’ve always been interested in comparing the investment opportunities that household names have to offer. We are therefore initiating a new column which compares the fundamentals and share price momentum of companies which trade in the UK and beyond. This column should constitute a starting point for further DIY research, and enable investors to analyse companies which operate within similar industries. We start off by comparing two UK retail companies: Tesco and M&S.
StockRank Trends
When Tesco (TSCO) said ‘you shop, we drop’, they really meant it. Take a look at Tesco’s StockRank chart below. The StockRank dipped from 77 to 66 in April 2014, when the company revealed a drop in trading profits. Then, in April 2015, the StockRank plunged from 81 to 19, as Tesco reported a £6.4 billion loss for the year ending February 2015 - the largest loss in Tesco’s history and the sixth-biggest loss ever announced by a UK listed company.
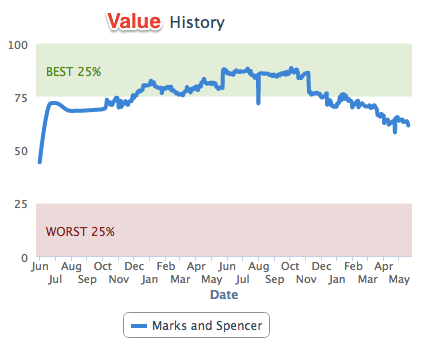
By comparison, M&S’s StockRank has gradually drifted upwards over the past 12 months. It climbed from around 50 to 70 in January 2014, as the share price jumped 14% on the back on a positive interim statement. It is also interesting to note that that M&S’s ValueRank and MomentumRank have more or less been inversely correlated. Since October 2014, the MomentumRank has risen from around 34 to 97, but the ValueRank has dropped from around 85 to 61.
This inverse correlation can be explained. The trending direction of a share price can have a considerable influence on the MomentumRank, meaning that companies with strong share price momentum can often have a higher MomentumRank. Indeed, M&S’s share price has risen by a massive 45% since October. If share prices rise, but earnings and sales remain stable, then the ValueRank may fall, given that companies with a higher valuation ratios (ie. PE or PS ratios) may have a lower ValueRank.
Let’s explore the factors driving the momentum higher…


Momentum
Brokers have recently become more optimistic about M&S. Since February, the consensus EPS estimates have risen from 32.2p to 32.8p (see below). A rise of 0.6p may not sound like much, but as Tesco would be the first to point out...’every little helps’.
In particular, Societe Generale, the French investment bank has promoted M&S from a ‘hold’ to a ‘buy’. Societe Generale admitted that it had underestimated the sales recovery potential of M&S. Indeed, sales at M&S’ merchandise division rose 0.7% in the 13 weeks to March 28, beating the expectations of analysts, who had forecast a 1.2% decline.
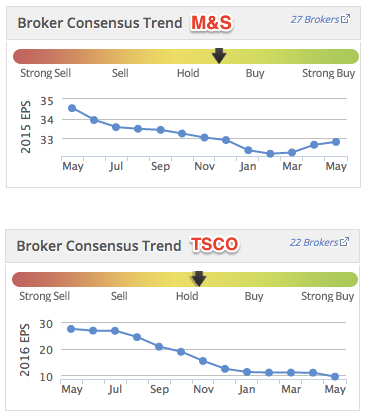
By contrast, brokers are becoming increasingly pessimistic about Tesco. EPS forecasts have dropped from 27.4p to 9.4p since April 2014. The firm managed to issue two profit warnings last summer, and also removed former CEO - Philip Clarke - against the backdrop of price competition with discounters such as Aldi and Lidl. The company now trades at 221p - down nearly 30% from this time last year.
Dividends
M&S has a forward dividend yield of 3%, compared to Tesco’s yield of 0.07%. But which company is better placed to support its dividends?
Many analysts see the Dividend Cover as the essential dividend health metric. The usual rule of thumb is that a dividend cover of more than 2x is viewed as healthy. Tesco currently has a forward dividend cover of 66, which is higher than M&S (1.8), though Tesco is paying out a lower dividend.
While the Dividend Cover is useful, investors should remember to look beyond this ratio and check the company’s cashflow. If a company maintains its dividend but has poor cashflow, it may be financing the payout with debt and things could end in tears. M&S is generating more cash than Tesco. M&S generated 69p in operating cashflows per share in 2014, while Tesco generated just 5.9p in the year ending February 2015.
Conclusions
M&S has a high and improving StockRank, while Tesco has a lower and deteriorating rank. The brokers are becoming increasingly optimistic about M&S, while becoming pessimistic about Tesco. Furthermore, M&S is paying out a higher dividend. If you want to make further comparisons, you may find Stockopedia’s Comparison Page useful. It enables users to compare the fundamentals and price trends of different stocks. To take a free trial of our services, just click here.
Disclaimer
This is not financial advice. Our content is intended to be used and must be used for information and education purposes only. Please read our disclaimer and terms and conditions to understand our obligations.

3 comments
Click on the drop-down arrow next to Print and select a date.
Kind regards
Richard
How do you get the historical StockRank charts? It's not something I've spotted before and would be useful to review.
Many thanks
David
My view is that anyone who invests in the ruthlessly competitive food retailing supermarkets is more likely to lose money than to make it. The fact is that they have no economic moat at all. They are all trying to eat each others lunch. Margins will continue to fall because most of us can easily go many different supermarkets, and increasingly it is all about low prices, as recently shown by the success of Aldi & Lidl.