Stock rank/Momentum trading ideas

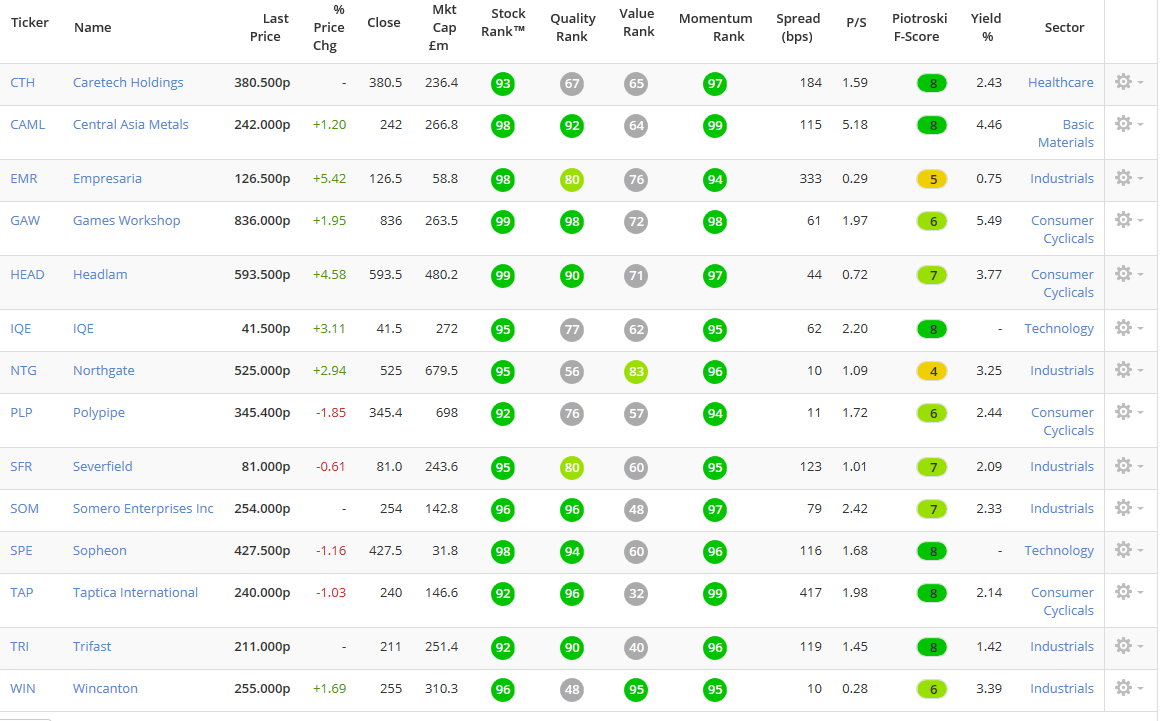
I'm looking for a trading strategy and i'm open to opinions and discussion.
My criteria is simply:-
Stock rank >= 90
Momentum >= 95
Spread <=500
Market cap <= 800
Reset every month.
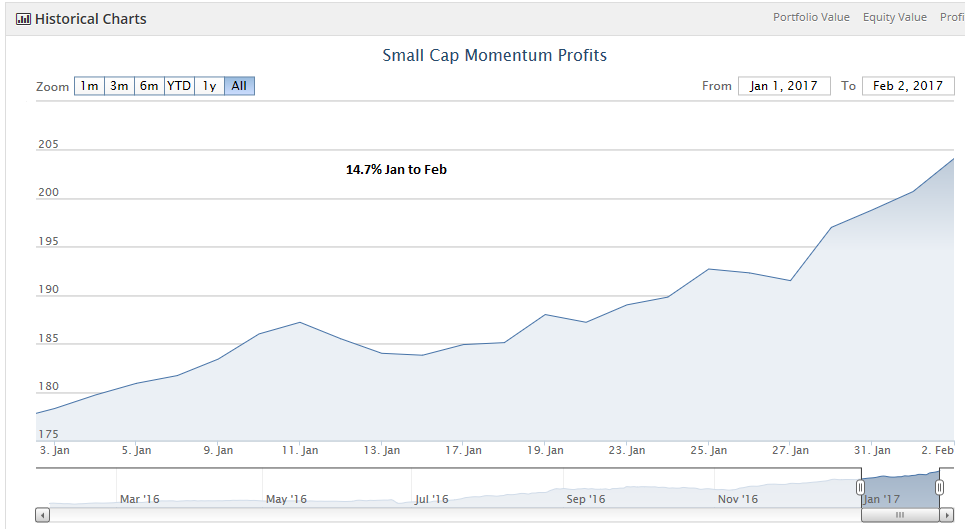
The screener generated 14 stocks on January2nd and generated a 14.7% return in one month.
The average spread was 1.29% leaving a very healthy profit.
All the shares still qualify for February so no transaction costs this month.
My theory is that the high momentum figure will drive the shares in the very short term i.e 30 days. The high stock rank will add some robustness whilst filtering out the weak.
thoughts???
Disclaimer
This is not financial advice. Our content is intended to be used and must be used for information and education purposes only. Please read our disclaimer and terms and conditions to understand our obligations.
58 comments
Since this screen is short term and relies heavily on Momentum, do you also use a stop loss?
My stop loss is any stock that drops below the 50 SMA. Or close all positions if 6 month SMA turns down.
Hi gpacker,
Have you had a chance to update for March's performance?
Hi Nick. Not at all. Interesting reading the thoughts... I'll just keep updating the system as and when for further discussion.
;-)
I've been digging a bit and these set of videos are interesting with respect to the term Efficient Frontier when calculating risk/return profiles and the subsequent videos show you how to tune the weightings of your stock selections to minimise risk and maximise returns ...
Graphing the efficient frontier for a two-stock portfolio in Excel
capital market line and sharpe ratio in excel
I hope you find them useful
Cheers
Phil
He does quite a good job of explaining the basics in those videos. What websites like Macroaxis do is to automate the process of maximising the Sharpe Ratio of a larger portfolio for you.
I wanted to echo what Howard said though. Volatility is not risk. And also, although these techniques do have validity they are making the assumption that past volatility and return are good estimates of future volatility and return. Often they are reasonable estimates but sometimes they are not. My own experience is that it can be used to sift out a set of good candidate stocks for a portfolio. But when I optimise the proportions of each stock in the portfolio using these techniques I find from backtesting that you can get a rather false sense of precision and accuracy from all the decimal places! So now I tend to take the recommended non-zero-weighted stocks for the portfolio but ultimately use an equal weighting for them. What I do take notice of though is when the optimiser starts allocating a proportion of zero to any stock which previously was a good non-zero-weight candidate.
Modern Portfolio Theory (MPT) suggests that if you just want the best return/volatility ratio from the whole market then you should simply use an index tracker and adjust the return (and risk) by keeping some fraction of your funds in cash or by using leverage. A key corollary of that is that you cannot eliminate all volatility from the portfolio. What remains is the market risk. And as we know, every so often all stocks crash at the same time and there is very little that can protect you when that happens. Market risk is always present.
The other point is that this is a pure technical analysis approach. It does not use quality or value factors when it makes recommendations. I find it a bit concerning that a website like Macroaxis seems to have no fundamental input at all. (If it does I missed it.) If a lot of investors start to use recommendations based entirely on TA without any FA input then they will create bubbles which will eventually implode on them.
Finally, I wanted to ask gpacker whether we are going too far off topic from his original aims for this thread. If so, we should decamp to a new thread to explore risk-adjusted momentum strategies.
.
Howard, this is why I believe systems like this will continue to work and not get arbitraged away, too many over estimate the risks involved. Also note this is not just a momentum strategy it is supported by other sound fundamentals.
Additionally the added holistic SMA will hugely reduce severe downturns, similar principle used through dual momentum.
Risk-adjusted is calculated assuming the strategy is held through downturns, this system will not be held through such periods.
How did Headlam (LON:HEAD) get a Momentum rank of 94? It did nothing all year until the middle of January and now it is up about 20%. It kind of confirms a concern I have about the Stockopedia momentum rank which is that it changes much more quickly than the other two ranks and might tend to reward volatility rather than steady performance.
Using a more conservative way of ranking by momentum (based on my own code) I find that Headlam (LON:HEAD) and also Morgan Sindall (LON:MGNS) RM (LON:RM.) are rather weak. (OK but also not great are: Severfield (LON:SFR) Northgate (LON:NTG) Vitec (LON:VTC) )
I imagine it would be to do with earnings upgrades - unless you factored this in already?
Ok herbie i'll have a look tomo.
In the meantime the screen view/zoom can be increased to see selections.
Ok... so we have 3 removed and 4 added.
Lets see how she goes....
Also, having researched considerably market direction and indicators, I will continue with this system until the FTSE 100 12 Month SMA starts to turn negative at which point I will turn to cash and rebalance when it turns positive.
20% return in 2 months is excellent. Just a thought if you set this up as a fantasy fund it would be easy for people to follow and for you to show on posts, also it will have the trades, it's a bit difficult to read on some screens.
A further 6.5% return for February.
20% return after costs for the first 2 months.
I'll update with selections/removals etc later this evening.
A promising start though....
Thanks MBB.
Sharelockholmes do have their own equivalents of QVM StockRank factors (including crossovers). The combined QVM is called the "Market" score These will not produce exactly the same results as StockRanks but I think you can consider it a close enough proxy. Here is a comparison of the two strategies with a 3 month reset:
Hi, no it doesn't unfortunately I looked myself yesterday.
its impossible to replicate a backtest against this on sharelockholmes?
Sharelockholmes allows backtesting of screens against quaterly snapshots going back to 2003, This makes it difficult to test how they perform over periods of less than three months. However, I generally find it a very useful resource for testing out new ideas.
Does Sharelockholmes have all historical data of StockRanks, Momentum Ranks, Basic Ranks and Crossover Ranks to allow you to back test?
I have had a go at back testing this screen on Sharelockholmes. I couldn’t replicate it exactly, as the bid spread criteria is not present (although with a market cap limit over 800M I doubt this makes much difference). More problematic is that the minimum period for assessing performance, is 3 months and so I can’t say exactly what the performance looks like if the strategy was reset every month.
The average 3 month returns point to performance over the longer term being less successful than a simple 90+ StockRank type strategy. Also, the variance was high - more than twice – so it is also higher risk.
Although it is likely that the strategy works better on paper with a one month reset, this would inevitably result in more churn and higher transaction costs. Bid spreads, stamp duty and broker fees will cut into profits, and so this kind of strategy needs to outperform lower churning strategies to actually be worth the candle.
It would be interesting to see how this pans out longer term but I would urge caution before throwing too much money into this.
Hi rhomboid1,
It certainly looks like I missed a trick here. The stock has risen c.33% since I first started my portfolio in November and I would have held it for the entire three months.
In hind sight I should have bought the stock, but I wanted to be extra safe with a profitability metric.
Two reasons which put me off are:
All the best with Capital Drilling (LON:CAPD) though! I hope to take advantage of the resurgent mining & energy sectors in 2017. I will be monitoring Capital Drilling for sure!
Ben
Thanks Ben, no sorting required because there were only 14 stocks. however this may change when I introduce European stock......
Point taken above 20m but I also like a maximum as I believe they are easier to move with momentum.
Yes, expanding to European stocks will give you a much broader choice. I'm subscribed to the UK but I am thinking of expanding into Europe and the U.S.
I agree with the weighting towards small caps, they certainty outperform over the long run. So far, very few large cap stocks have qualified for this screen. The only one I can think of was HSBC Holdings (LON:HSBA), but it didn't qualify on the day of re-balancing.
However, I did some retrospective back testing with a few stocks under £20m (simply looking at the historical Stockopedia reports manually). Sopheon (LON:SPE)could have qualified and subsequently multi-bagged
So I could be missing out on a few gems by having a £20m cut off point... I guess I will just have to join the party later, with these stocks!
Hi gpacker,
I have a very similar strategy to yours and I'm up 32% in three months! My strategy places more emphasis towards value & momentum though.
My criteria are as follows:
Sort by descending RS 6M and select the top 10 stocks. Re-balance monthly.
From my experience so far, the strategy works very well as long as your disciplined on spreads. I tend to exclude stocks less than £20m which gets rid of the illiquid nano caps. I think you should also include a ROE > 0 as an extra layer of protection. This helps me cut out "Value and Momentum" traps. A perfect example of this is Capital Drilling (LON:CAPD), which doesn't make a profit.
What metric do you sort the stocks by? (Sorting my six months relative strength worked very well for me).
Ben
Hi Ben
I hold Capital Drilling (LON:CAPD) from half the current price & i think you may have missed its key attributes, they're gearing up their business & their rigs to reflect a massively improved macro environment, so today they raised revenue forecasts by more than 20% for 2017, I'd say they're better set now than at any time since I bought in , rig utilisation is the key metric and that in Q4 is at a recent high.
Cheers
Thanks for the feedback all, I will keep posting performance here to see how it goes.
Another consideration I have is to include European stocks too to widen diversification. i.e if a uk stock falls out the criteria at the end of the month I will replace with a European until it is evenly balanced.
Here is an analysis which I would like to share with this thread, since the idea came from this source.
The question is, how much of the SP momentum over 1 month gets carried on in subsequent months?
To test this statistically, I did the following
- identify the top 20 growth stocks in a particular month
- calculate average % growth
- calculate the same group's average performance for each of the following 3 months
My database consisted of all LSE shares except oilers and minerals and investment trusts; and market cap between £10m to £1000m
Here are the results
The general conclusion is that strong growth in a particular month tails off pretty quickly.
June 2016 looks peculiar and I think that might have to do with the Brexit vote when markets moved up significantly post Brexit.
Of course, there is no re-balancing here. So the fact that gpacker's method re-balances every month should in theory make a positive difference.
Interesting, I think.
Just an afterthought. Even if your Feb performance is half your Jan performance, say 7% , that is still huge for one month's gain.
Return is one thing.
Risk-adjusted return is another.
I always remind myself of this everytime I play Russian Roulette.
;|
Hi Howard,
So what would be you're preferred measure of risk adjusted returns and what would be an acceptable value?
Warm regards
Phil
Phil
I think you have asked the key investment question. After all, an investors’ returns tell just half the story. We have to know how much risk an investor took to get those returns before we can judge whether they did a good or a bad job.
Investing involves just one thing
Investing can be said to boil down to one thing: dealing with the future. And to the extent that the future cannot be known with any certainty, it involves risk. Investing is hence an exercise in risk management.
Volatility is not risk
Volatility is the academic’s choice for defining and measuring risk. Things turned out this way because volatility is quantifiable and thus usable in the calculations and models of modern finance theory. However, while volatility is quantifiable it falls far short as the definition of investment risk – after all, what investors fear most is the risk of permanent loss, rather than volatility. Yet such a risk cannot be accurately quantified in advance any more than the chance of rain can be accurately forecast.
It gets worse
Worse than that, you don’t even know AFTER the event how must risk was taken. If you buy shares for £1/each and sell a year later for £2/each, was it a risky decision or not? Some investors would say the profit proves it was safe, while the academic would say it was clearly risky, since the only way to make 100% in a year is by taking a lot of risk. Nobody knows. It may have been a lucky dart throw or a great, safe investment.
Summary
In the long term, high returns can be considered to be attributable to one or more of the following:
• A reward for bearing high risk (this assumes markets are generally ‘efficient’)
• A reward for exploiting a behavioral factor e.g. momentum (this assumes some degree of market inefficiency)
• Genuine stock-picking skill (alpha)
Of course, we can learn little by analyzing short term returns as in short term financial markets, randomness rules – there is no law of small numbers.
Hi Howard,
I think i have requested that the Guru screen be updated to include Sharpe ratios so that we can get a sense of how risky they typically are.
It's made me laugh before when I've described my 3 year annualised performance (4 years now) on previous threads there were some comments about 'high risk' and 'chasing big risky returns' at which point I provided the x-rayed analysis of my portfolios.
Since switching to a Stockopedia QM screening approach allied with TA my returns have increased and my risk profile has reduced.
I do like the idea of using the Sharpe ratio of potential investments as one of my final selection factors if faced with a few options. At present PEGR is my current differentiator of choice but perhaps a combination of the two will prove effective and will help to reduce drawdowns and the difficult choices around when to sell.
With regard to exploiting behavioural factors I was particularly pleased when I was placing a telephone order earlier today for French small/mid cap injection moulding specialist Plastiques Du Val De Loire SA when the broker questioned "Where do you find these companies?". It was like music to my ears.
I appreciate your comments, it's been an interesting thread all round and when I find time I'm going to start looking at automating the calcualtion of Sharpe ratios on potental stock picks and my portfolios overall.
Cheers
Phil
Hi Phil,
I would also be interested in Sharpe ratios.
You maybe interested to know I have been adding European shares to my portfolio this year, the ones in January are already up about 15%. CE2 is the best performing. I would have bought some more but my broker does not do some online such as Delta Plus, surprisingly PVL is available to trade online. Is there anywhere to get more information on European shares?
Hi Herbie,
I dont really dig any deeper into the companies background beyond passing my screens and the TA looking good.
I do read the last two quarterly updates and reject any that are negative.
That's as far as much research goes.
Not sure that helps
Phil
Que? I haven't mentioned or referred to "risk adjusted" in any of my posts in this thread.
But your mention of Russian Roulette is amusing.
He is saying that high returns are one thing but at what cost?
So he's interested in the risk adjusted returns of the approach.
For example I've just "x-rayed" my SIPP on YouInvest and the three year details were ...
3 year annualised return 33%
Std Dev 9
Mean 29
Sharpe ratio 3.2
Alpha 25
Beta 0.3
Hope that helps
Phil
As an experiment I took the stocks with the best risk-adjusted returns over one year, keeping at least one from each sector, and compared the resulting portfolio with the February "high-momentum-ranking" portfolio found by gpacker in post 28.
The high momentum portfolio looks like this:
where the white line is the median performance and the magenta line is the mean performance of the portfolio over the previous year. You can see that the rules have selected stocks which have made big movements especially in the last 3-6 months, with the performance before July 2016 being quite flat.
The risk-adjusted-return portfolio over the same time period looks like this:
The "risk-adjusted" aspect tries to minimise volatility so the median and mean performance are closer and the gain is more uniform over the year. (The plot uses a log scale so a straight line would indicate zero volatility.)
Of course,as they say, past performance is not necessarily a guide to the future, so I'm not making any recommendation - just showing what filtering by risk-adjusted returns looks like.
For those curious the stocks in the second portfolio are:
RTO TET FEVR MCGN KWS BUR CTH ANCR BOO BJU FCRM CRPR APF SAT IAE
Nick,
I am very interested in your 'risk-adjusted' approach. You wrote in your latest post:
"The "risk-adjusted" aspect tries to minimise volatility so the median and mean performance are closer and the gain is more uniform over the year."
and you wrote in a previous post:
"Using a more conservative way of ranking by momentum (based on my own code)"
Are you willing to provide any more details about your approach?
Hi pka
Happy to provide more detail about my approach but on my phone at the moment so I'll give a quick explanation and expand later.
Basically I just calculate the Sharpe Ratio based on daily returns SR = (u-r)/s and pick the stocks with the highest values. The problem is that most screeners don't seem to provide Sharpe Ratio data so you tend to have to roll your own.
Hi Nick - as a matter of interest what value do you assume for the risk free rate, r ?
I usually use the daily rate equivalent of 25% per annum (approx 0.09% per day). I've experimented with other values but provided you have a value in roughly this area you get similar results. Obviously that is higher than a typical interest rate on risk-free assets. But it works more like a "minimum acceptable rate" that you are prepared to accept.
Hi Nick,
Thanks for your reply to my question about your risk-adjusted momentum approach.
You might find the following web page of interest, if you haven't already seen it, because it summarises various approaches to risk-adjusted momentum and gives some references to academic papers on them:
http://www.quantsportal.com/momentum-strategies/
Thanks pka. So basically I am following what they call the "risk-adjusted momentum" strategy. The equivalent of their "figure 1" for the stocks we have discussed in this thread looks like this using 256-day data:
(You will need to right-click on the diagram and select "View Image" to see a bigger version to read the individual stocks.) It plots the mean return vertically and the volatility horizontally. If you choose momentum without the risk adjustment then generally you prefer stocks which are as high as possible without worrying about where they are horizontally. But when you consider risk as well you want stocks which are on the "efficient frontier" - the outer envelope of the cloud of stocks.
The reason to adjust for risk is this. If you had two stocks A and B with estimated returns of 10% and 20% then you could still use A to get a return of 20% by using 2:1 leverage. So which is the better choice: A with leverage or B? The answer depends on how reliable your estimate of those returns is. If you accept that volatility is a good measure of the "risk" (variability) of the returns, then by dividing each return by the risk you will get a measure of which stock will have the more certain return.
I can't find any stock screener for UK stocks which uses these techniques. Perhaps there is an opportunity going begging for Stockopedia to fill the void here!
However there is a site which seems to provide a very thorough web-based interface to this kind of optimization for US stocks here: Macroaxis (Disclaimer: I don't know anything about that site and I am not explicitly recommending it.)
I had a look at the macroaxis site and it is so overwhelmingly complex. I might try to do some number crunching on my individual stocks using yahoo finance api to examine my portfolio and future selections
From their "about us" section :-)
"The Macroaxis financial engineering platform does not need much introduction or walkthrough. We could put together an educational video; but you can make it on your own, really. Just create an account, create a portfolio, then just click around - "simplicity" is what we are all about."
Haha!
It doesn't help that you are limited to a certain number of screens a day.
So I perused their website to get a feel for the options then went in to analyse something specific and it said "You need to upgrade!"
That sort of thing drives me potty. Let me try it out and let the product sell itself to me and if it's useful I'll pay for it.
Ho hum
Gpacker, to echo others, thanks for sharing your thoughts and an interesting potential strategy.
One thought I had when reading - will January turn out to be a bit of an outlier? As the month is quite busy for trading updates following Dec Y/Es, the announcements are likely to be at least partially responsible for the strong 14.7% return here... aside from just momentum per se. (NB. I haven't looked to see when the reporting date is for each of these 14 stocks.) It will be interesting therefore to see how the strategy fares over the forthcoming months, especially ones that are typically quieter for news flows.
That said, you might argue that the high momentum scores at the beginning of the month partly reflect the market's expectation that any forthcoming TUs would be positive - so perhaps it's somewhat circular!
Does that make sense - or am I over-complicating things?!
Hi GPacker,
Very interesting ideas here, I'd be interested in finding out how you open a position and how you exit a position.
Hi gpacker -
excellent piece of work. A great example of Occam's Razor - the principle that simpler solutions should always be preferred to complicated ones.
Couple of observations.
- you might try adding a filter such as PEG<1. But I guess that this might already be within the formula that calculates the Momentum Rank
- as the rebalancing is throwing up the same stocks, it will be fascinating to see what growth you experience for February
A pity that stocko does not give us the tools to back test your method.
The other aspect I would like to see is not only the momentum rank figure but the trend of the momentum figure over a set period.
I.E. I may select a stock at 95 momentum however 2 months earlier it may have been 99 and is a decreasing trend. Ideally I want to select 95 momentum rank that was previously 90 2 months earlier showing an improving trend.
Momentum within momentum if you like.......
Is this possible?
Thanks for the information folks. Now everything is working OK. I have just been watching a great DVD called The Secret Kingdom with Pat Robertson of the 700 Club, available on site. It explains how laws work, with regard to finance covering laws of use, persistence, expectation, compound interest & reciprocity and more to help us all prosper.
Over the last few weeks they have been bringing in over $1M a week! So it certainly works.
Most of the money goes all over the world to help other people that are less fortunate than us.
I remember a while ago when people were asking him where they should put their money & he said "put it with good companies that pay a good dividend of around 6% interest" and I have not forgotten that.
Hence the selection of collecting a 30p dividend with GAW which works out at about 3.5% (30p/836p) for the taking.
It will be interesting to see how the search continues through FEB. Certainly worth monitoring. If it continues at that rate that is over 200% in a year.
Ah - Polypipe and Empresaria are showing 94 on momentum and not 95 hence i'm seeing more selections.
I decided to keep them in due to the small variance since Jan. (should have made that clear sorry)
PS - You can you zoom on your PC settings to see the detail.
Hi - screen can be enlarged on an iPad. 3 Missing shares are - Empresaria (LON:EMR) , Northgate (LON:NTG) , Polypipe (LON:PLP) . The rest of your list are in the original.
Gus.
Now managed to get the spread incorporated into the search.with a bit of persistence. What has changed since your first search with 14 shares which I cannot see because the screen is too small to read. Can somebody either enlarge the screen or let us know the shares in it please Gapatcher? Please let me know.
The search now reveals 11 shares in no particular order :-
HEAD, CAML, WIN, IQE, GAW, TRI, SFR, CTH, TAP, SOM, & SPE.
Either there are 3 less shares in the selection now or some are different all together. Worth a look. Incidently nothing changed by adding the spread.
Possibly by altering the market cap it may catch a few more selections.
agreed. One to watch
Hi Gpacker,
That is pretty impressive for the start of the year. The main thing is that it works well. I can't seem to find the spread which is important to have included. How do you find it and add it in?
Running the screen without the spread brings up 11 shares of which I can just about make out GAW from your list which I am holding. Well done.
Simple but effective