Summer's big winners: Are UK large caps overheating?

When I wrote The Week Ahead recently, I was surprised to see that the large cap indices, such as the FTSE 100, had significantly outperformed those that track smaller companies so far this year. Having had a poor start to the year, smaller companies bounced back strongly from the Trump Tariff Tantrum in April, catching up with larger caps by the start of July. However, over the last two months, the FTSE100 has continued to be on fire, whereas smaller companies have wilted in the heat:
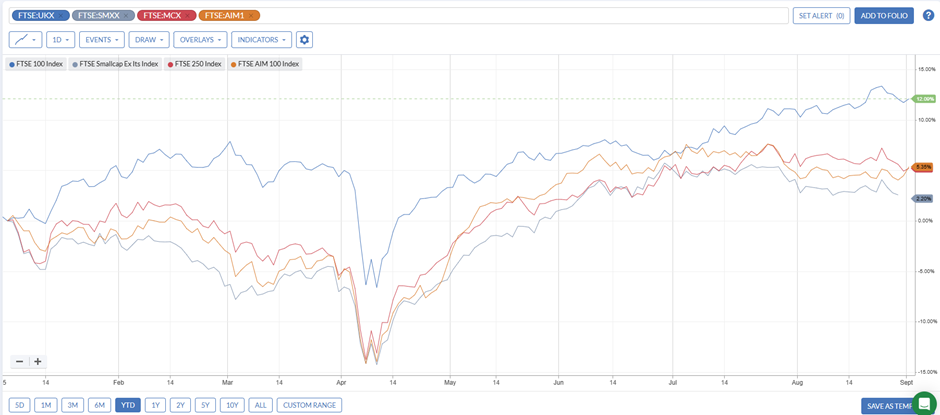
The FTSE 250 has tracked the smaller stocks rather than joined in the FTSE100 rally, meaning that this outperformance has been concentrated in the largest stocks.
Fund Flows
The malaise surrounding UK stocks, and small caps in particular, is well known. Retail fund flows out of UK equity funds have been pretty much continuous over the last few years, and this has severely impacted smaller companies. Here is the monthly figures for fund flows from the Investment Association:
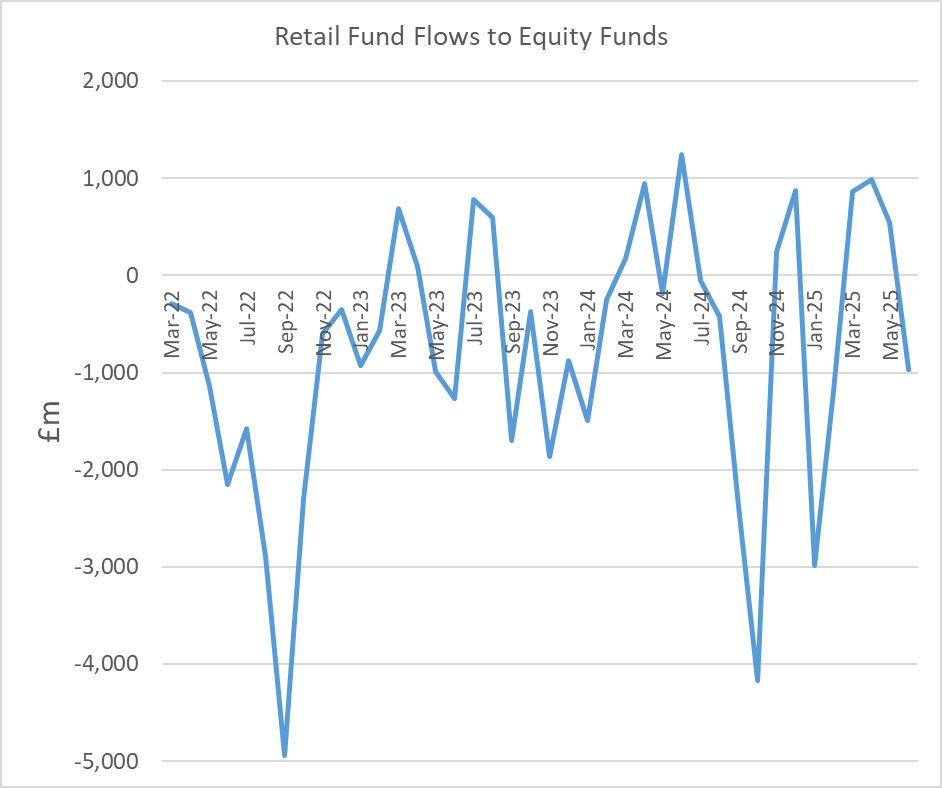
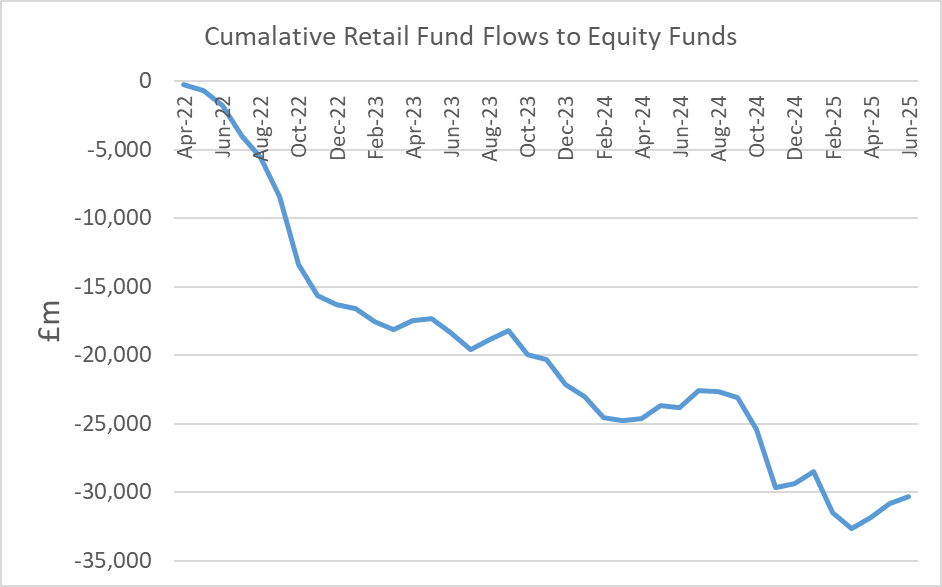
The data here is noisy, and there is the occasional positive month, but the cumulative figures show that this is really just bumping along the bottom:
The AIM market was particularly badly hit last year by the partial removal of some of the tax reliefs its constituents enjoy, and the rumours of that change in the run-up to last Autumn’s budget. Over a two-year period, we see that FTSE Smallcap Ex Its Index (FTSE:SMXX) has largely kept pace with FTSE 100 Index (FTSE:UKX), and the FTSE AIM 100 Index (FTSE:AIM1) started to underperform when the new government came to power:
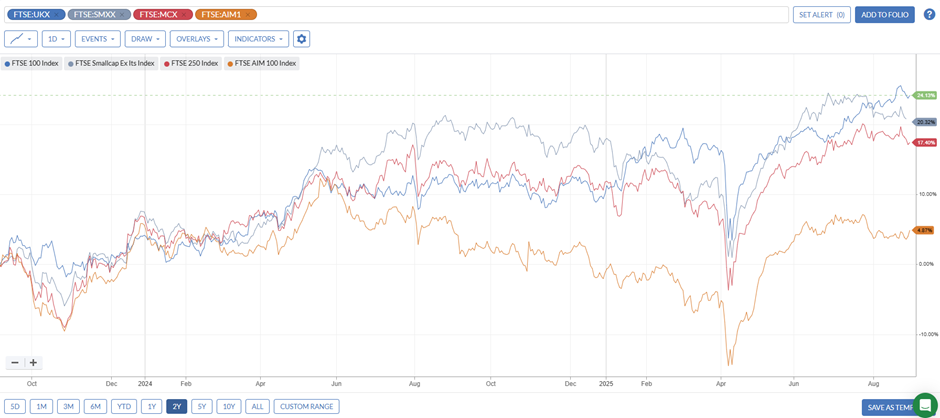
This effect shouldn’t be the cause of this year’s underperformance, as regulation is unlikely to change again so soon, and AIM has been joined by similar-sized non-AIM stocks in underperforming. This is particularly frustrating for those of us who tend to focus on smaller companies where we think we have a better chance of having an investment edge. However, it is possible that such moves may be logical. Larger companies tend to have economies of scale, global operations and better management. These may mean that they are better able to navigate difficult economic conditions, and the outperformance may reflect better business performance.
So which is it? Is the underperformance of smaller companies a rational response to their declining prospects versus large caps, or is it an irrational allocation of capital driven by sentiment? I attempted to answer this question with some data.
Methodology
I selected all stocks in the Stockopedia database that have a primary listing in the UK and a market capitalisation of over £10m. I then excluded non-trading companies, such as listed investment trusts, REITs, VCT funds or similar investment vehicles. This required some judgment, as many investment firms and property companies have both an investment arm and a trading business. I chose to include any business that had a significant trading part. This left just over 800 companies, which I then divided into size deciles, each comprising approximately 80 companies. This means the largest decile most closely matches the FTSE100, and deciles 2-4 together most closely match the FTSE250. Although this alignment is far from exact, due to both the size of the deciles and that market cap is not the only factor used to determine inclusion in these indices. I then looked at the average metrics for these deciles. When conducting analyses such as this, it is usually better to use median figures, so that one or two extreme points don’t skew the results. Unless stated otherwise, the figures in the rest of this article will be the median, not the mean.
Results
Quality Differences
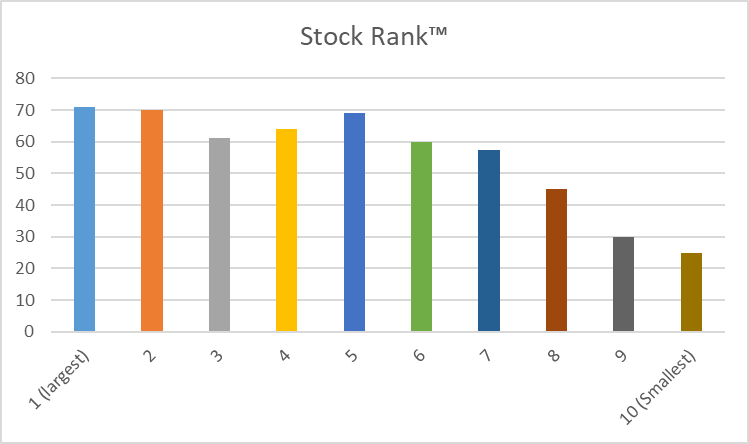
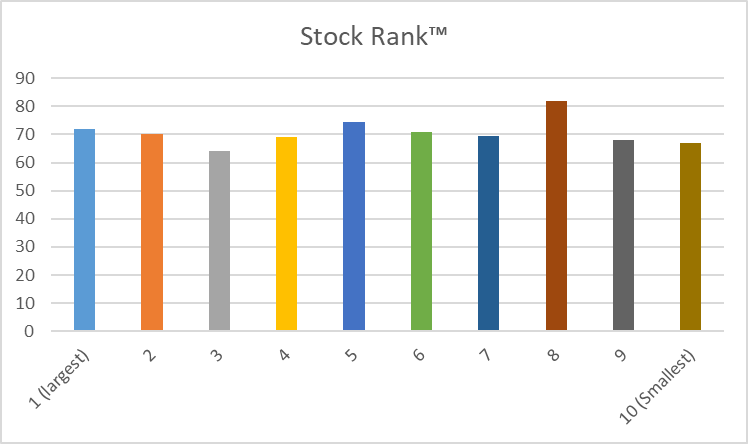
The first noteworthy point is that larger companies have higher Stock Ranks, on average:
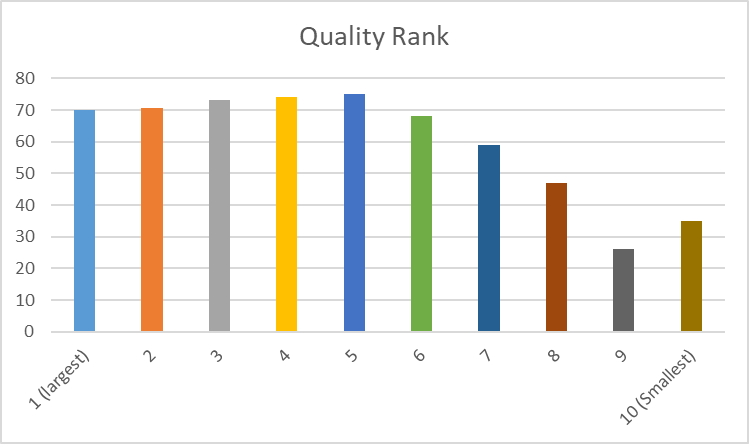
One of the biggest factors influencing this is that the average Quality Rank is above 70 for the first five deciles (which represent companies down to £113m market cap):
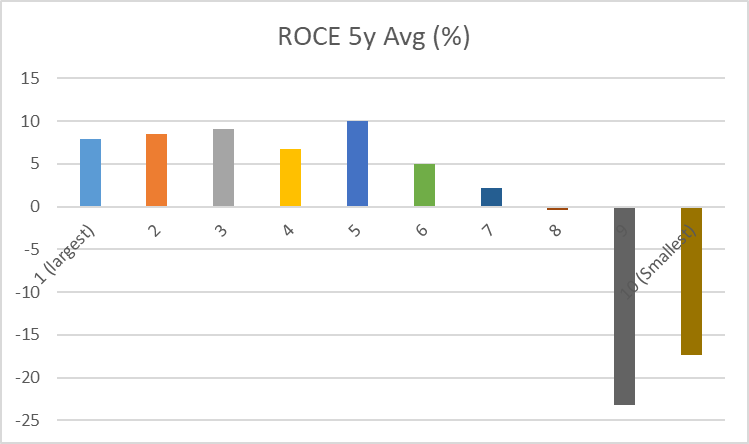
Long-term returns of capital back this up, with the median 5-year ROCE negative for the lowest three deciles (representing companies with a market cap below £58m):
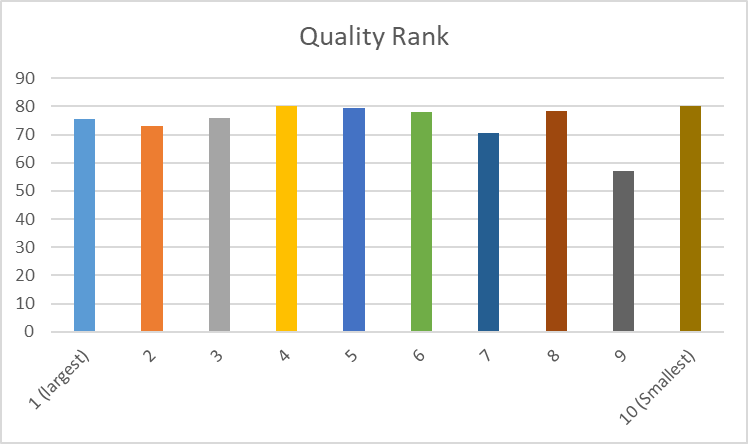
However, we also know that the smaller end of the market can have a significant tail of loss-making companies of the type that most of us would consider uninvestable. If I only include profitable companies, the average Quality Rank is much more stable across the deciles:
Indeed, the average Stock Rank amongst profitable companies is highest in decile 8:
Momentum differences
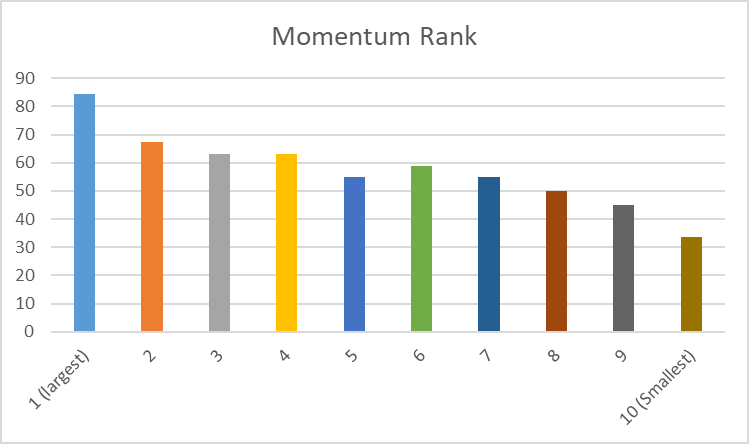
In a market where large has outperformed small, it is perhaps unsurprising that the median Momentum Rank is highest for the first decile and declines as you go through the size deciles:
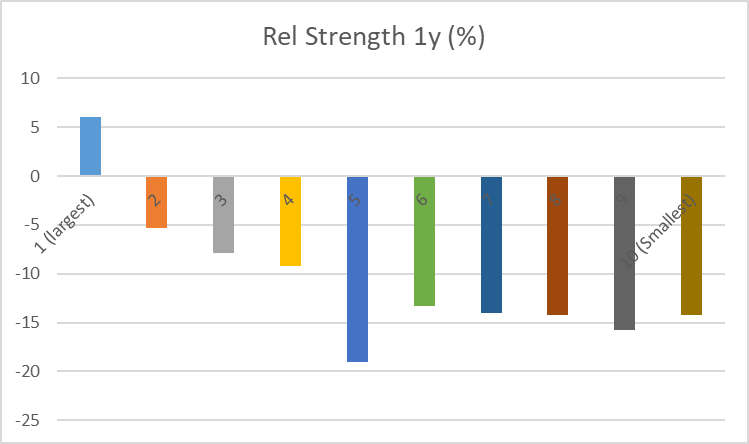
Only the highest decile, roughly representing the FTSE100, has seen positive 1-year relative strength. All of the wider UK market returns have been here in the large caps:
However, there also seems to be some rationality to the share price moves, with the Momentum Rank much higher at the lower end when only profitable companies are included:
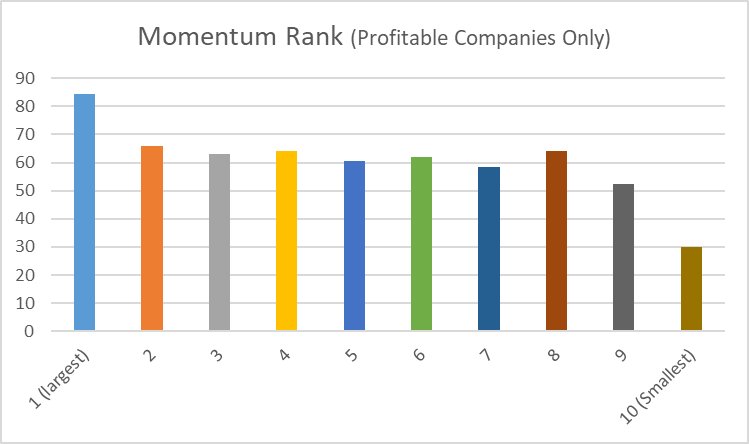
It seems that as far down as decile 9, the market has preferred to own profitable companies, which makes sense in difficult economic conditions. However, even profitability hasn’t helped the smallest decile of stocks with market caps between £10m-16m, which have been selling off regardless.
Valuation differences
Recent price moves appear to have left a big valuation gap between the largest and smallest stocks, with the median EV/EBITDA of the smallest decile around half that of the largest:
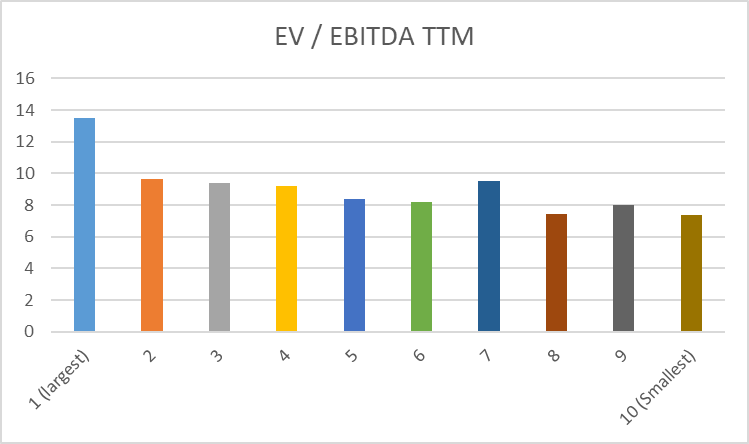
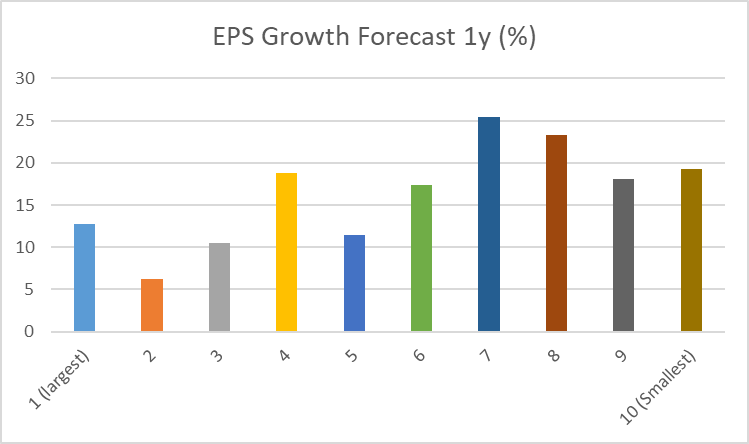
This completely upends the usual state of affairs, where the market tends to give smaller companies higher ratings to reflect their higher growth potential. These are unusual times, and perhaps the larger caps currently have greater forecast earnings growth. However, this hypothesis doesn’t seem to be borne out by the data, with deciles 7-10 leading the way on 1-year forecast EPS growth:
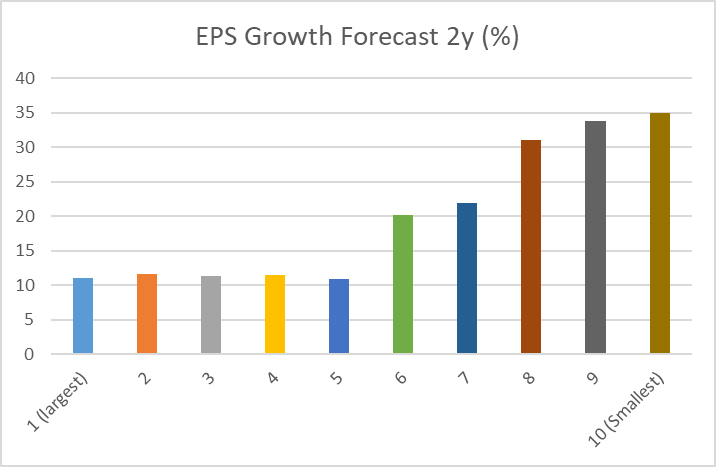
We have to take longer-term brokers' forecasts with a pinch of salt, but the 2-year EPS growth rates are even more starkly in favour of smaller companies:
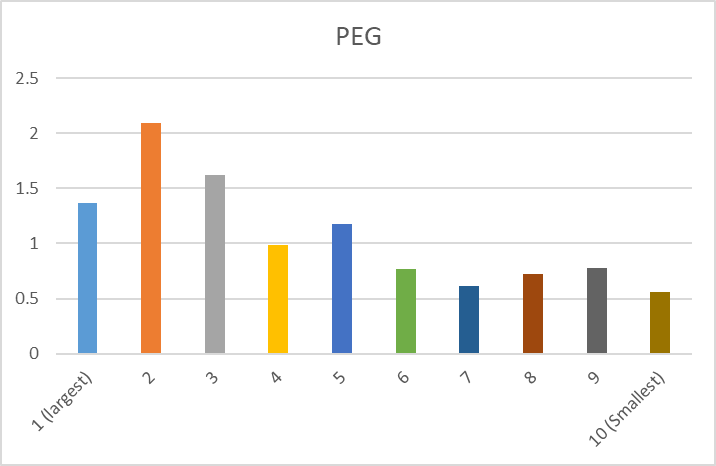
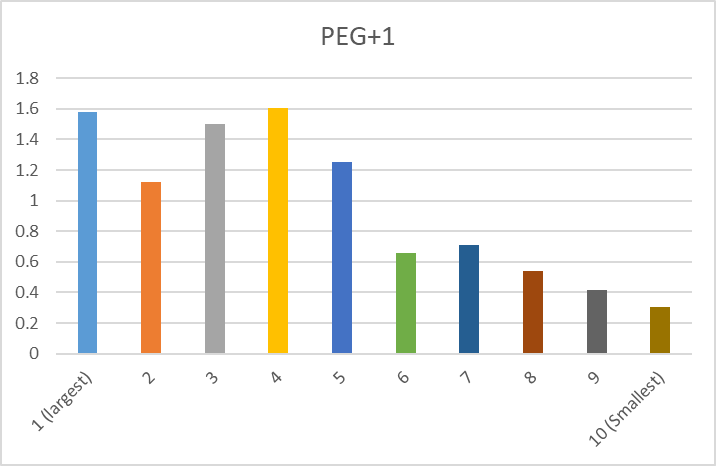
One way of combing valuation and growth is to use the PEG ratio. This takes the P/E and divides it by the forecast EPS growth rates. Doing this calculation for the median P/E and median EPS growth for each decile indicates that deciles 1-3 are generally less attractive to own on this metric, on average. Whereas, deciles 6 to 10 look significantly undervalued compared to their growth rates, as many investors consider a PEG ratio below one to indicate possible undervaluation:
Earnings momentum differences
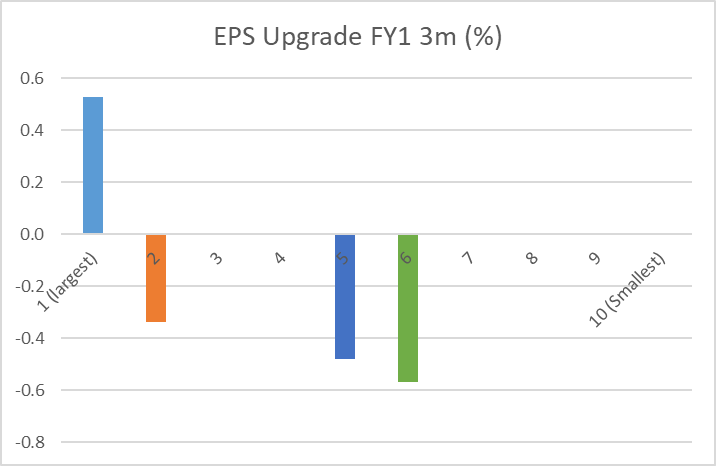
There is a further possibility to consider. Perhaps the larger caps have seen much higher upgrades in earnings over the summer, and the recent strength represents that these are on the ascendancy. Similarly, brokers may have taken the axe to smaller company forecasts recently, making the share price moves here more logical. However, this doesn’t seem to be supported by the data. The largest decile has indeed seen the biggest upgrade in forecast EPS. However, at just 0.5%, this should not be significant enough to move the market by 5% or more:
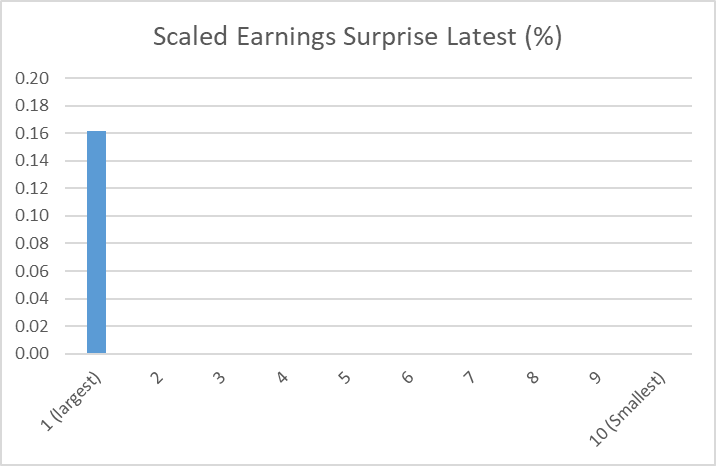
The same effect is visible in the scaled earnings surprise over the last three months. The median value for the largest companies is positive, whereas for the rest of the deciles it is zero. This means that the vast majority of small and medium caps have seen no earnings surprise (perhaps due to the reporting timetable). The largest decile of companies has seen just 0.16% earnings surprise on average. Again, this seems insignificant compared to the relative price moves:
Overall, changes in brokers’ forecasts don’t seem to explain the outperformance of larger companies.
Conclusion
Pure Momentum investors should continue to focus on the largest companies, where the Momentum Ranks are strongest at the moment. However, the positive price moves here don’t seem to be backed up by any real fundamental change in prospects for the largest businesses. They remain the laggards in terms of forecast growth, yet appear expensive compared to smaller peers. I don’t know why the market has favoured the largest companies over this period. It may be passive flows being directed to the FTSE100, or simply that the smallest end of the market is dominated by individual investors, and they have been particularly pessimistic of late. However, the relative share price moves appear to have no valuation or earnings momentum-based explanation, and hence seem vulnerable to mean reversion over time.
To a small cap fund manager, now is always the time to invest in small cap shares, and I am wary that the same bias may apply to small cap investors. However, the valuation gap between the largest and smallest companies now appears to be stark. On average, small cap investors who focus on profitable companies, are getting equal quality investments, with higher growth prospects but paying half the price. I don’t know when this anomaly may correct, but when it does, I expect the returns to those who invest in the right companies to be significant.
Disclaimer
This is not financial advice. Our content is intended to be used and must be used for information and education purposes only. Please read our disclaimer and terms and conditions to understand our obligations.
5 comments
One thing I have noticed is that for small companies, broker forecasts seem to be too optimistic more often than for larger companies. Large Caps have more brokers researching the stock, and big misses are less common than on AIM. At least that's how it seems to me! With some small cos, you need a whole salt cellar when considering peg+1.
And as Mark says, the past three months aren't a great time to be looking at earnings surprise as many companies have not reported.
Thanks for the analysis and your views Mark.
My recent buys (3) have had market caps of 225/215/150m (and already up an average of 15% in only a few months). I am pretty much exclusively focusing my research around this area of the market. I do have good exposure to large caps but by and large, the better performers have valuations that are just too high to tempt me to add. For now at least.
Comprehensive analysis Mark, thank you. Your final paragraph made me smile, I need to drop the mentioned bias and concentrate on profitable shares. MBH caught me out this morning, I'd ignored the almost always accurate warning of regular selling before results. A decent profit has turned into a small loss which I'm tempted to take and switch to the better stock ranks of Eurocell which might have fallen in sympathy today. I'll wait for Roland's analysis on MBH before deciding.
It's a tricky one isn't it? I had Michelmersh Brick Holdings (LON:MBH) down as a potential winner, after all Forterra (LON:FORT) beat expectations recently and are on double the rating. Didn't have enough confidence in the read across to take a position, and yesterday's results show that was right. Although I am still none the wiser as to what the difference is. The discount to TBV is presumably acting as a bit of a support as teh price hasn't fallen much today. Eurocell (LON:ECEL) also looks cheap but again the fear is that tomorrows results bring further pain!