The 2023 NAPS Webinar - A Deep Dive Into Systematic Investing In 2023

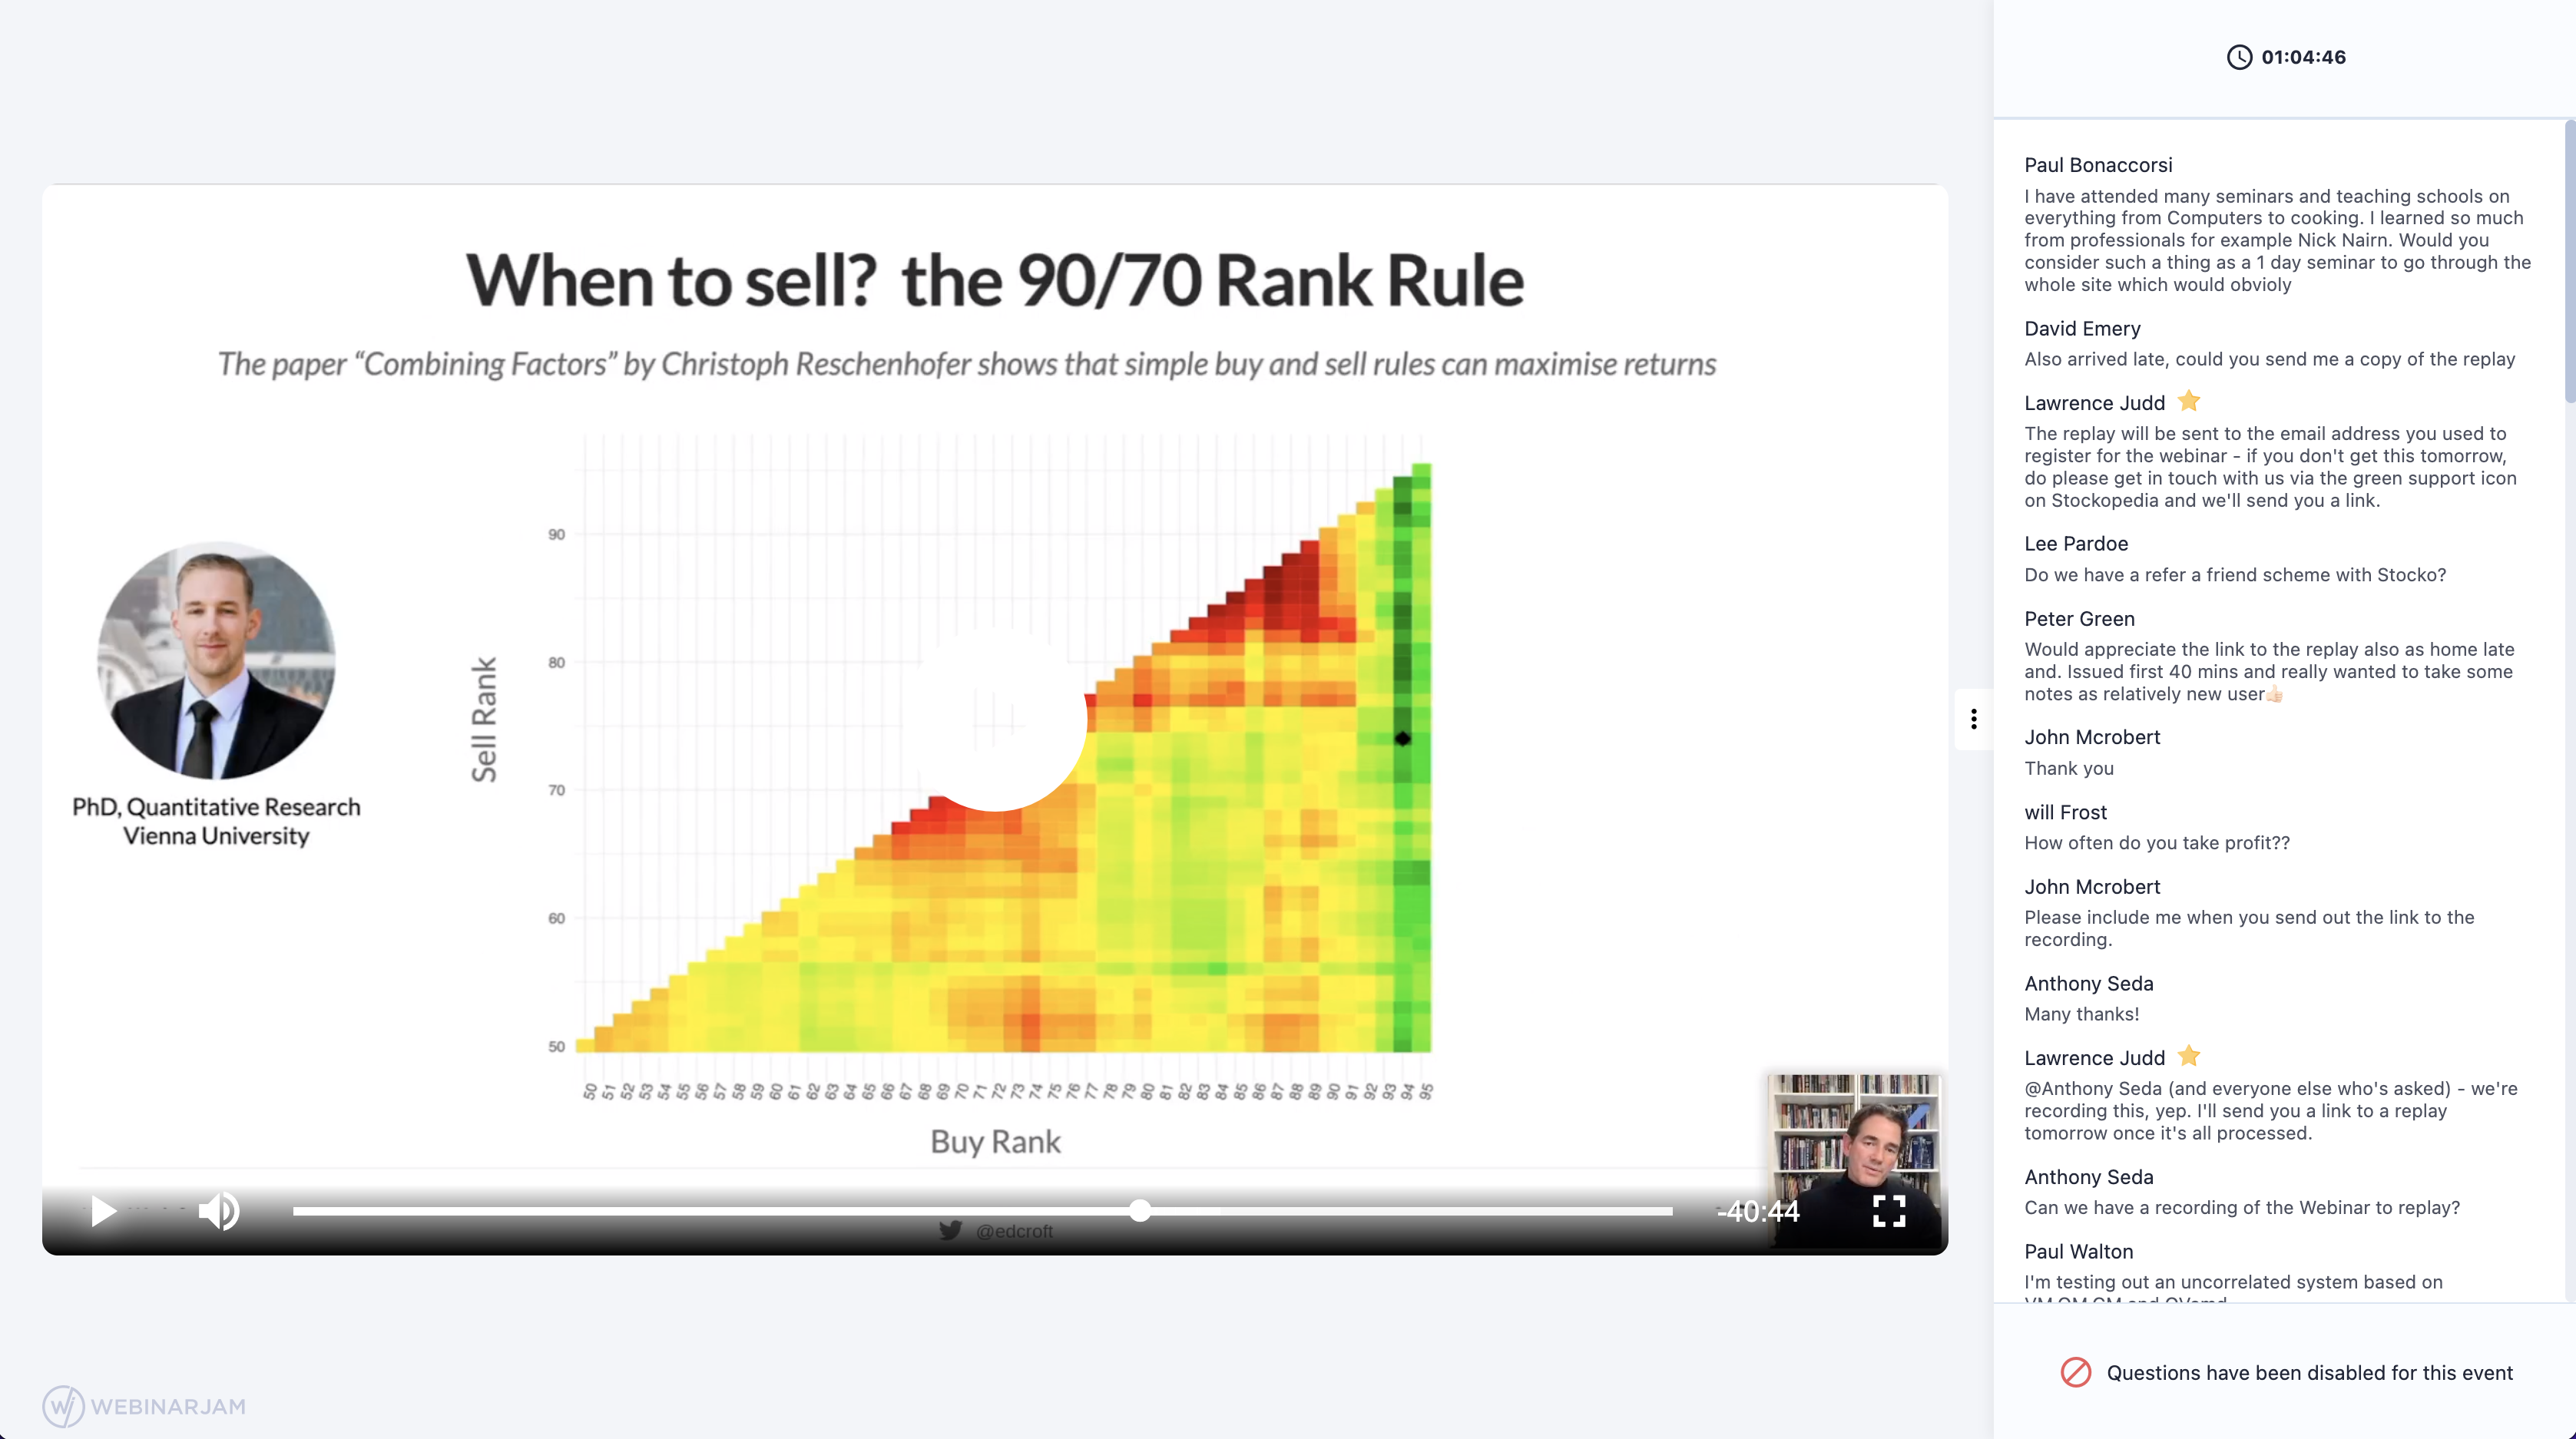
Last night, Ed and I were delighted to be joined by 852 of you for a deep dive into the NAPS process and results over the last 8 years. We loved interacting with you on the webinar; thank you so much for the great questions and positive feedback at the end. Certainly made for a fun Thursday evening!
We had many requests from those who attended to receive a recording of the replay, so I thought it worth publishing here as well.
You can find a link to the replay here, and the slides can be found here.
Given the terrific response, we're looking to do more of these in due course - so keep an eye out for webinar invitations. If you have any topics you'd like us to cover, do please let us know in the comments.
Disclaimer
This is not financial advice. Our content is intended to be used and must be used for information and education purposes only. Please read our disclaimer and terms and conditions to understand our obligations.
31 comments
Thanks Ed. My initial thoughts on the naps is investors have the universe to invest in & considering the uk including FTSE 100 is only approx 4% of world markets, shouldn't investors only be using a small % of their portfolios to invest in the uk.My other thought is should the naps be compared with S&P 500.
Watched this great webinar and then set up my first naps portfolio. Intrigued to see how it goes.
My question is, do you reinvest dividends in the 12 months, or leave them as cash for the rejigged naps in 12 months time?
Just wondering if there are any value/momentum ETF's (or similar) for the FTSE 350 (or similar). There is a Q/V/M one for the S&P500 which I've held for a short while.
Obviously I could create my own, but wasn't wanting to put a large amount into it and don't want all of the dealing charges etc. I'd rather just pick up a low-cost ETF and let them deal with the stuff.
Ed
An excellent and informative seminar.
Your mention of the recent Reschenhofer “Combining Factors” paper peaked my interest to download it. Lots of complex data included, but several things struck me:
This 65 year back test validates high Stockrank type outperformance, particularly for smaller companies.
Have you ever looked at data generated by not buying high Stockrank NAP companies with a <50% Momentum rank? My hunch is that this could work well.
Thanks for the useful presentation. I was trying to find where the e-books referred to are on Stockopedia: can you give me a link please, as I can't see them under the headings on the left. TIA
Is this what you are looking for: https://www.stockopedia.com/bo...
they are under Learn.
Great, thanks Rusty. I suspect they were off my screen to the right when I was looking, even though I have a very wide screen.
I've not 'blended' before so focusing on this screen with each share and where it fits.
Did not even see the three tabs on the bubble chart so if chose say to 'screen' VM can also see how it does with QM etc (staring you in the face duh!).
So 'Ed'ucation is so important in getting best value from the site and the 'learn' tab.
Got the comment on the US as an outlier for the system. Run UK/US screen and there is one or two UK for loads of US four greens, so why should I bother with the LSE other than pride, home support (emotion bad) but then not the end of the story.
Some are dual listing which warrants some analysis. The conversation over Beximco Pharmaceuticals (LON:BXP) and arbitrage was interesting.
Great webinar thingy thanks and the screen shots downloaded as pdf so can pause the recording and study properly worked well. Invested in another screen which means I'm becoming a pro lol.
Excellent presentation - very worth while watch and delivered at an opportune time. - Look forward to future presentations.
I caught this on ‘catch up’ - Excellent! Very informative, thought provoking and enjoyable. Thanks, more please.
Ed, think some of your figures on the big winners were a bit off, in 2020 there were 4 over 150%. Re stop losses, depending where set them, of course but would probably have taken you out of 2 or 3 of those. Nothing worse than taking say a 15% loss and then watching the stock climb 150%, that is 165% difference plus transaction fees.
I did have a look stop losses on NAPS, apart from last year they did not make much difference, people focus too much on the losses but you can more by selling. 2020 you would have lost money using stop losses unless you buy back in straight away.
Auto stop losses can take you of more stocks than you may think, many charts are based on closing prices not the actual day's low. I did get stoped out of IG Design (LON:IGR) and dud not buy back because the price shot, would you pay 30% more for a stock that you got stopped out of? I find that difficult to do, also once bitten, twice shy.
Maybe your team could do some research and back testing on NAPS stop losses?
The replay doesn’t seem to work on an I Pad
It works on mine. Had to sign into a web chat room first.
Thanks for the great webinar, Ed.
However, I think the graph comparing the performance of your NAPS portfolios with the FTSE All Share index is misleading. You said that both graphs are price-only and ignore dividends, and that the NAPS graph ignores transaction costs and bid-offer spreads. You justified that by explaining the average dividend yield from NAPS of a bit more than 2% more than covers the average transaction costs of NAPS of about 2% per year. However, an investor could have bought and held a very low-cost index-tracking accumulation fund that follows the FTSE, in which case he would have received almost all of the FTSE's total return with dividends reinvested over the period of the graph, which would have performed much better than the FTSE index on a price-only basis. I think that would be a much fairer comparison with the performance of the NAPS.
After writing my previous post, I decided to look at the total return from the accumulation units of the one of the lowest-cost funds that tracks the FTSE All Share Index over the 8-year period from January 2015 (when the NAPS portfolios began) to the end of last year. As explained in my previous post, I believe this gives a much fairer comparison with the cumulative performance of the NAPS portfolios than comparing the NAPS against the index on a price-only basis.
The price of accumulation units of the Vanguard FTSE UK All Share Index Unit Trust on 2 Jan 2015 was £153.03, and their price on 30 Dec 2022 was £234.34, which means the total return from buying those units in January 2015 and holding them until the end of last year was +53%. (This fund has no entry or exit costs and an ongoing charge of just 0.06% per year, according to Vanguard's web site.) This cumulative total return, with dividends reinvested in the accumulation units of that fund, of +53% was significantly better than the approximately +20% return from the same index on a price-only basis over the same period, as shown on the graph in Ed's presentation. Of course, both were very well beaten by the excellent +175% return (approximately) from the NAPS portfolios over the same period, but I believe that the out-performance of NAPS over the FTSE All Share Index was not as great as shown on that graph.
pka - yes it's flattering only showing the price only charts, though I did qualify that verbally and mention the higher yield on the FTAS. I take the feedback and will aim to build a total return comparison in future.
In practice, there's a fair net dividend return for the NAPS too. I say the costs net off versus dividends as a conservative measure, but in a total return world the NAPS would get a boost too.
As an example, this year's NAPS have an average 0.35% Stamp Duty (as there are 6 AIM shares which are Stamp Duty free) and a 0.8% spread. The TTM Yield is 3.15% - so there's a 2% yield layover.
Trading commission brings that down marginally, of course, but depends on the size of the portfolio.
Considering the size of the portfolio and typical transaction charges might be worth following up further at some point. In theory it would be possible to estimate a portfolio size threshold at which stockopedia subscription combined with NAPs approach would have beaten a tracker investment historically, say in the UK for example.
Hi Ed, I think showing price-only charts is reasonable if they are over short time-scales such as a year. However, in a chart comparing NAPS performance with the FTSE All Share index over several years, the compounding effect of reinvesting dividends makes the total return charts diverge more and more away from the price-only charts. Furthermore price-only charts give a very pessimistic and misleading visual impression of the long-term benefits of investing in the stock market.
pka - I fully agree. I will improve this going forwards. Share insights, gain feedback (and criticism), improve !
Frankly - we need total return charts in the site too. Buying in Total Return data is monstrously expensive, but we do have all the dividends data, and it's plausible for us to calculate it ourselves. For a complete total return picture though you do need to include capital returns, share bonuses and all else - some of which is challenging - but even a simple dividend total return chart would be a big improvement for many purposes.
Total Return Momentum is also something I'm particularly interested in !
I don't want higher subscription fees. Seems some trying to build the perfect computer. Maybe AI will replace at some point.
For me the point that dividends (which I ignore in investing) offset the trading costs, a point which was made.
Trading costs are a consideration but losing x% on the investment makes it irrelevant. Stocko is there to reduce that but need to watch ie. trade.
If you want safety outsource to an ETF or fund manager - not a bad idea but boring.
I agree it was excellent. On the SCVR today a member commented that it was a one day seminar in one and half hours, and I agree.
Therefore my request is for a follow-up where Ed would just build a NAPS portfolio, nothing else (no general investment commentary or principles), from scratch, very slowly, with the chance for questions at each stage. I know that Ed's posts here in the NAPS blog cover what he does in detail but it would be great to watch it happening and be able to ask questions during the process. For example, the NAPS is meant to be a rules-based system for constructing and managing a portfolio but it seems to me that judgement enters into the process at some stages and I'd like to be able to ask about that at the appropriate times.
Michael C
"On the SCVR today a member commented that it was a one day seminar in one and half hours, and I agree."
I agree. What I want to do is take each principle and break it down into its own seminar session. The principles really should be a full day course, or perhaps a 6 hour online course.
I've set it as a goal to try to achieve this during the year.
There is a fair amount of judgement involved... but rather than the judgement being made on individual stock picks, it tends to level up to judgement on strategy (return drivers, portfolio construction, and ongoing portfolio management choices).
I think most people overweight their stock picks, but underweight their strategic choices.
I agree wholeheartedly with the praise Ed’s seminar drew from all sides and his technique I aim to try and put into practice . It does leave me, however, with a couple of problems. An existing portfolio would require a lot of modification, how would that be managed as we would be talking about a lot of buying and selling where 30+ stocks are involved. Another portfolio is made up entirely of 20 IT funds, do you have rules for such a portfolio?
How was the invite for this issued? Did I miss a post on here announcing it? Would have loved to attend but will now make do with the relay.
Hello - I sent an email for this, as well as notifying people via a little in-app pop-up chat. I'll likely do the same for the next one, so keep an eye out early next week!
Lawrence, I may be wrong but I can't remember seeing an email. Could you post on the chat board when you've sent it, just in case I'm (or others) are missing from the mailing list.
Thanks
Thanks - I was overwhelmed with the number of you who joined the session. It was fantastic to have such a good turnout in these tough markets. Great fun to prepare for and to do.
I'm promising to do some more in the next few weeks and months. So stay tuned.
Hi Lawrence,
I too thoroughly enjoyed last nights webinar, I found Ed excellent at presenting in a very natural way , that is a great talent.
One of the 'problems' i have with Stockopedia is that there is so much information on the site but it is not immediately obvious where it is or indeed if it there at all. Also, as I learnt last night, there is so much you can do with this data that I simply didnt realise. Every week I learn where some data is or what I can do with it. I obviously viewed the 'learn' guides etc but I am sure this doesnt cover everything.
I really enjoyed the session which ,for me ,provided reinforcement that the quality of support from Ed and Stockopedia is excellent .The session came at a particularly useful time for me as last years results ( awful) have caused me to reflect on how I might adjust my approach to investing.I would welcome more regular sessions ,as in addition to increased knowledge ,the sessions enhance the “investment club” element ie not alone during these challenging times !!Many thanks .
You're very welcome, and great to know. Thanks so much for coming!
Does Ed have time to reply to my comment?