The Anatomy of a Profit Warning

Stockopedia subscribers will be aware that last week we published a study of 245 profit warnings as "The Profit Warning Survival Guide" ... you can catch up on all the content in our quick read eBook, 30 minute Webinar and accompanying set of slides. In the next few weeks we'll be serialising some of the content as blogs on the site. For a background to the study please do read Ben's introduction here. This article summarises one of the key findings... the average price performance of a stock during a profit warning. The results are quite eye opening.
By combining the price histories before, during and after each profit warning in our study we built a model of the average price performance of a profit warning stock. Initially we looked at the week before a profit warning up to three months after, but the analysis was so startling that we had to push our timeframes out on both sides. It was only then that we could understand the full, complete picture.
While the majority of the drama happens on the day of the profit warning itself, the true story unfolds over a two year period. It starts 120 trading days (almost 6 months) before the event and continues to unfold over the next 360 trading days (almost 18 months) after the event. This creates a stunning visual picture we're calling The Anatomy of a Profit Warning.
Price Performance around a Profit Warning
Here’s a chart of the average profit warning decline in all its glory. If there’s one thing to remember from our entire research study, this may be it. We recommend burning this image into memory.
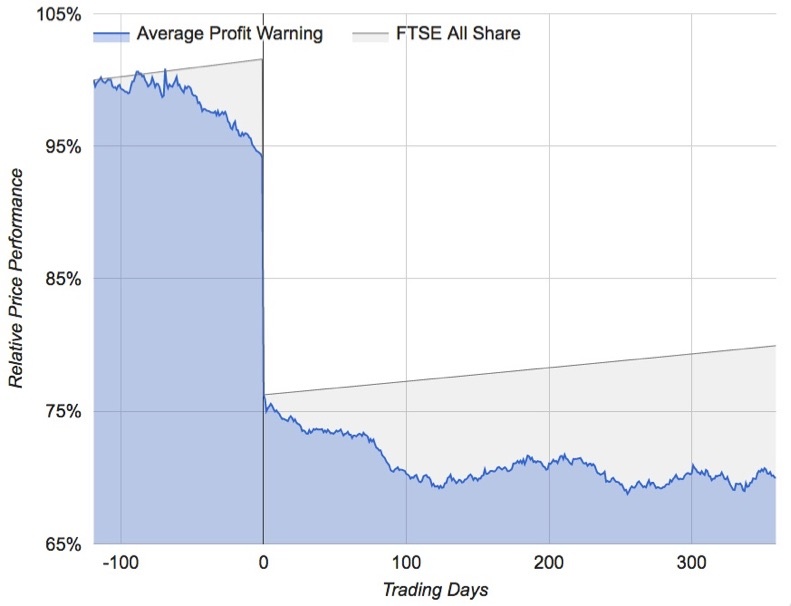
- The horizontal axis shows the number of trading days before and after the date of the profit warning (day 0).
- The vertical axis shows the price performance as a percentage of the starting value at a date 120 days before the profit warning.
- The blue line and area signifies the price performance of the average profit warning.
- The grey line denotes the return of the market average (FTSE All Share) over this timeframe expressed as a straight line. The grey area signifies the opportunity lost by holding onto a profit warning stock.
- NB - we used the first 135 profit warnings in our database in this chart study to ensure 18 months of ensuing price history.
Some Key Results
- On average, prices begin falling by 6% in the 6 months before the warning.
- The average price decline on the day of the profit warning was -19.2%.
- A noticeable further decline followed for two to three months after the warning, possibly coinciding with further earnings news.
- Over 12 months later there was, on average, no significant reversal in the price decline which continued to fall another 10% after the fall on the day.
Notes on the journey
Contrary to popular opinion, profit warnings appear to begin up to six months before the actual news announcement. There may be a couple of explanations for this phenomenon:
- The stock’s fundamentals and peers in its industry group may have already started declining before the announcement.
- Company insiders (directors or other individuals close to the company) may have leaked information to analysts or to other institutional investors.
Whatever the reasoning behind the accelerating decline, one of the key leading indicators of a profit warning is poor share price momentum, and accelerating declines in the fortnight before.
The real sucker punch of a profit warning happens on the day of the announcement - with more than 60% of the overall 2 year decline happening in a single day. Psychologically it’s a huge test not only for the shareholders who currently hold, but also the bargain hunters sniffing out a cheap new holding. In the ebook we studied the intraday performance on the day of the profit warning which showed little evidence of any over-reaction to the bad news but a sharp fall at the open and continuing declines. We'll go deeper into this result in a future article.
We found that the typical share also continues to decline for the next 18 months after the date of the profit warning. There may be several reasons for this. Some investors may be reluctant to sell due to behavioural factors such as an aversion to taking losses and mentally anchoring their sense of value on higher prices. Another reason is the slow reaction of city analysts and fund management groups to the news. The bad news takes time to be fully digested by the investment community. As new research reports are published, and long term forecasts are adjusted, a headwind is created for the share price. As Paul Scott pointed out during the webinar, large investors may only be able to unwind their positions gradually over time which puts continued downward pressure on share prices. A prolonged period of underperformance often ensues.
We'll finish this brief article with a quote from Robbie Burns, The Naked Trader:
It's crazy to buy into a company that has just produced a profit warning. And it's crazy to hold onto one of your shares that has just issued one. It's more likely that it will issue another one, and just because its share price has gone down doesn't mean it won't be going down some more ! Robbie Burns, The Naked Trader
Remember you can download "The Profit Warning Survival Guide" resources in our 1 hour read eBook, 30 minute Webinar and accompanying set of slides.
Disclaimer
This is not financial advice. Our content is intended to be used and must be used for information and education purposes only. Please read our disclaimer and terms and conditions to understand our obligations.
17 comments
Following on from the previous post, I have now actually gone on to read the book accompanying the post “Anatomy of a profit Warning” and found that many of the questions posted were in fact covered by Ed and team, so I now have to give myself a swift kick to the head and offer my sincere apologise to the Stockopedia team and appreciate how much work went into the report. So for those who have read the book, no point in continuing to read. For those like me who hadn’t/haven't read the book the results regarding the Quality rank were the opposite of my expectations, with high Quality rank stocks being the most likely candidates to suffer a profit warning
Other surprising findings were that the severity of price falls are also fairly consistent with high Stockrank shares on average falling only marginally less as the scatter plotter demonstrates.
Recovery on the other hand demonstrates that stocks with a Quality rank of 75 recover all of their losses within 12 months on average and the rise increases proportionately with the Quality rank. As a rough guesstimate it looks like the very highest Q rank shares rise roughly on average 15-20% after one year, again going by the scatter plotter.
Using all of this data as concluded by the book one should replace Q rank 50 with Q rank 75 when setting a demarcation line for profit warnings. However If I’m interpreting this data correctly buying every profit warning with Q rank >75 would actually be a very profitable strategy as the average gain over 12 months would be >20%. However it appears that the averages are distorted by a small number of outlier shares (3) that rise by over 75%. So high Q rank shares above 50 outperform the market as deciles by a considerable margin but also deliver the majority of profit warnings. Very interestingly the study also identified that the share price fall begins months before the profit warning, so can be linked with elements of the M rank, however high value ranks offer no protection against falls; in fact the study concluded the opposite during the test period. The research is also very dismissive of profit warnings coming in threes, as the majority are only subjected to 1
I would also echo skinner66's post in respect of updates especially regarding the development of the Q Rank V recovery beyond the 1 year period.
I was expecting to take some flak for my previous post in this thread, as we all know the post makes compelling reading and warns against going near distressed shares. Due to the findings we also know that profit warnings have a habit of being persistent and damaging to one’s wealth and probably health. However, from the example in my previous post they also provide some compelling opportunities.
It would be great if one could revisit this analysis and carry out some more objective research to try and identify what percentage of profit warnings are due to the share price falling as a result of say systemic, cyclical or maybe some other reasons. Is it possible that the majority of profit warnings are from shares in systemic decline and therefore recovery is highly unlikely in any time frame. It’s just a case of managed decline or reinvention. Think of how many pubs and retailers you know of that have closed over the last decade.
Maybe one could use the Q rank as some sort of barometer when looking at profit warnings.
Taking historical Stockopedia research into account, it would be fair to say that a clear demarcation line can be set up at roughly Q rank 50.
Shares with a Q rank <50 as deciles underperform the index and
Shares with a Q rank >50 as deciles outperforming the index
Could this research be revaluated and the results split into 2 categories?
Profit warnings by shares with a Q rank <50 and
Profit warnings by shares with a Q rank >50
It would be interesting to see if such a study would have similar conclusions or identify those areas that may offer opportunities for long term investors. So with a Q rank >50 and failing share price enhancing the V rank, we should arrive at one of the winning styles (contrarian) as classified by Stockopedia.
Also I’m sure we’ve all heard of this saying before “buy quality on the cheap”.
Below is a simple screen with only two data fields
It throws up a number of recent profit warnings and other interesting names. Here’s the top 30
There’s a lot of scope for these shares to perform as they could evolve through the following Stockrank Styles, contrarian to, Superstock to, Highflyer to maybe Momentum Trap before falling back down to earth
It’s a commonly held thought that profit warnings come in threes, hence the conclusion that it takes a long time for recovery to take place. Also I’ve heard of trading/investing strategies built around identifying 3 gaps down (profit warnings) on a share s price chart and trading the next break in trend. It’s fair to say that profit warnings should be left well alone but I don’t think we should conclude that “we should always do it this way” or “we will never do it that way”.
Does anyone remember this
https://www.telegraph.co.uk/ne...
BP (LON:BP.) 's share price recorded it's worst monthly decline ever shortly afterwards
It also happened to mark the bottom and the rest is history as they say
any updates on this, being now nearly 2 years old. over reaction on profit warnings i have seen this year on some shares making for bargain hunters if brave enough, depending on the damage of profit warning..
If the market tends to continue a price correction after a profit warning
Does it continue a price correction after a 'ahead of expectations' announcement?
Hi Andrew yes I think there is plenty of evidence that the price does continue to go up well after an unexpected positive profit announcement, there are some screens on here that do follow that. The Earnings Surprise Screen is one that has performed quite well.
Andrew - you said: "If you are lucky you might be up 60%, it drops 25% and you walk away with 35% profit".
Not so, e.g. if you bought a stock at 100p and it went up 60% to 160p, then dropped 25% - it would be back to 120p and your profit would be 20p or 20%.
Yes, you are correct. Apologies, my original post was typed quickly. I was trying to say hopefully you will have enough profit built up to cushion any profit warning blow. Easier said than done!
Sorry, that is just wrong however you look at it.
If the stock drops 25%, then you are up 20% - BUY at £1, up 60% to £1.60, then a 25% drop is 40p taking the price to £1.20 and you are 20% up.
If your profit figure of 60% drops by 25% then you are up 45% - BUY at £1, up 60% to £1.60, then fall 25% of 60p = 15p, so price now £1.45 and 45% profit.
That said, I have never heard anyone calculate by the second method.
OMH
OK, thanks! That's very clear. I was thinking of my profit figure only, sorry, not at all clear in my original post! have caused confusion. I should have just left off that one sentence in my original post. The point I was trying to make is that when a profit warning strikes then hopefully you will be lucky enough to have already built up a cushion in profit so you can take the hit, sell up and still walk away with a profit.
You may still be in profit but overall you still have lost money. That's why I think you need to watch the ones in profit just as much as the losers, people seem obsessed with shares losing money, end of the day it's what your portfolio is worth that matters.
As someone who has built quantitative investing systems for many, many years (with some of the biggest global money managers), I spot a potential problem with this study: look ahead bias. You would not have known at the time that a stock would warn on profits. To test the hypothesis correctly, you should examine the performance of all stocks with deteriorating price action, not just the ones that later reported the warning.
Nick de Peyster
http://undervaluedstocks.info/
"up 60%, it drops 25% and you walk away with 35% profit." - actually, that would be a 20% profit.
...If my profit is showing as 60% and if this figure drops 25% then my profit is now 35%.
Excellent study. Great work Stockopedia team - a huge amount of data to input and review. My personal strategy is to sell straightaway on a profit warning and accept the hit. If you are lucky you might be up 60%, it drops 25% and you walk away with 35% profit.
So this could make a great shorting strategy....? If average is a 10% drop day after profit warning that's a great return!
Sometimes,companies produce bad results without any warnong.Do the same lessons apply ?