The case for Overlapping Value - An alternative approach to valuation

Back in 1955 Ben Graham, known as the ‘father of value investing,’ was summoned to Washington DC, into the corridors of the Capitol Building. The Senate Banking Committee wanted to understand how the stock market worked. Politicians managed to get their head around the idea that there was a difference between a stock’s price and a stock’s ‘intrinsic value’ - i.e. it’s ‘true’ value. But politicians couldn’t quite understand how or why the price eventually came into line with the intrinsic value. Senators grilled Ben Graham, who responded by putting on his politician’s hat and refusing to give a direct answer…
Senator: When you find a special situation and you decide, just for illustration, that you can buy for 10 and it is worth 30, and you take a position, and then you cannot realise it until a lot of other people decide it is worth 30, how is that process brought about – by advertising or what happens?
Graham: That is one of the mysteries of our business, and it is a mystery to me as well as to everybody else. We know from experience that eventually the market catches up with value. It realises it one way or another.
Ben Graham was revealing less than he knew…
Markets as voting machines
In his tome, Security Analysis, Graham laid out the various factors that culminate in the market price…
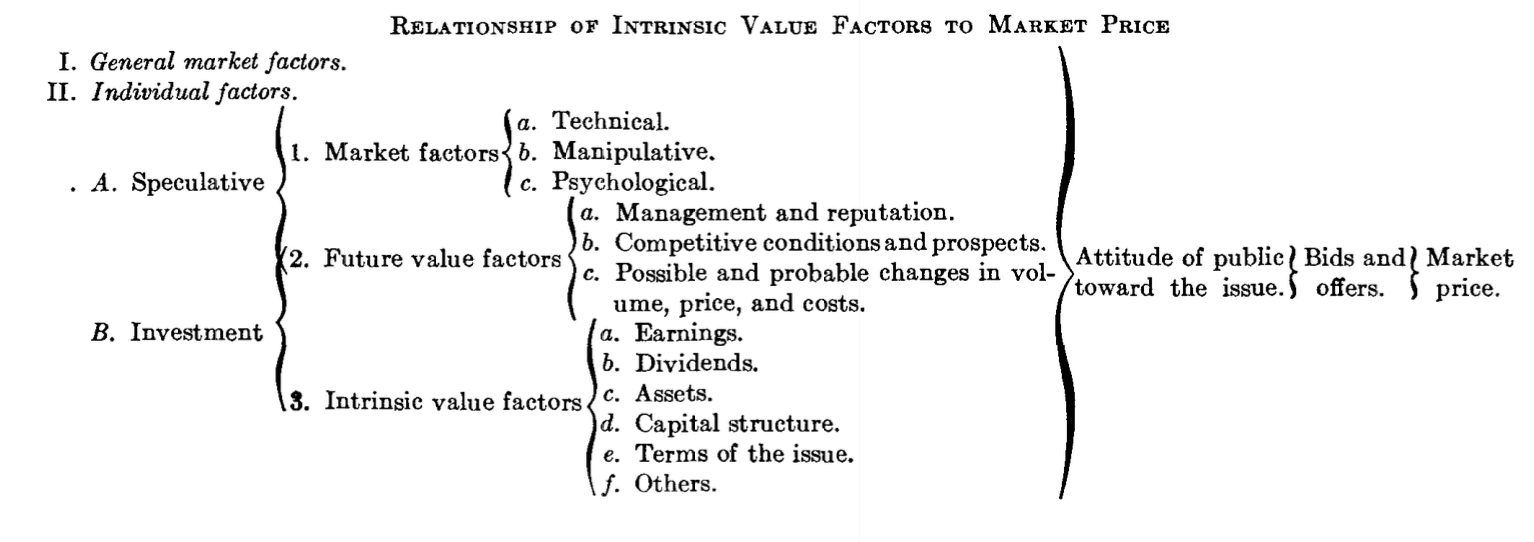
Fundamental factors, like earnings, dividends and assets, all have a role to play. However, their impact is mediated by an intermediary factor: public opinion. At the end of the day, share prices are not driven by financial data per se, but by people's perception and awareness of that data.
Ben Graham put it like this:
It will be evident from the chart that the influence of what we call analytical factors over the market price is both partial and indirect: partial, because it frequently competes with purely speculative factors which influence the price in the opposite direction; and indirect, because it acts through the intermediary of people's sentiments and decisions.
Public opinion is harder to understand than cold hard data. Things would be straight forward if we all acted in accordance with the rational economic model. According to that model, individuals make decisions by evaluating options and selecting the best one. However, if we have learned anything over the last few centuries, it is that we humans, being ‘only human’, are not always rational. The Russian novelist, Fyodor Dostoevsky, put it in quite dramatic terms:
And why are you so firmly, so triumphantly, convinced that only the normal and the positive — in other words, only what is conducive to welfare — is for the advantage of man? To care only for well-being seems to me positively ill-bred. Whether it's good or bad, it is sometimes very pleasant, too, to smash things…
Readers may disagree with Dostoevsky’s sentiment, but we can not deny that market ‘irrationality’ presents a challenge. We may have an investment thesis, but our investments will only pay off if the market agrees with us. And if ‘irrational’ investors disagree with us, well… we just have to wait it out, right? No, not really. Instead of hoping the world changes to meet our expectations, it is sometimes more realistic to accept the world as it is and change our behaviour accordingly.
Practically, this means we may need to adjust our approach based on market opinion and align with the preferences of other investors. Let’s explore how to do this…
The case for backing multiple candidates
Once again, Ben Graham offered valuable insights. He said that ‘the market is a voting machine, whereon countless individuals register choices which are the product partly of reason and partly of emotion.’ If the market is a voting machine, then investors are in the privileged position of being able to back multiple candidates at once. Diversifying across multiple stocks is part of the solution, but ‘candidates’ can also mean the different stock-picking criteria. Investors can analyse market sentiment and select stocks which are likely to attract a variety of investors, each with different strategies.
Three academics—Blanco, de Jesus, and Remesal—explored this concept in the context of momentum investing. Their research found that stocks exhibiting strong momentum over both 6-month and 12-month periods—‘overlapping’ momentum stocks—were likely to perform better than those with strong momentum in only one of these time frames. This is because ‘different momentum investors use different periods to evaluate past stock performance.’ Some analyse price performance over a 6-month lookback window, while others use a 12-month lookback. Stocks with strong momentum over both timeframes are likely to appeal to a broader set of investors.
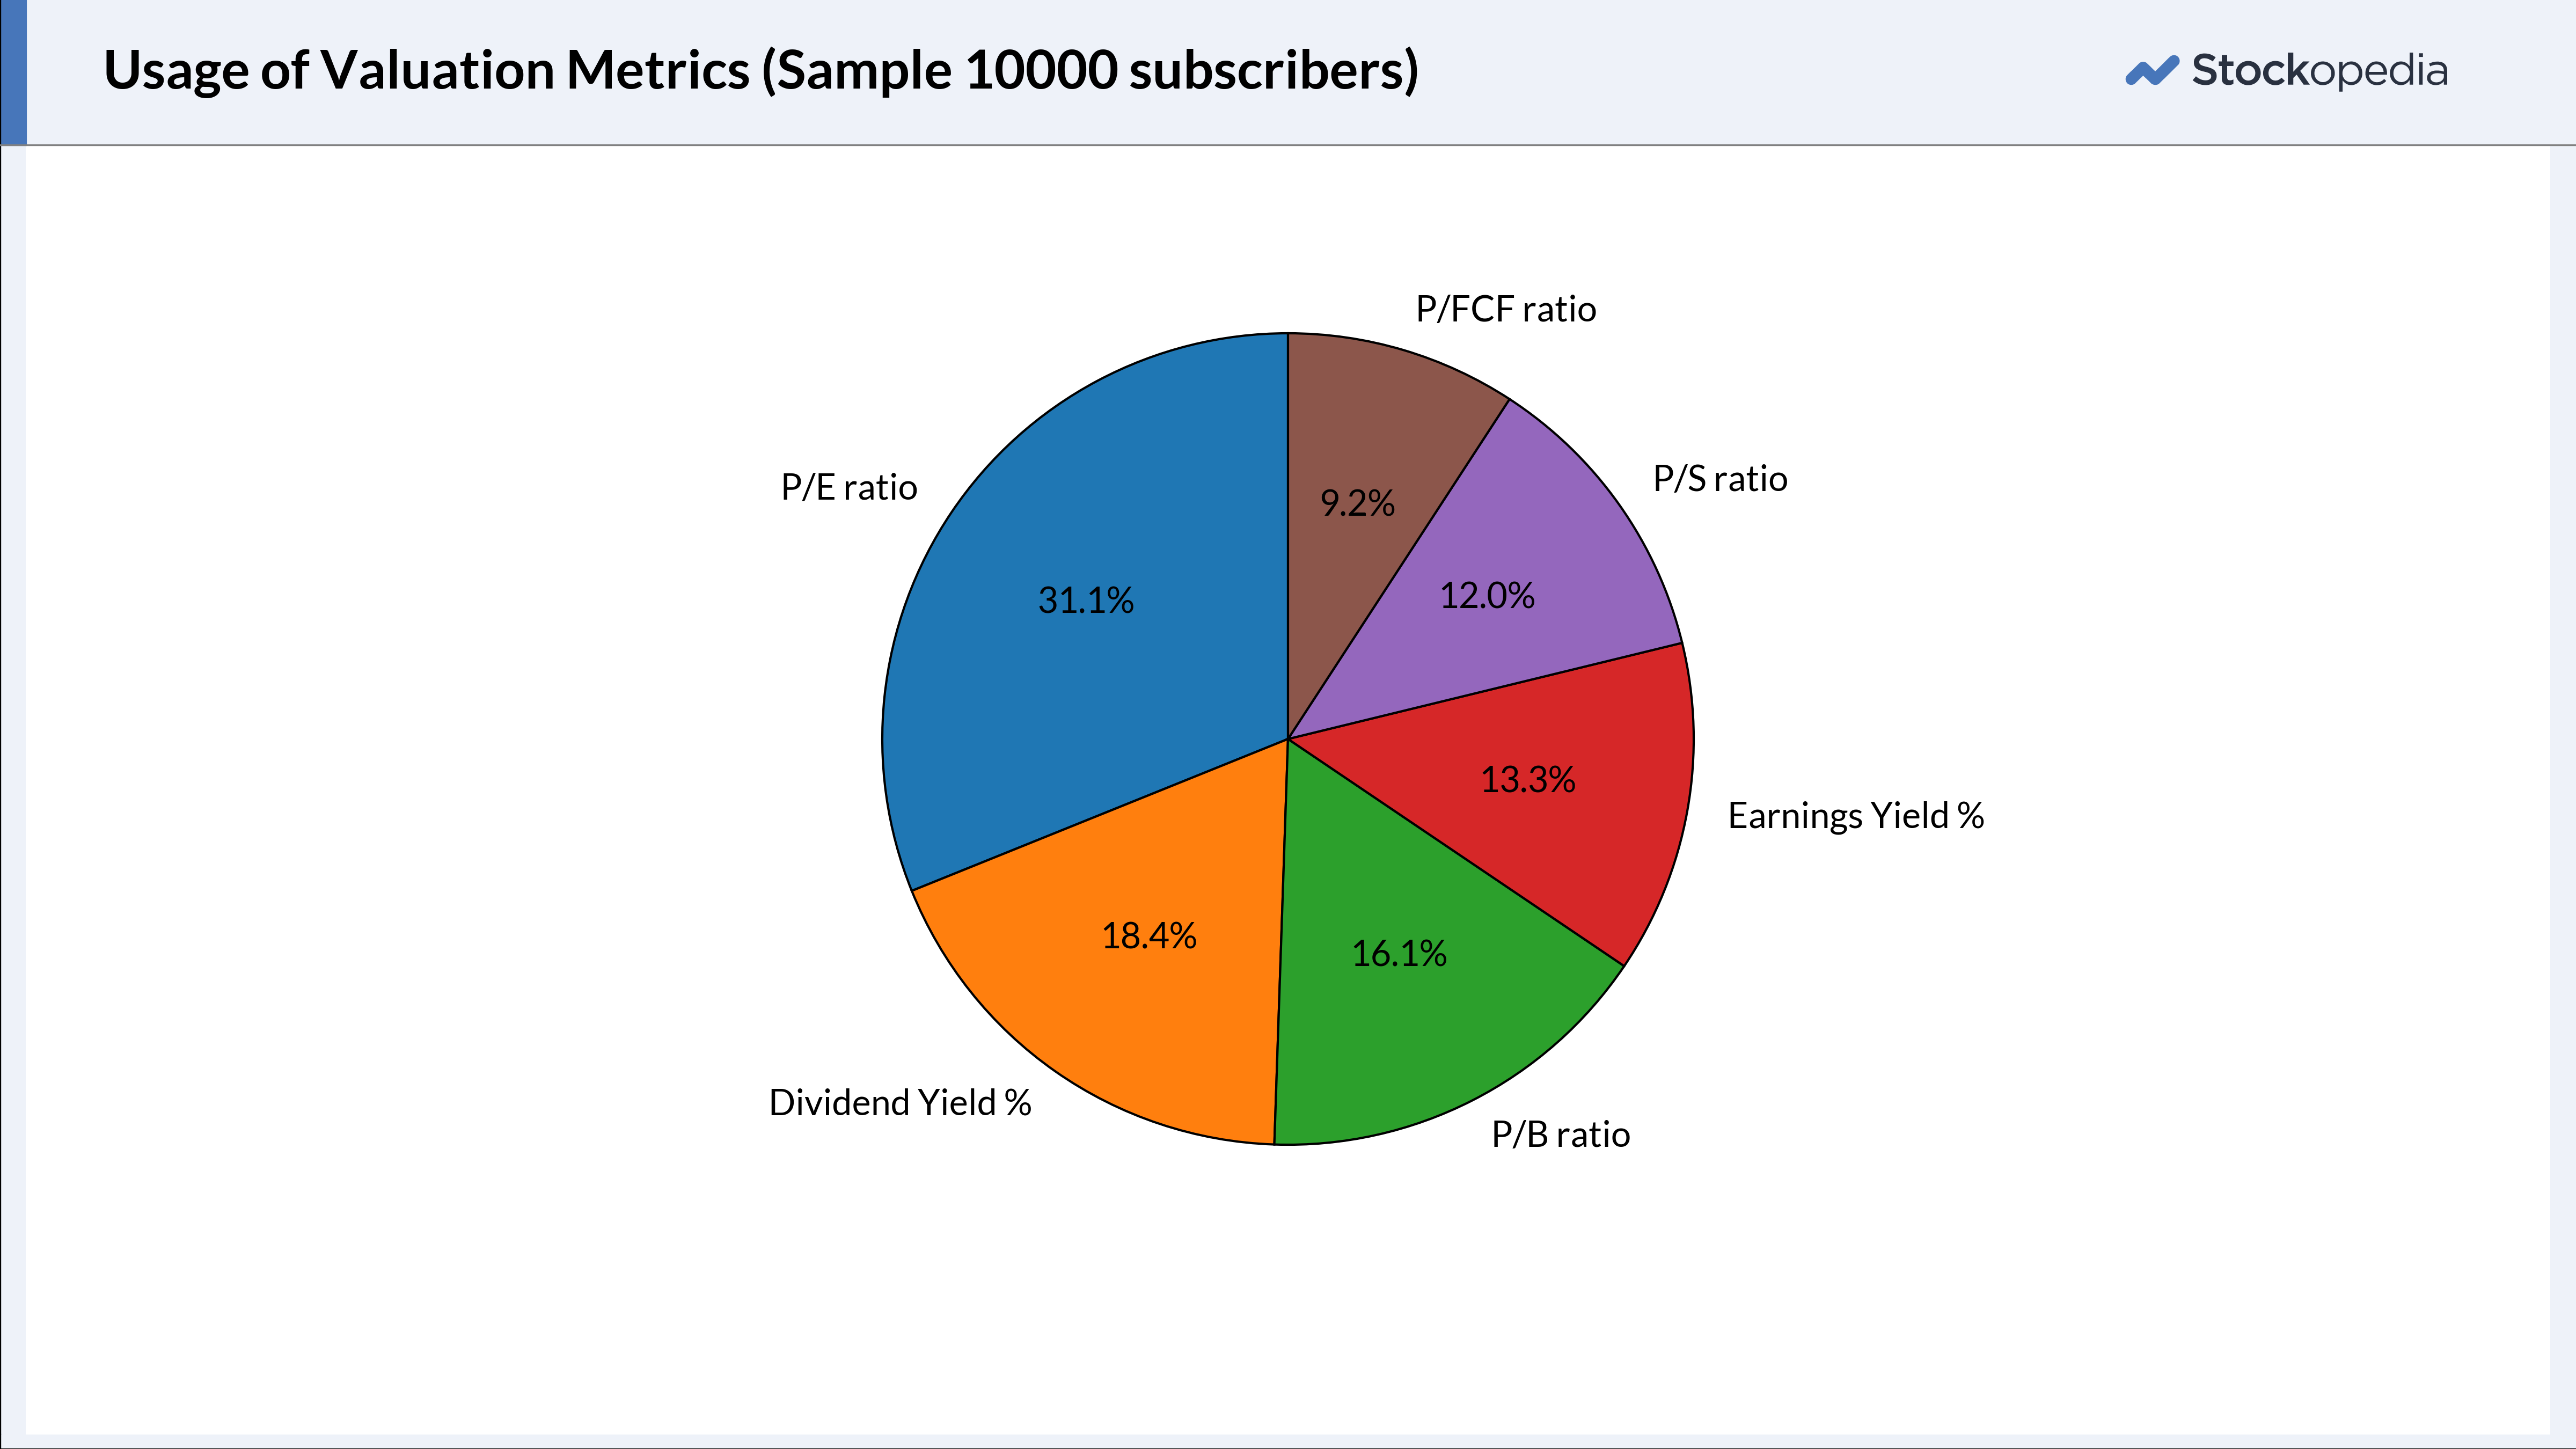
‘Overlapping value’ operates in a similar way to ‘overlapping’ momentum. Value investors are a fragmented group. They can be categorised based on the valuation ratios they use. The interesting thing is that investors who use one ratio are often unlikely to use others. In fact, many investors have a preferred ratio—sometimes two or three ratios—while other metrics are left out of the quiver.
The chart below shows that the P/E ratio is the clear favourite, followed by Yield. However, those two ratios only account for half of the total usage. The remaining usage is distributed fairly evenly across other ratios. The problem is that when an investor uses a particular ratio, other investors may have a different definition of value, as they are measuring it in a different way. One investors’ bargain becomes another investors’ value trap. The key is to identify an investment opportunity that is likely to be perceived as a bargain by a wide range of investors…
Towards Universal Value
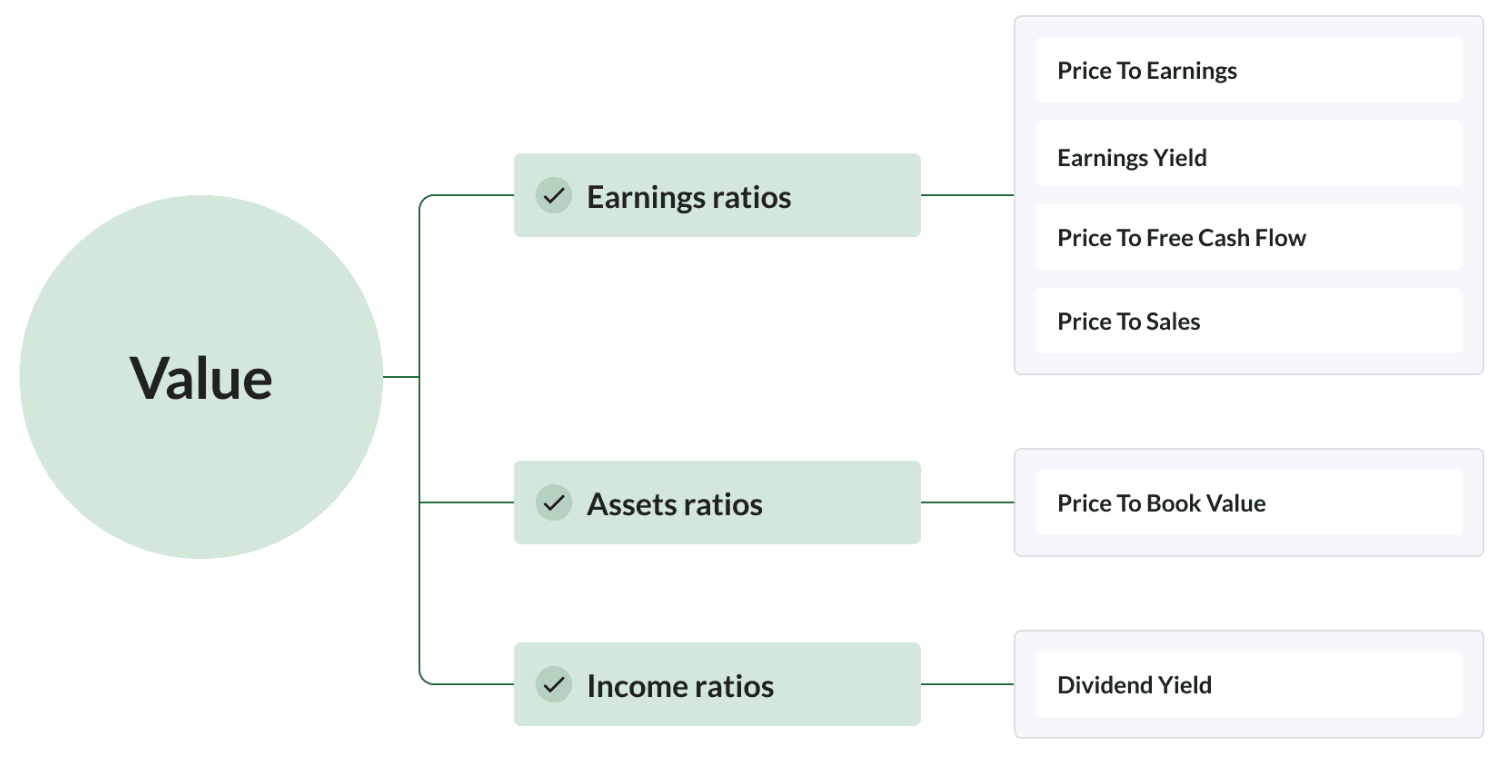
Blanco, de Jesus, and Remesal demonstrated that momentum strategies are more likely to outperform when they target companies with strong price momentum across multiple timeframes. We can apply a similar approach to ‘overlapping value’ by identifying companies which are undervalued across multiple metrics.
Our method involves several steps.
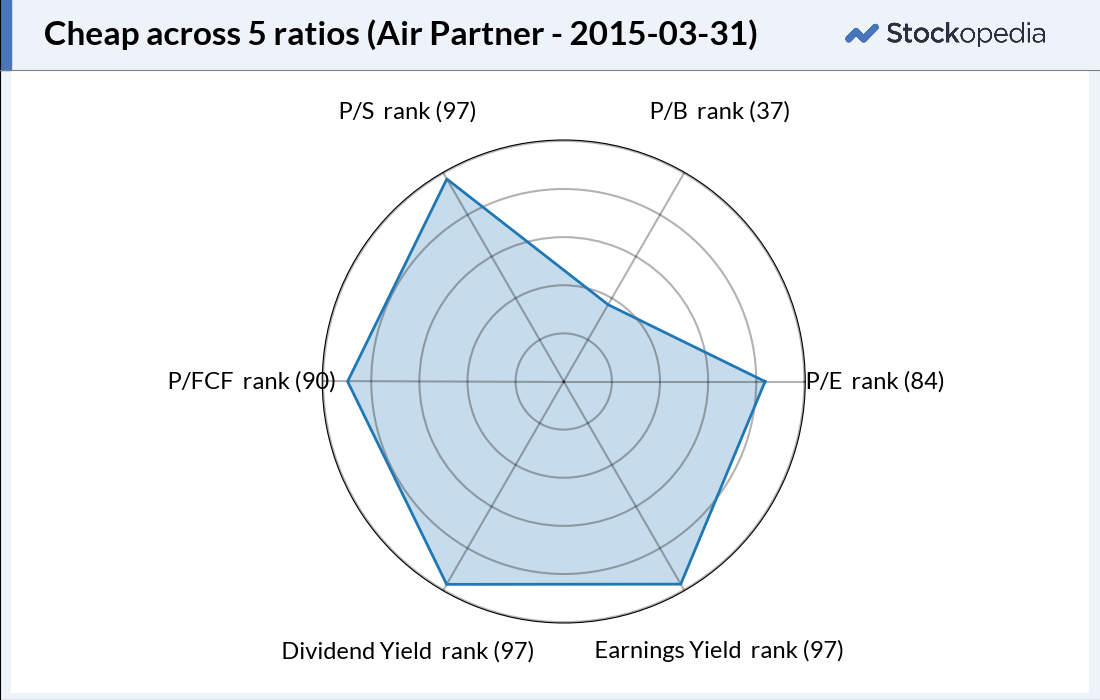
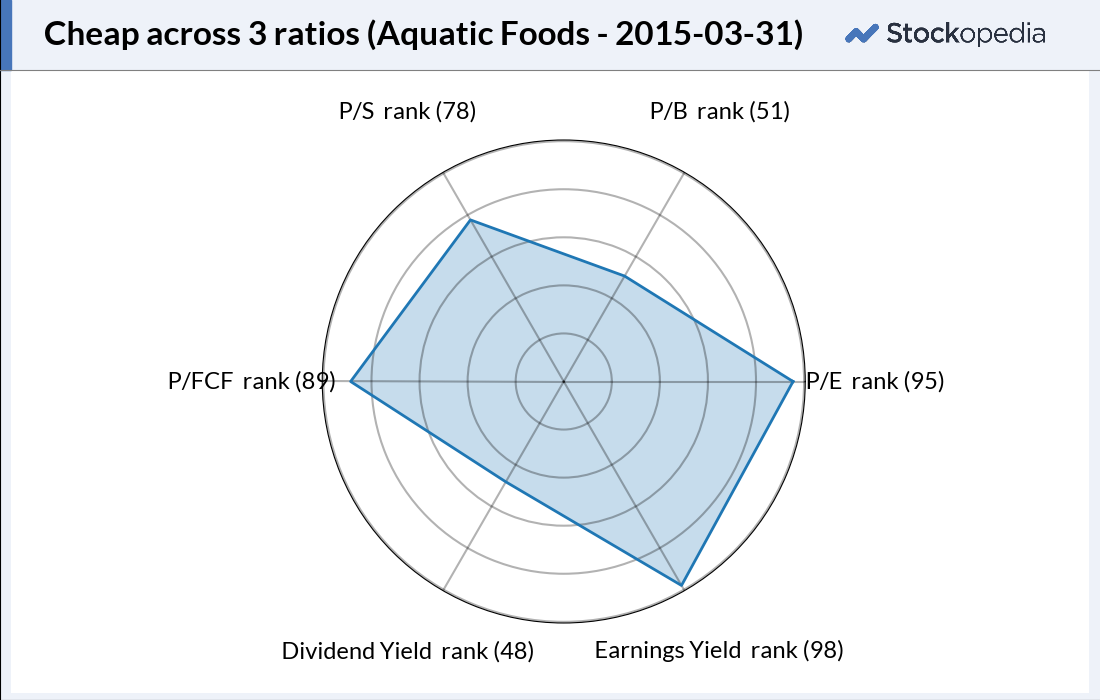
- First, stocks are given six sub-component ranks — i.e. a P/E rank, an Earnings Yield rank, and so on, for all six sub-components shown below.
- Then, for each stock, we count the sub-component ranks that are above 80 (i.e. high).
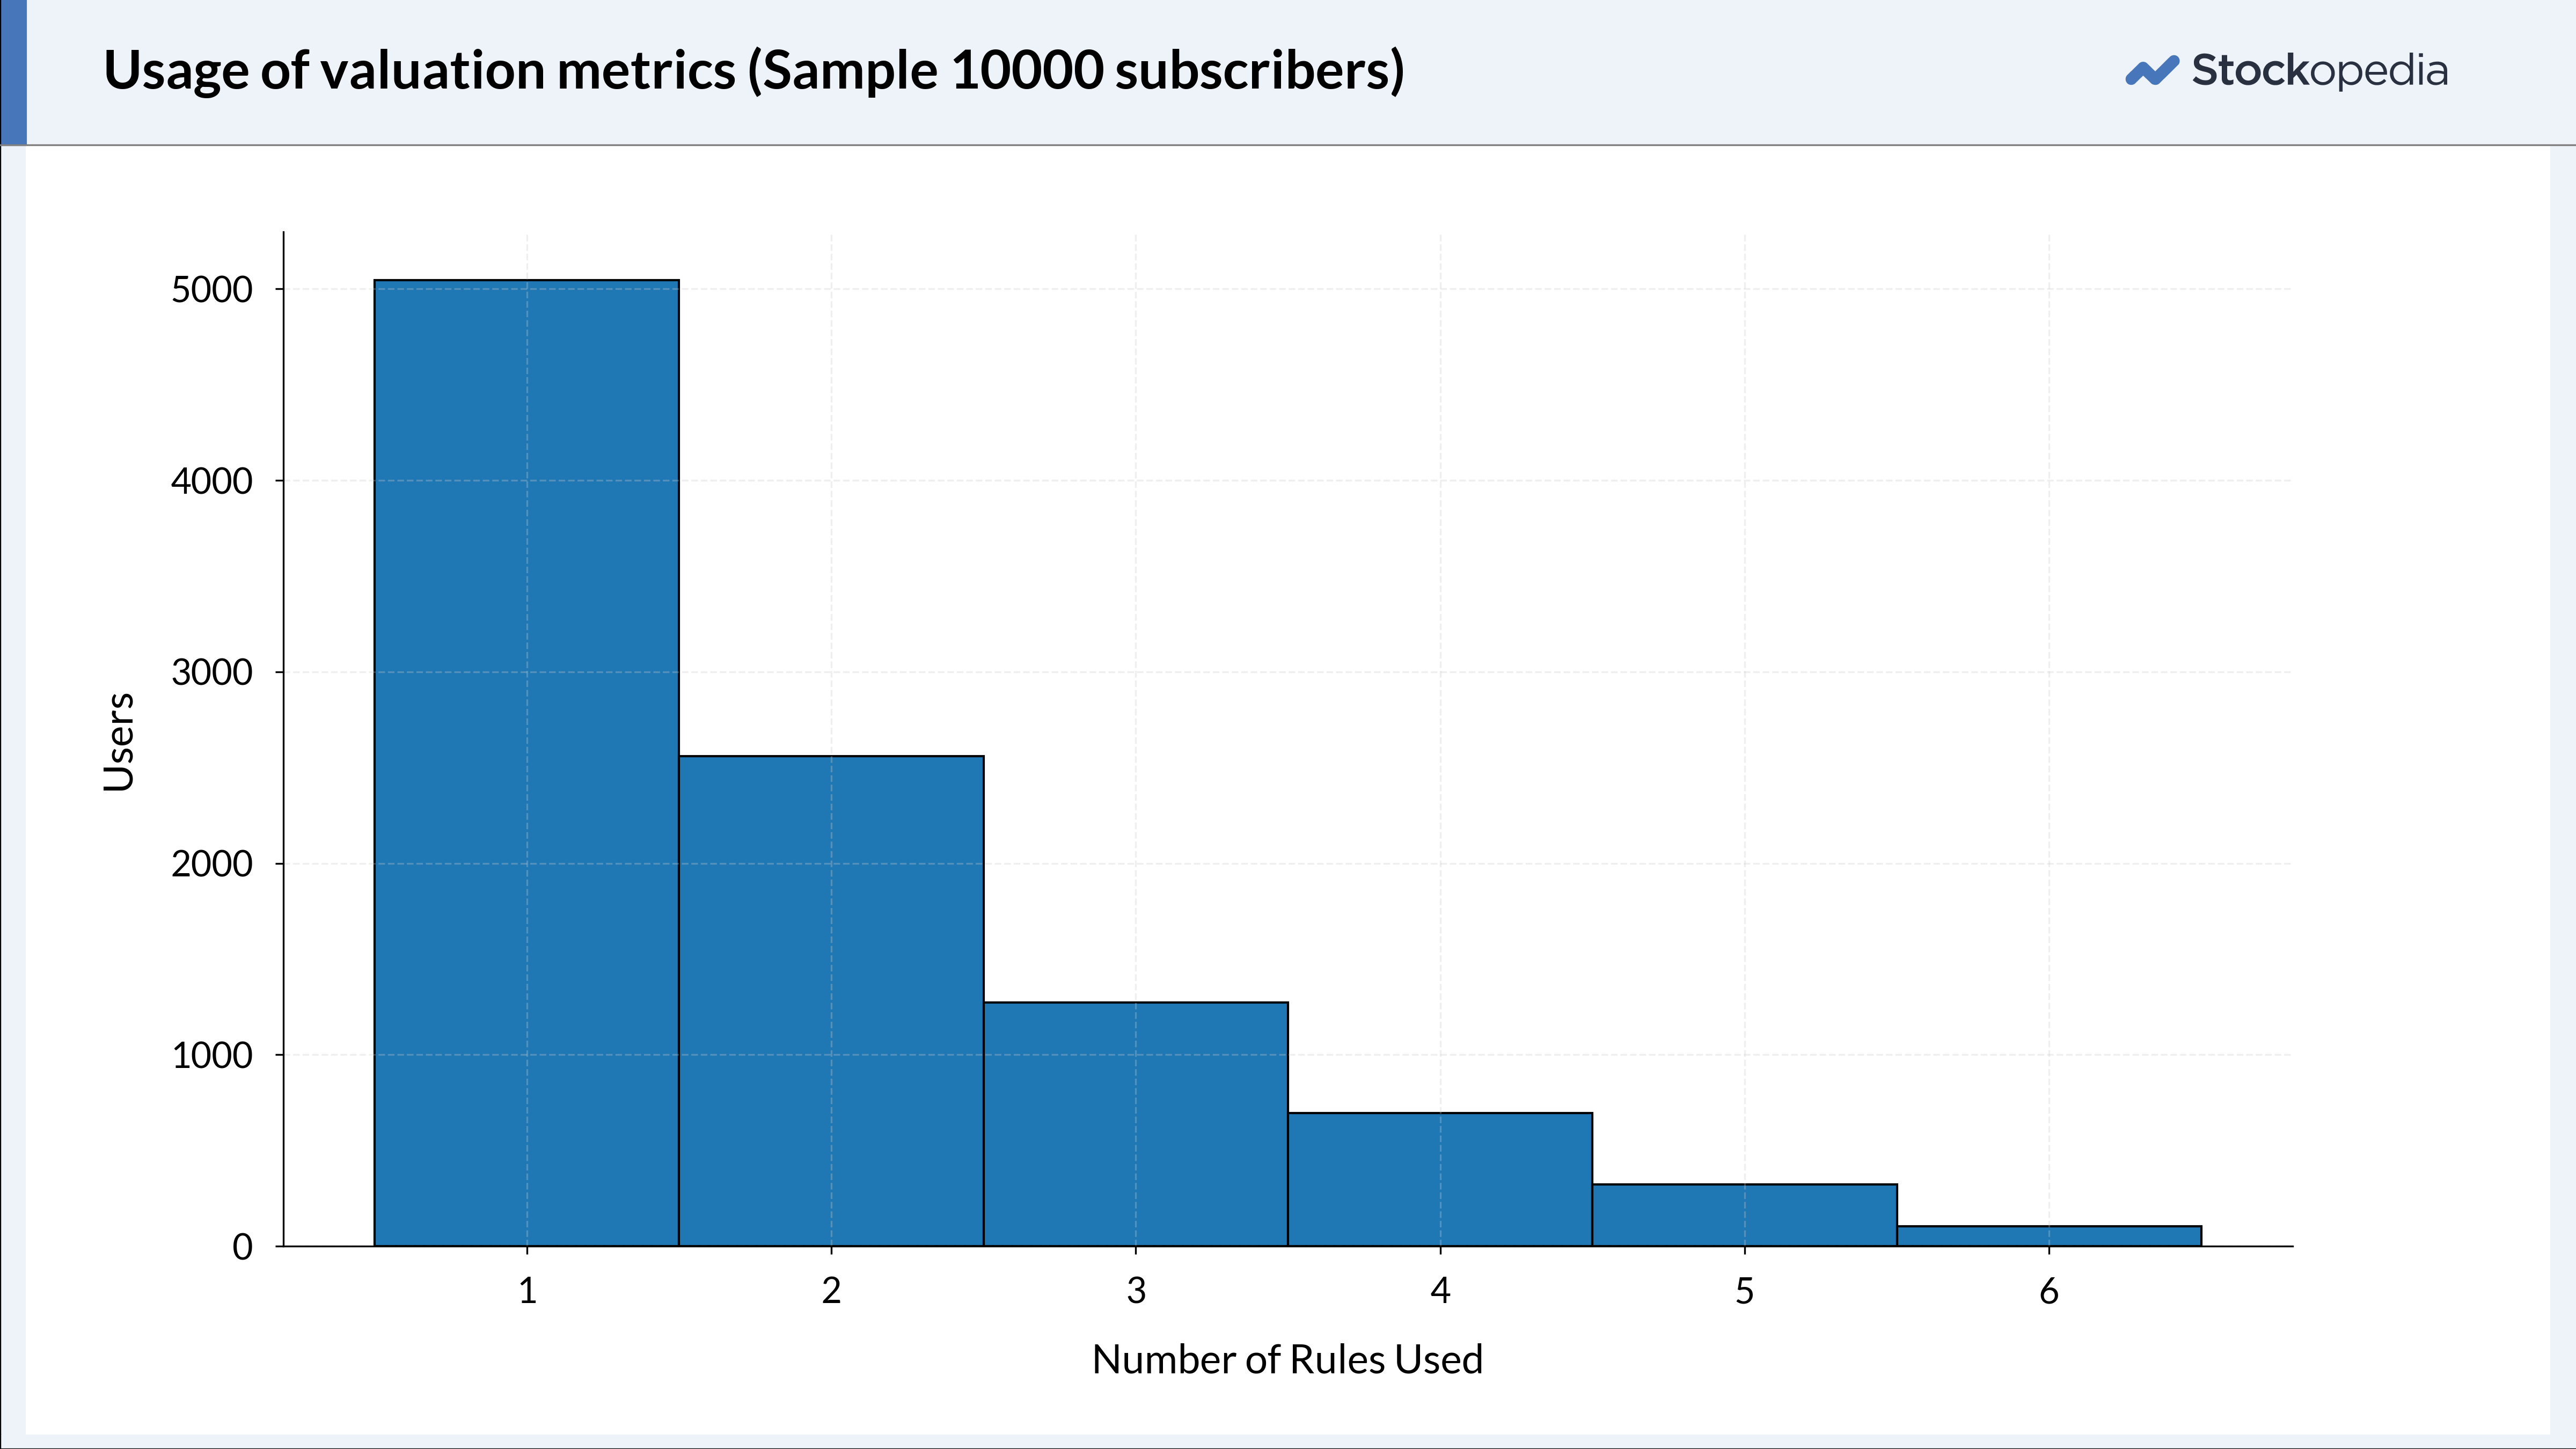
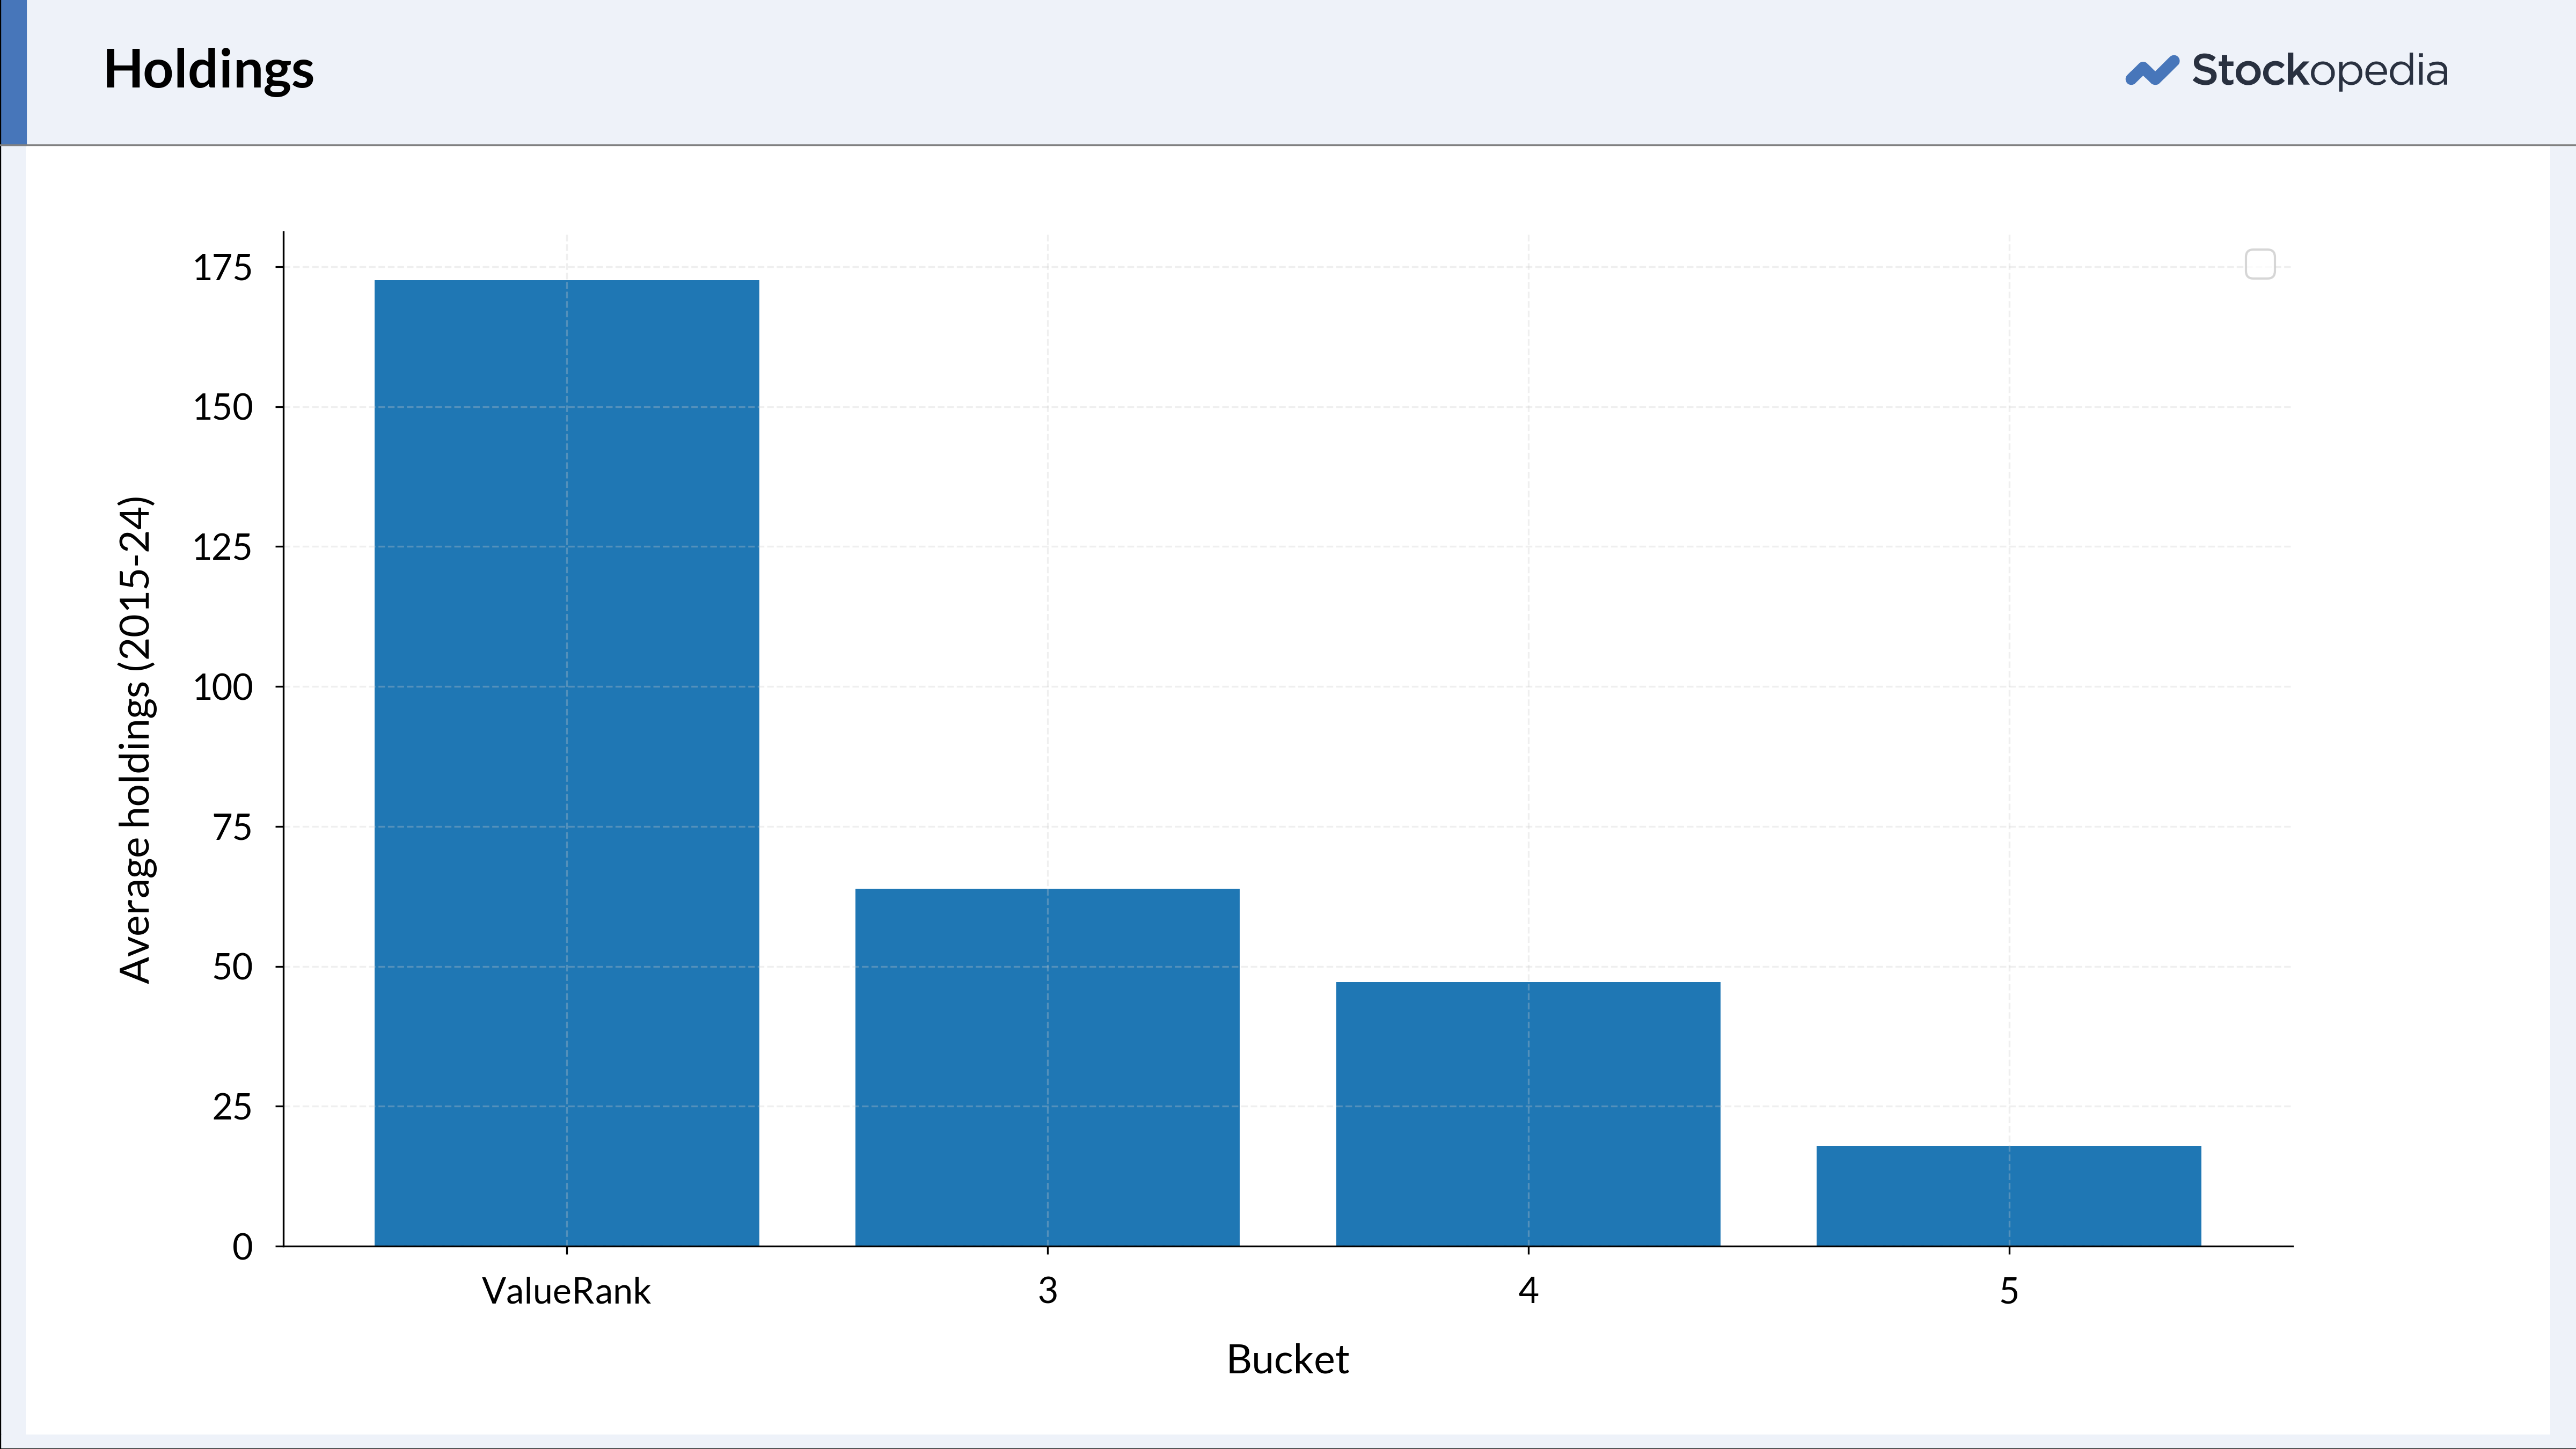
Stocks are grouped into portfolios based on how many component-ranks exceed 80. This creates three portfolios: one for stocks ranking highly in 3 value metrics, another for those excelling in 4, and a third for those scoring well in 5 (see below). Very few stocks perform well across all six components, so it is impractical to track a portfolio of these stocks. Furthermore, our research benchmarks against high ValueRank stocks (see below). Only a few high ValueRank companies scored well in only 1 or 2 component ratios, so again, we dropped these portfolios from the experiment.
Overlapping Value Performance
The market would, in theory, be ‘aware’ of a bargain opportunity if a company is cheap based on multiple definitions of value — i.e., using different valuation metrics. These bargains would be snapped up quickly, because the opportunity is more obvious to a wider demographic of investors. If we follow this reasoning, stocks that are undervalued across a wider range of metrics would outperform stocks that are only undervalued based on a more limited set of ratios.
We evaluated this hypothesis by simulating the performance of two groups of companies:
- High ValueRank + High Sub-Component Ranks Portfolio: This included companies with both a high overall ValueRank and high rankings in their sub-components.
- ValueRank Portfolio: This included companies with a ValueRank above 90, without considering their sub-component ranks.
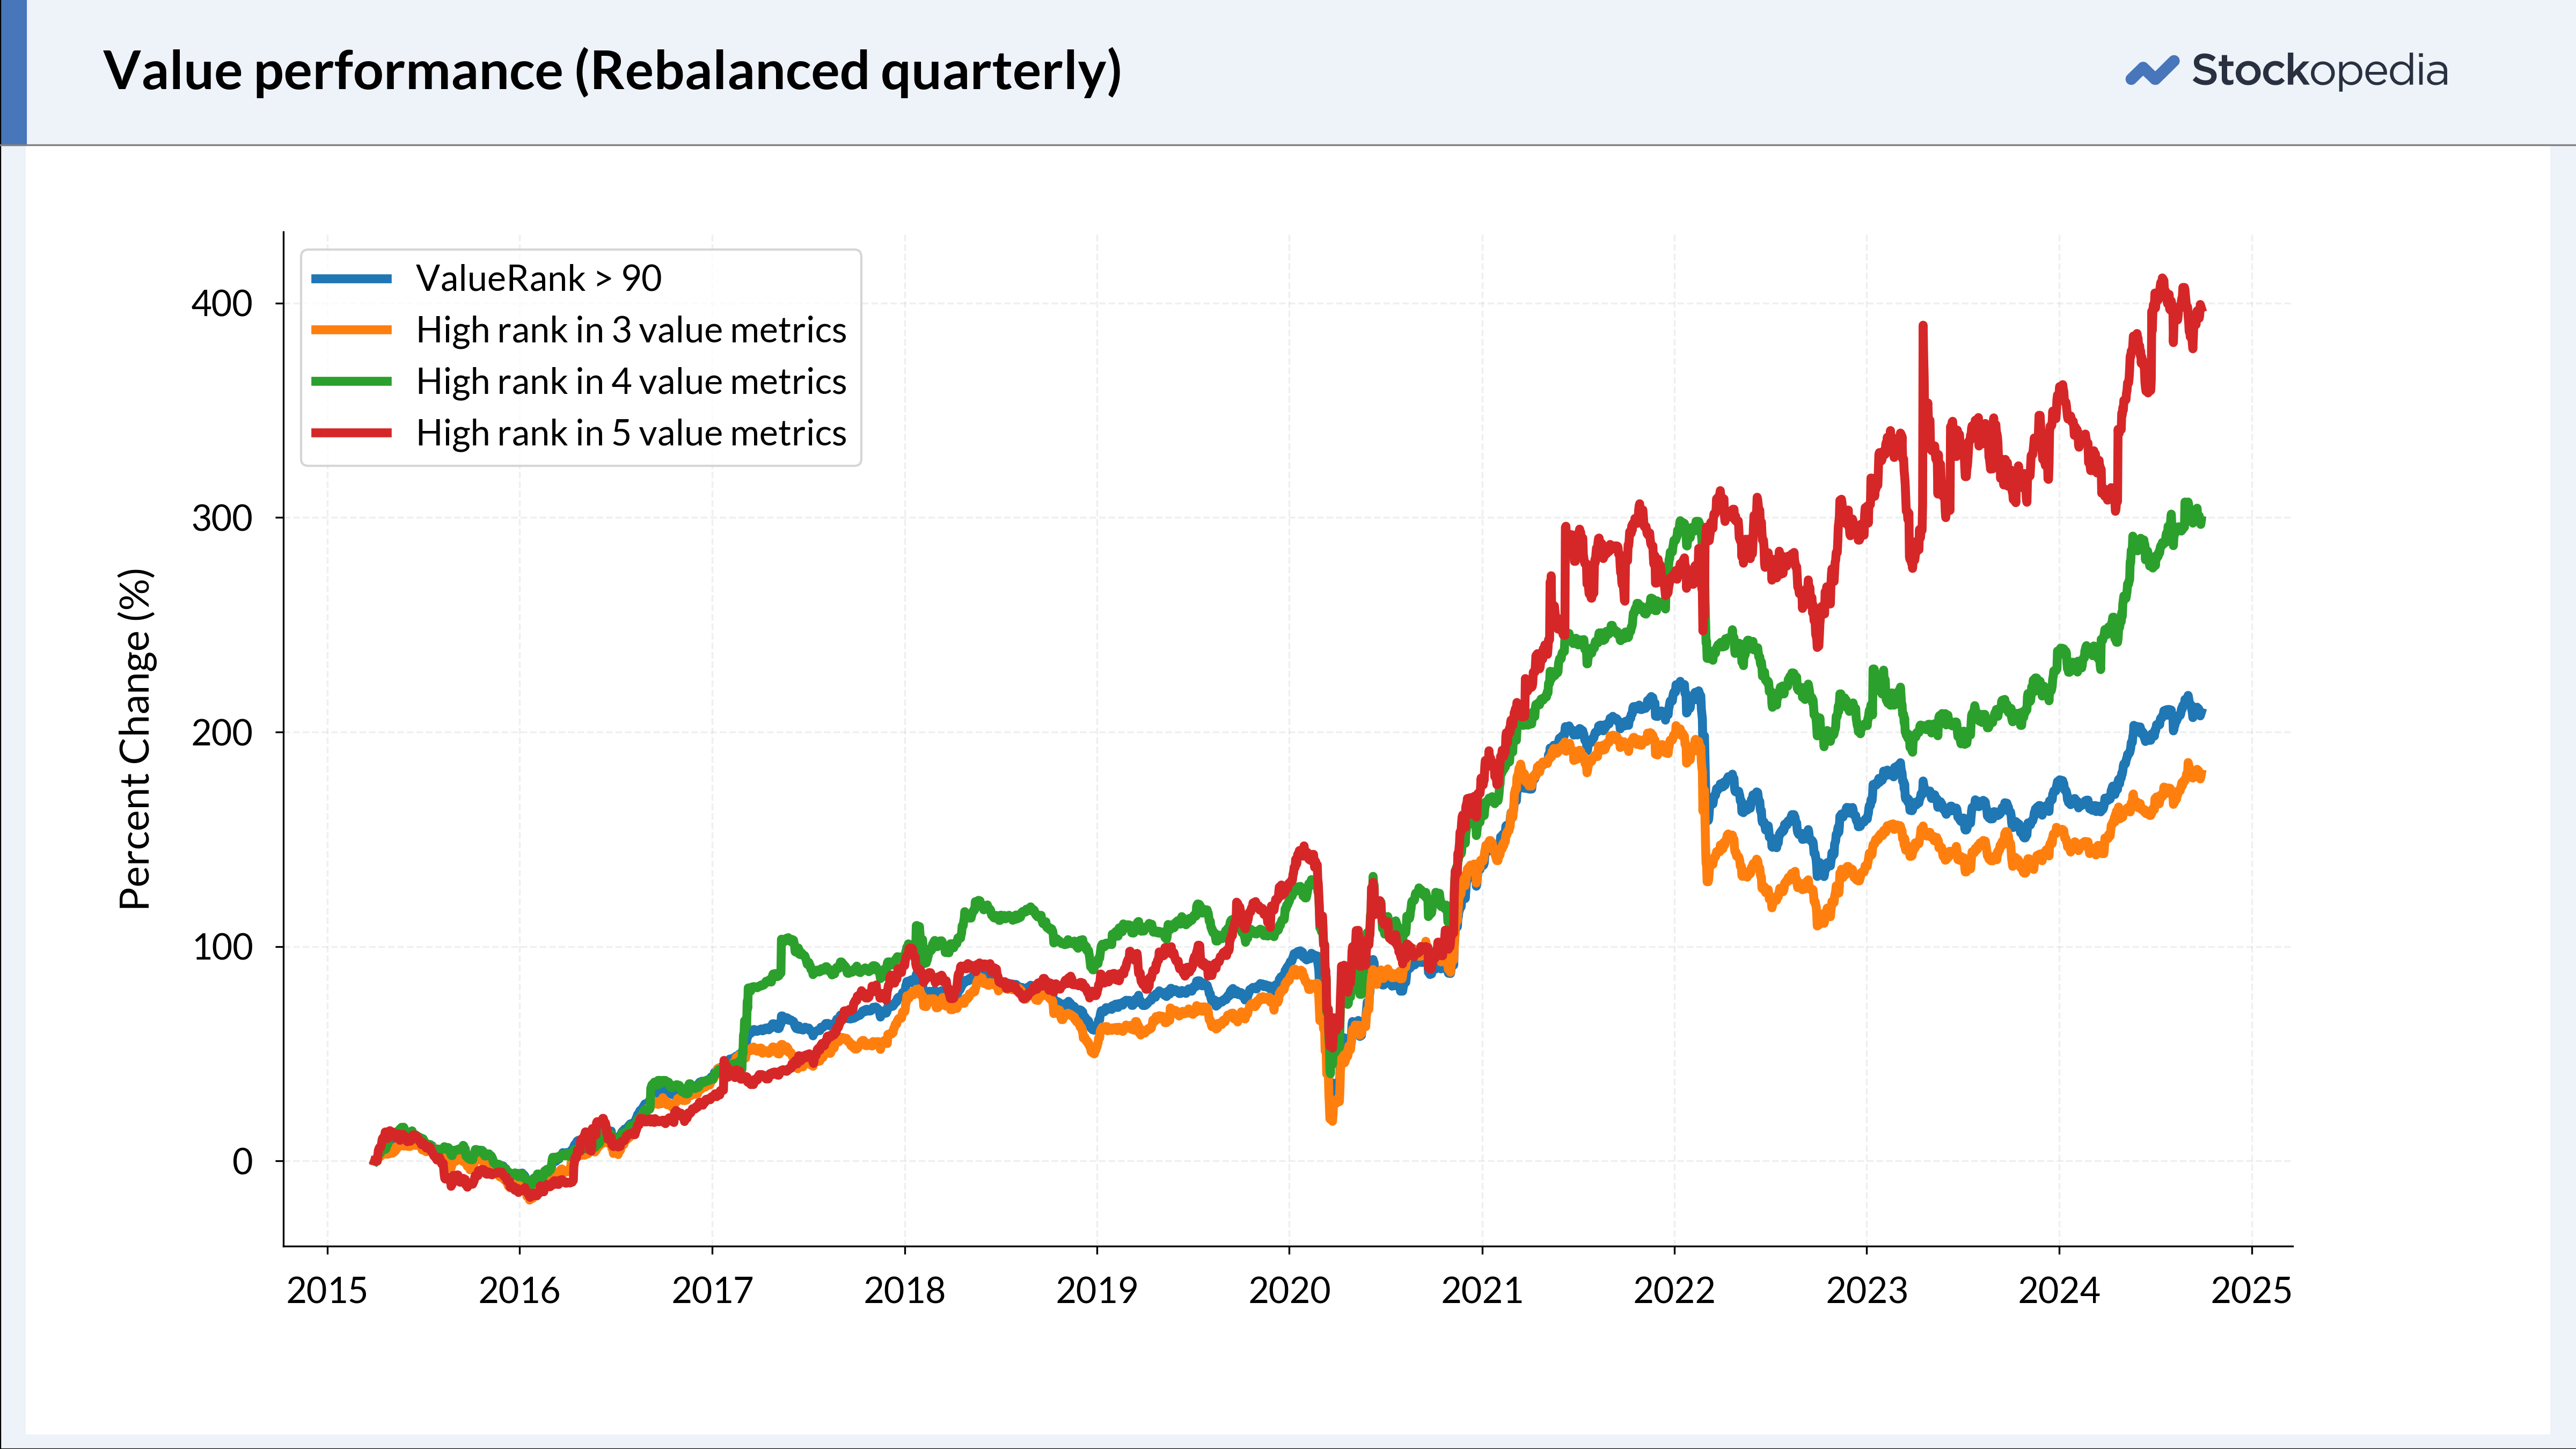
Over the long run, stocks that outperformed were those undervalued based on a broader range of metrics. This trend becomes clear when comparing the performance of stocks with 4 high component ranks to those with only 3. Additionally, companies with 5 high component ranks showed significantly better performance, especially since 2021–22.
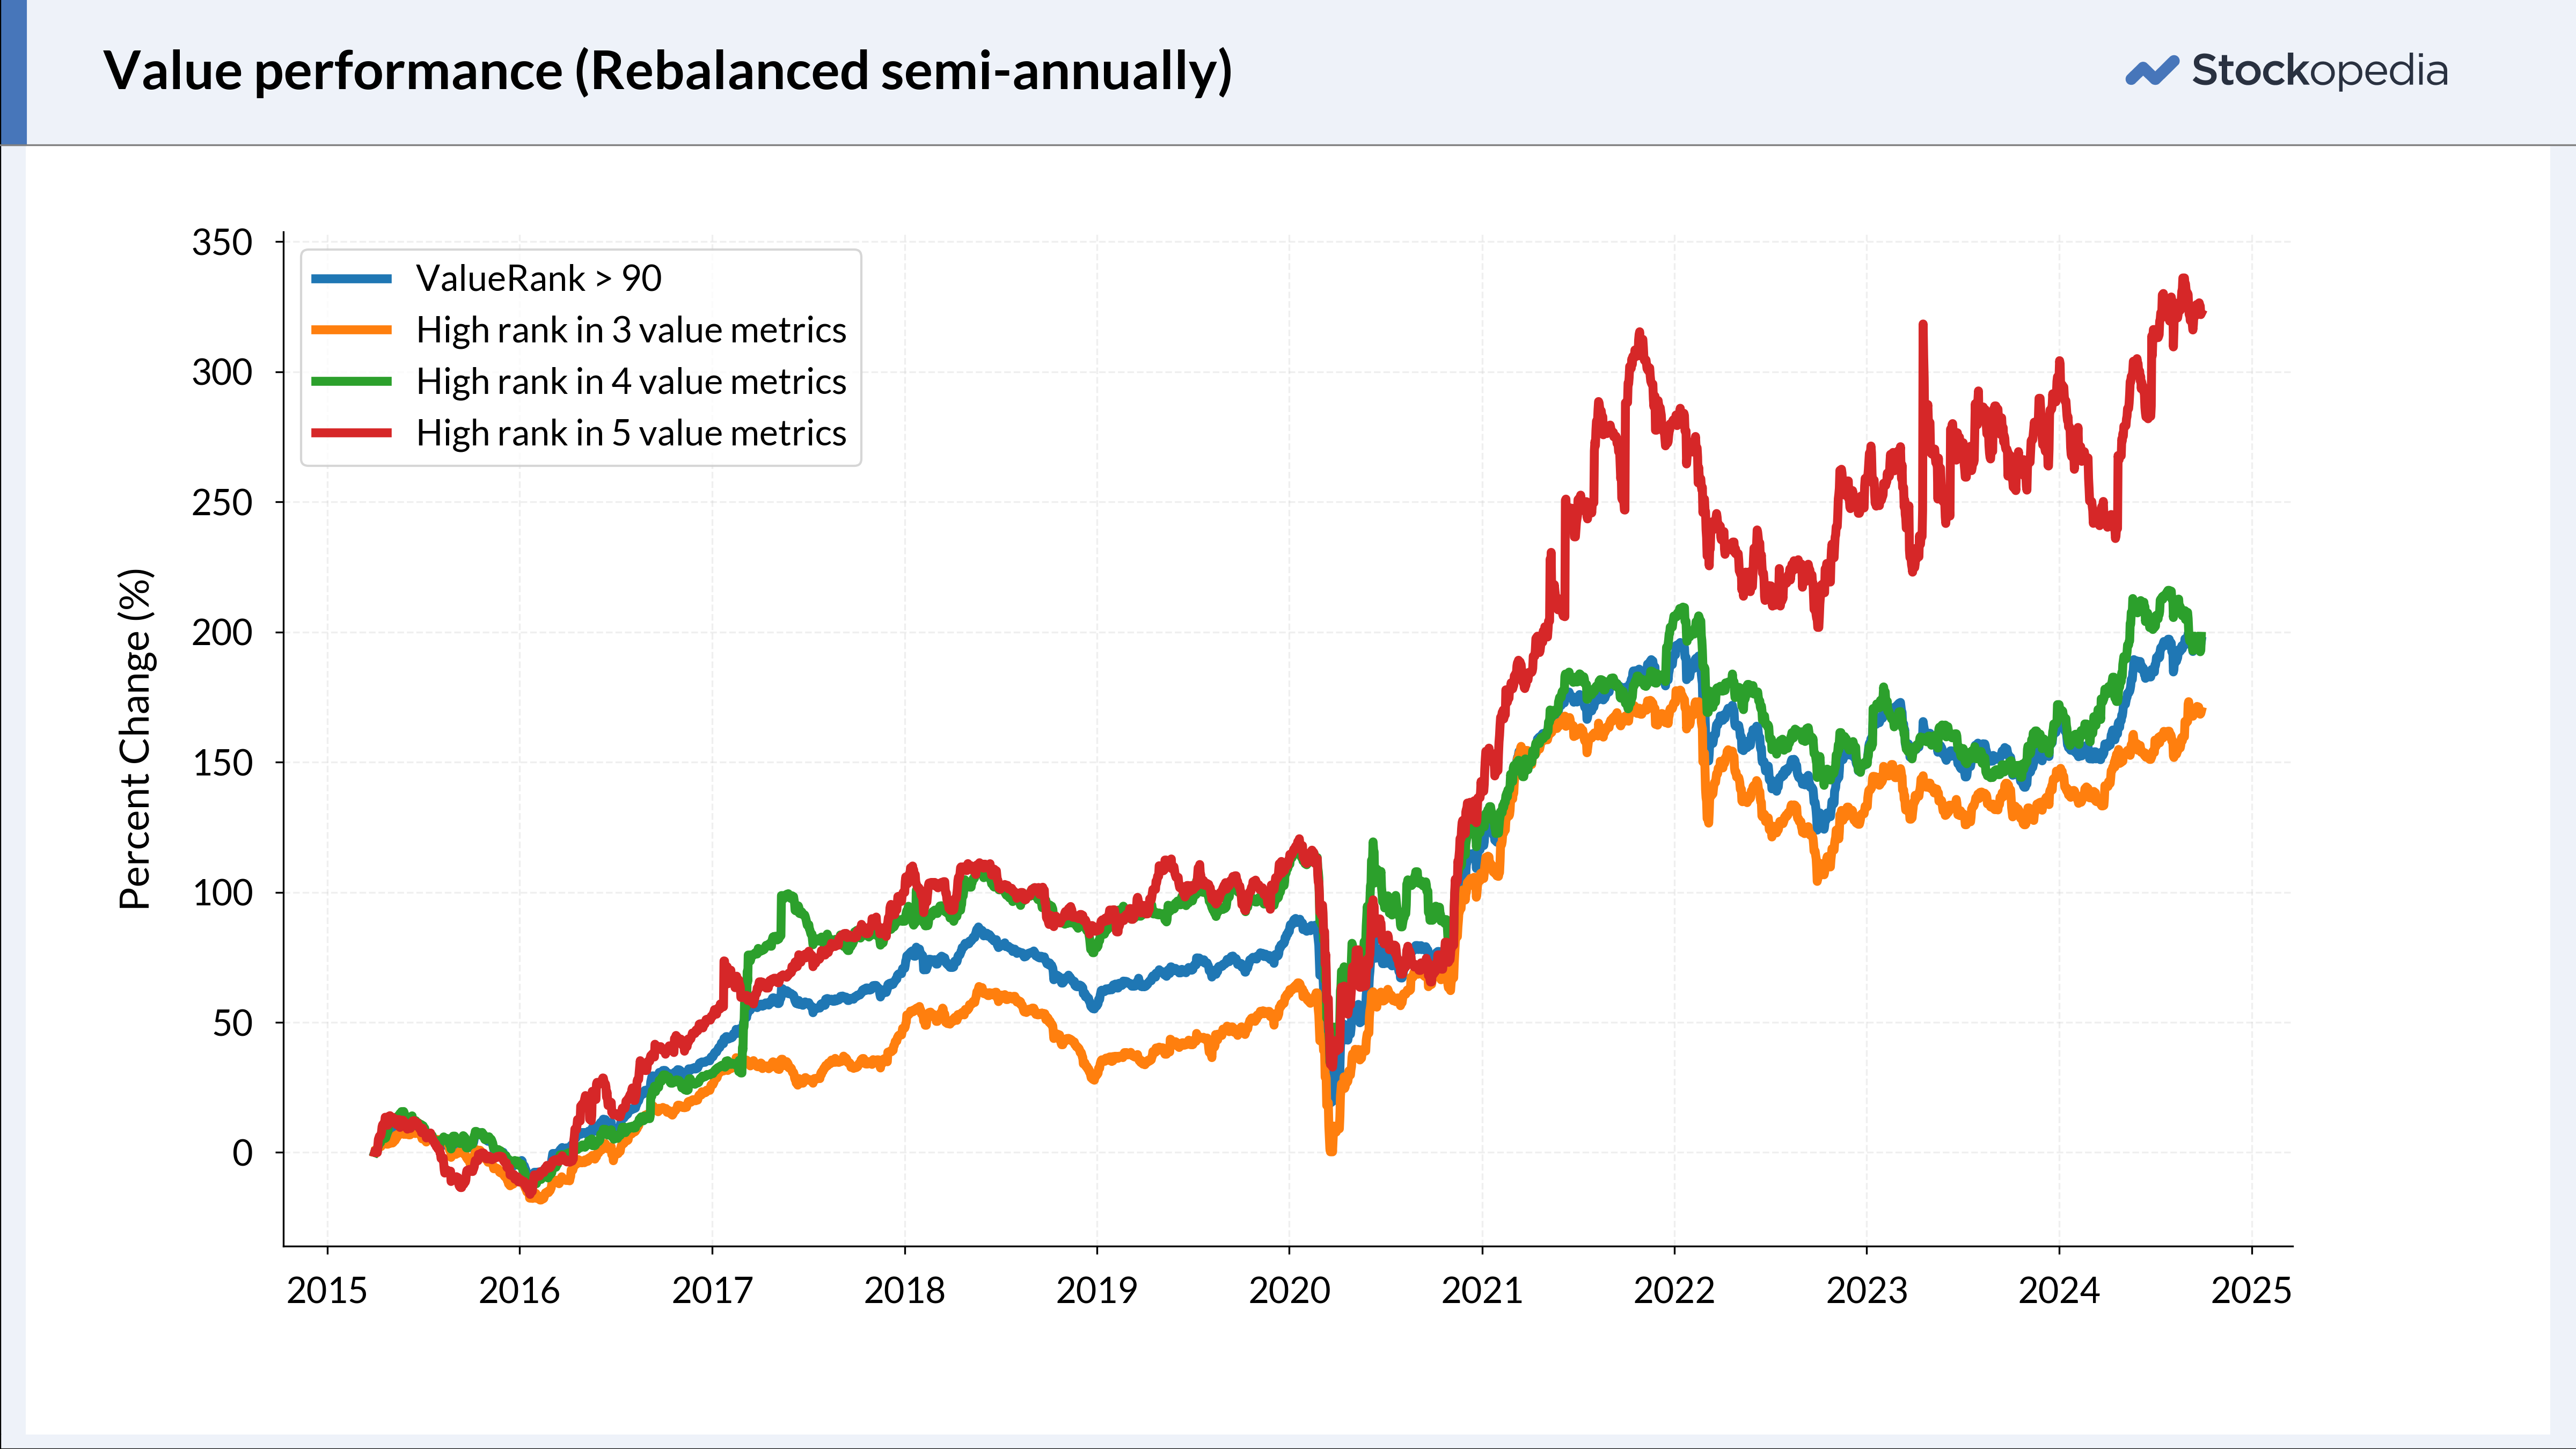
A similar trend emerges when the portfolio is rebalanced semi-annually. Stocks with only three high sub-component ranks underperform the ValueRank benchmark, while those with five high component ranks outperform over the long term.
We are not recommending the portfolios tracked in the simulation as investible portfolios. However, the concept of ‘overlapping value’ provides a more practical approach to gaining exposure to the value factor. These portfolios — those which are undervalued across a broader range of ratios — tend to be more selective and smaller in size. As a result, they are easier to manage in two key ways:
- Lower Transaction Costs: Fewer stocks mean fewer trades, reducing transaction fees.
- Simplified Monitoring: Managing a smaller portfolio requires less time and effort to track individual stock performance. Investors could therefore gain exposure to the value factor in a more practical way that does not require tracking the entire decile of high ValueRank stocks (≥ 90). The high ValueRank decile which usually includes over 150 stocks — an impossibly large number to hold and rebalance, especially if you are a private investor.
The search for Overlapping Value
Investors can leverage Stockopedia screens to search for Overlapping Value opportunities. The 'Rank in Market' rule is especially valuable, as it allows you to pinpoint companies with high rankings across each sub-component of the ValueRank. The StockReport traffic lights also display how a company ranks on a particular ratio (see here).
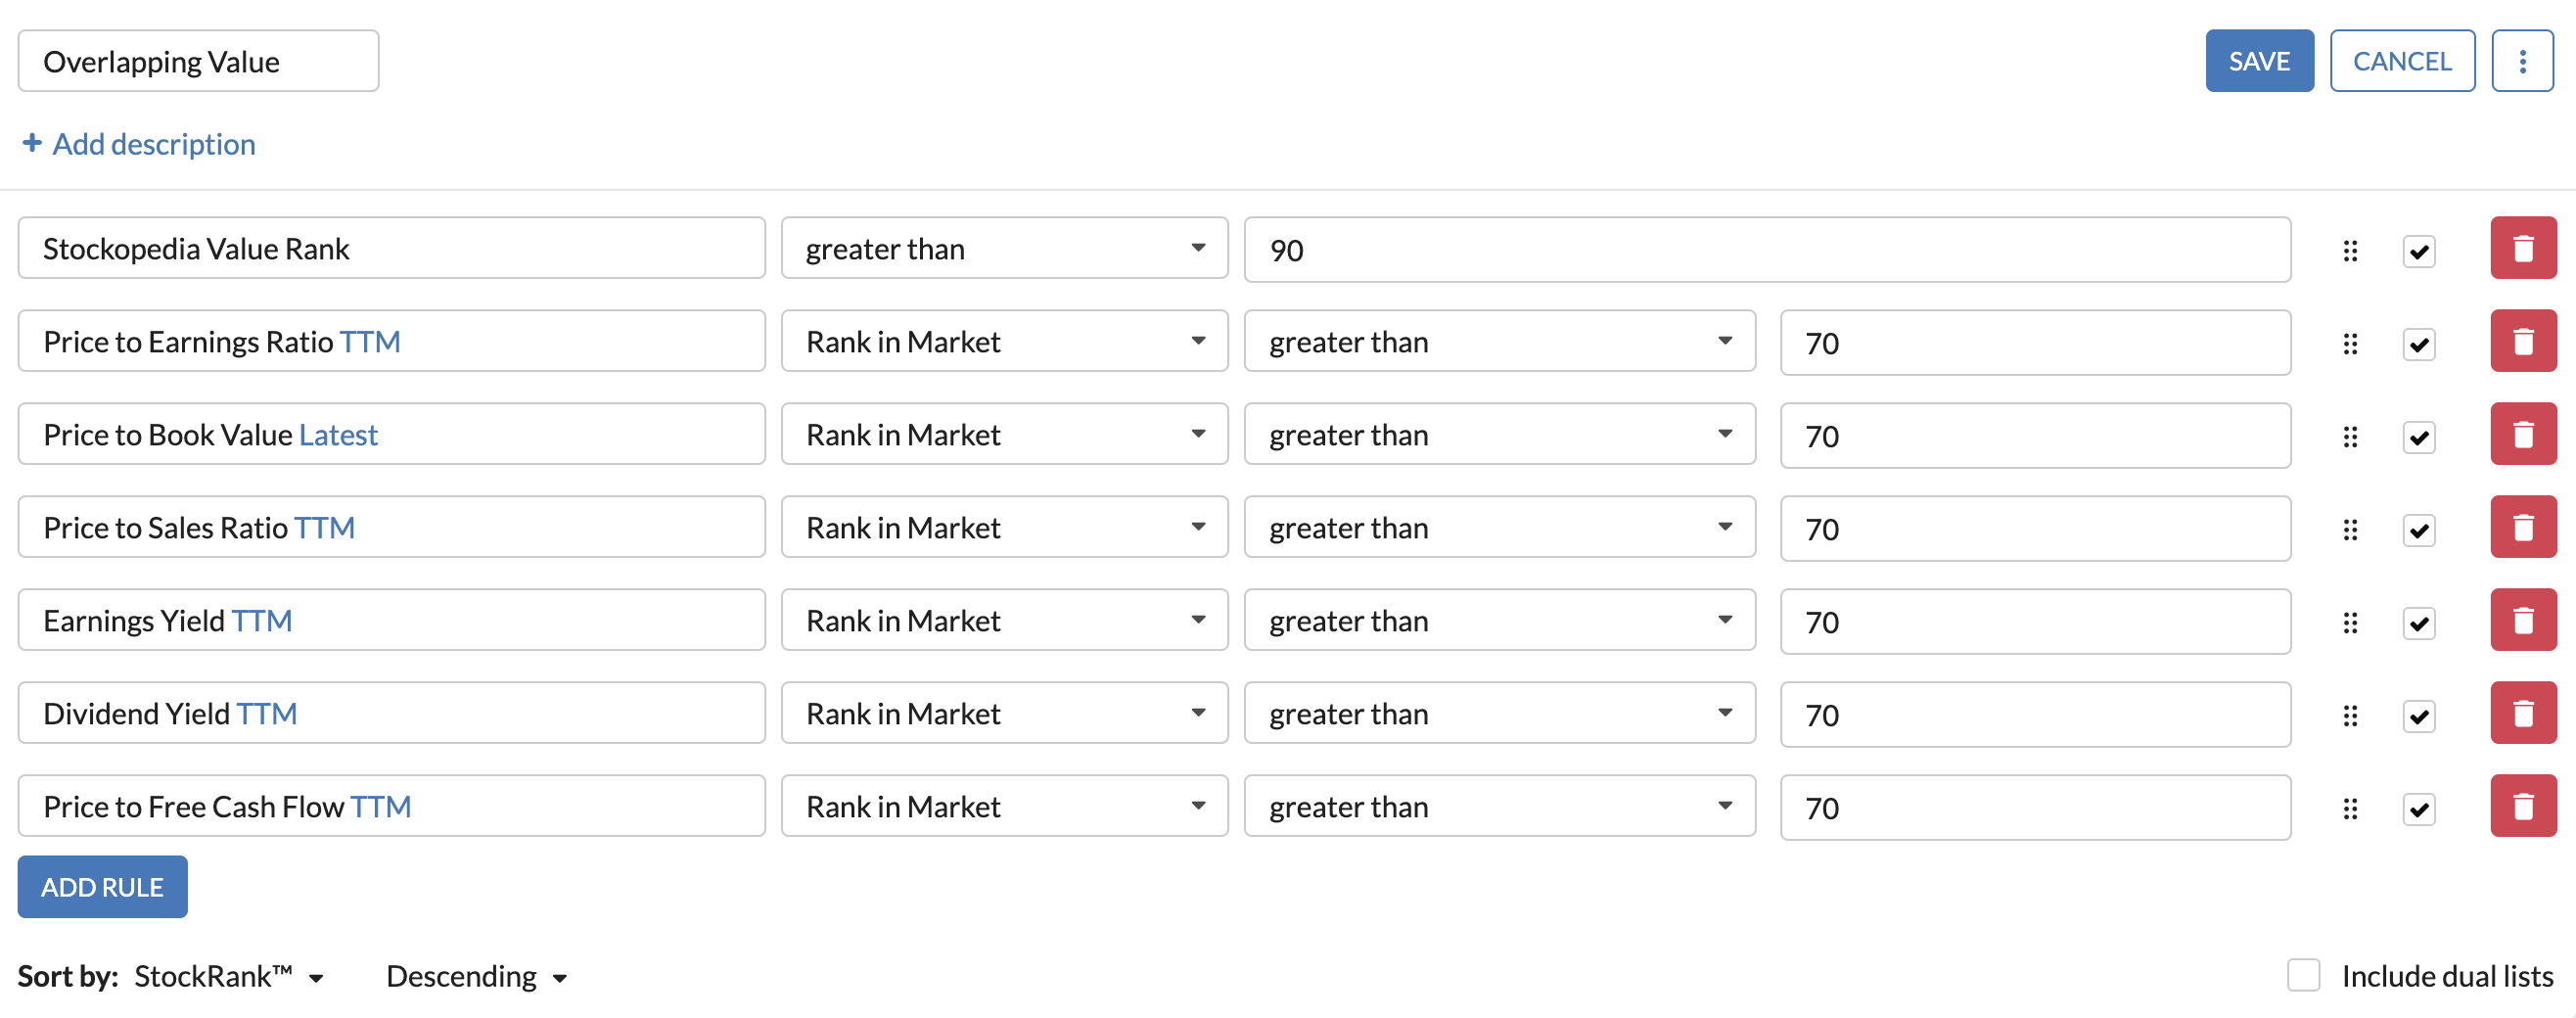
NB: I used a rank of 70 as the cut off, to get a wider selection of results
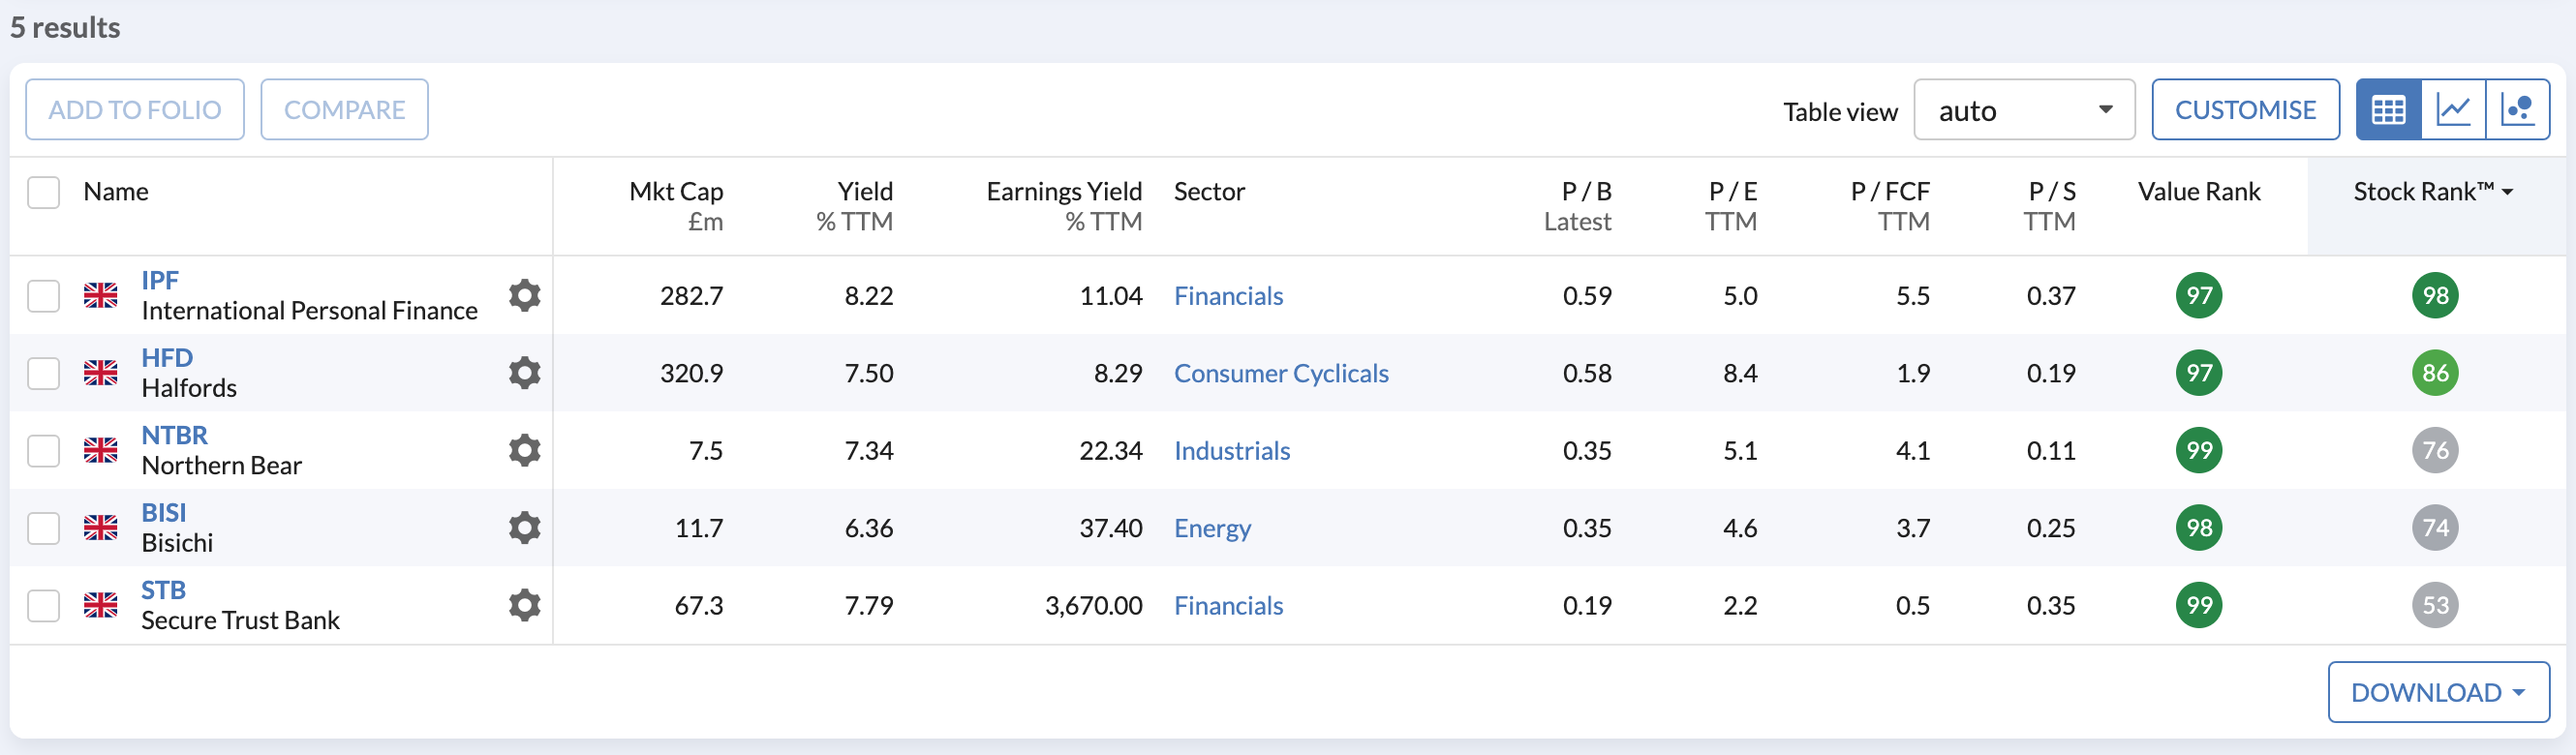
The list of qualifying shares is shown below. Northern Bear (LON:NTBR) was recently mentioned in the Daily Stock Market Report (link here). My colleague Graham reported, as follows:
Strong results with 83% of full-year EPS already in the bag as NTNR heads into the seasonally more difficult and usually quieter H2 period. I’ve thought NTBR was cheap for some time and in the absence of the share overhang that was affecting the stock until June, perhaps its valuation can improve.
International Personal Finance (LON:IPF) got a green rating from Graham on 11 November (see here). Halfords (LON:HFD) also featured in a recent Daily report, although the analysis was less bullish. Megan said:
Let’s be clear, these interim results are not good. The company reported a loss of market share in both its auto-centre tyres and retail motoring divisions and only a minuscule gain in a severely weakening cycling market.
The Daily Stock Market Report was also relatively bearish about Secure Trust Bank (LON:STB) although the report agreed that the company was cheap. On 1 November, Paul wrote:
Profit warning from this specialist lender... Therefore I see this share as GREEN for value, but RED for risk, so for me the high risk has to be prioritised in our overall view, so I'm reversing it from Graham's GREEN, to my RED.
Key take-aways
Ben Graham provided valuable insights into the role of market sentiment in stock market dynamics. Investors can refine their strategies by recognising that the market is driven by both reason and emotion. This involves two key actions: first, adjusting investment strategies to account for market sentiment; second; using metrics that appeal to a wide range of investors. Our research supports the value of targeting undervalued stocks across multiple metrics—what we call 'overlapping value.' These stocks tend to outperform over the long term and form smaller, more manageable portfolios, making them ideal for private investors seeking value exposure.
Disclaimer
This is not financial advice. Our content is intended to be used and must be used for information and education purposes only. Please read our disclaimer and terms and conditions to understand our obligations.
7 comments
It’s articles like this that make me a better investor! Or at lest a more informed one. Thanks
"The key is to identify an investment opportunity that is likely to be perceived as a bargain by a wide range of investors…" Will it be okay with you Alex, if I finish your phrase off by saying "later on, in time." My investment style is like my riding of a bicycle, by the seat of my pants. Sometimes I wobble, sometimes I fall off only to get back on again. Last Monday I drastically top-sliced PAF, today with the proceeds I added to CAML and SQZ. both of which the Stock Ranks Value prefers and I like their generous dividends. As it is, my portfolio stands at half its fair value and if I get to meet halfway there I'll be satisfied. Thanks for your input in your comprehensive post, I'll continue to dwell on it.
Excellent article, one of the best on Stocko for a long time. I would suggest that the different elements of value are highly correlated, but the different elements of momentum and quality have a much lower correlation. Which implies that this technique would work much better on these two factors.
I would very much welcome a later article investigating these two factors because i think the results will be stronger than value.
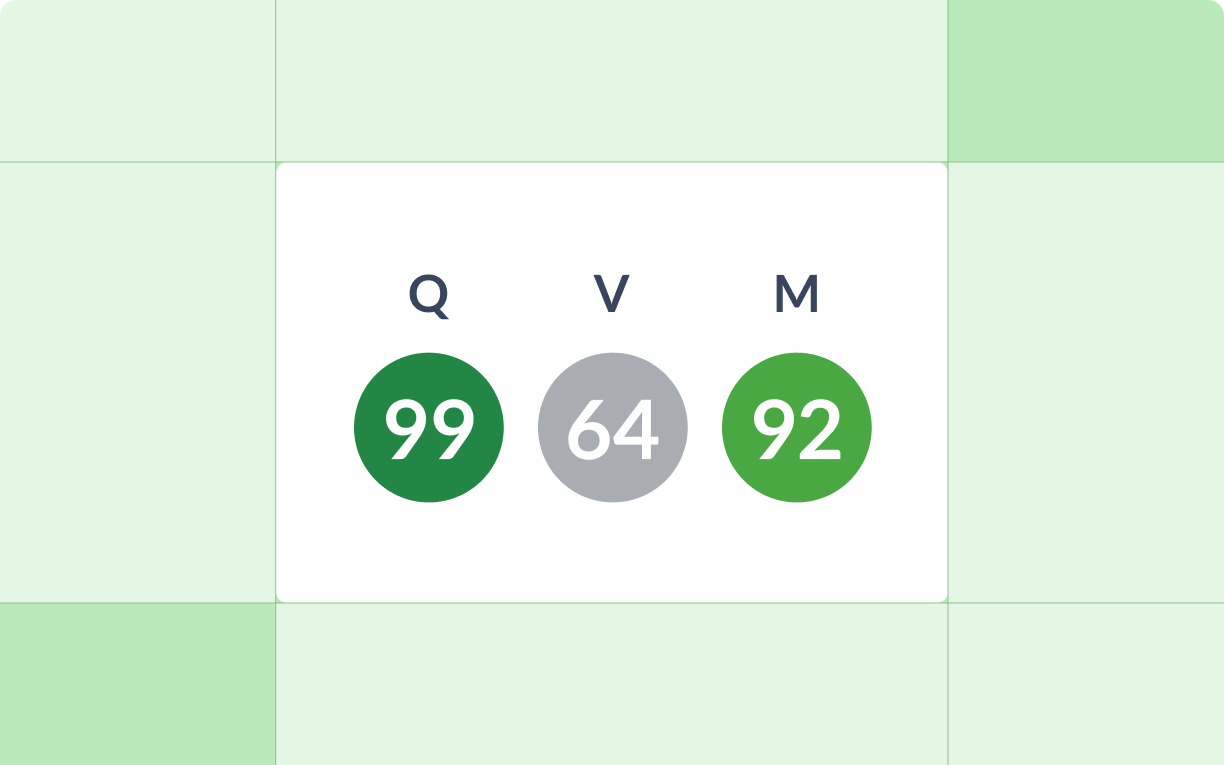
Hey, we can do this in a follow-up article, no problem. I started with Value because the rank is more or less an equal weighting of those six sub-components. The Quality and MomentumRanks are more involved, but that shouldn't stop us from doing the analysis.
I’d really like to see this too. Also, would be good to see how the selections perform going forwards, with some periodic rescreening
Thanks a lot.
An excellent article. More theoretical summaries like this please.