The Drift: why “ahead of expectations” announcements repeat themselves

Recently, I’ve been digging into the power of three words in trading statements - “ahead of expectations” to predict future share price returns. Last week, we dug into the “jump” - the share price response to a trading statement that indicates expectations could be wrong. And today we're going to zero in on the “drift” - the strange phenomenon which sees share prices continue to rise in the direction of the initial surprise.
This “post earnings announcement drift”, or PEAD, is known as one of the most shocking anomalies in the price behaviour of stocks. In fact, one academic called it “the most damaging to the naive and unwavering belief in market efficiency”, and there is now more than 50 years of research into this phenomenon. But despite all this research, and the fact that it’s common knowledge among professionals, still the drift persists.
What’s so exciting is that we, as private investors, are best placed to capitalise on it. We can deal in small trade sizes that institutions can’t, and get on board a share that’s benefiting from the drift. But it’s easier said than done. It’s psychologically tremendously difficult to buy shares that are on the rise.
So in this piece, we’re going to investigate the mechanics behind the “drift” to give ourselves the courage to get on board.
A Case Study in the “drift” - Yü Group
Before we dig into the weeds, let’s start with an example - using one of the UK stock market’s biggest multibaggers of recent years as an example. Yü Group - the energy provider to SMEs - has ten-bagged since its low in August 2022. Its story is instructive.
Yü Group took off at the end of 2022. It announced terrific results in September 2022 with revenues up 96% and the market started to take notice. The StockRank shot up to 98 which brought it into all the key Stockopedia screens. But then, on the 28th of November 2022, it announced that it was significantly ahead of expectations. A jump and drift ensued, powering the share price higher.
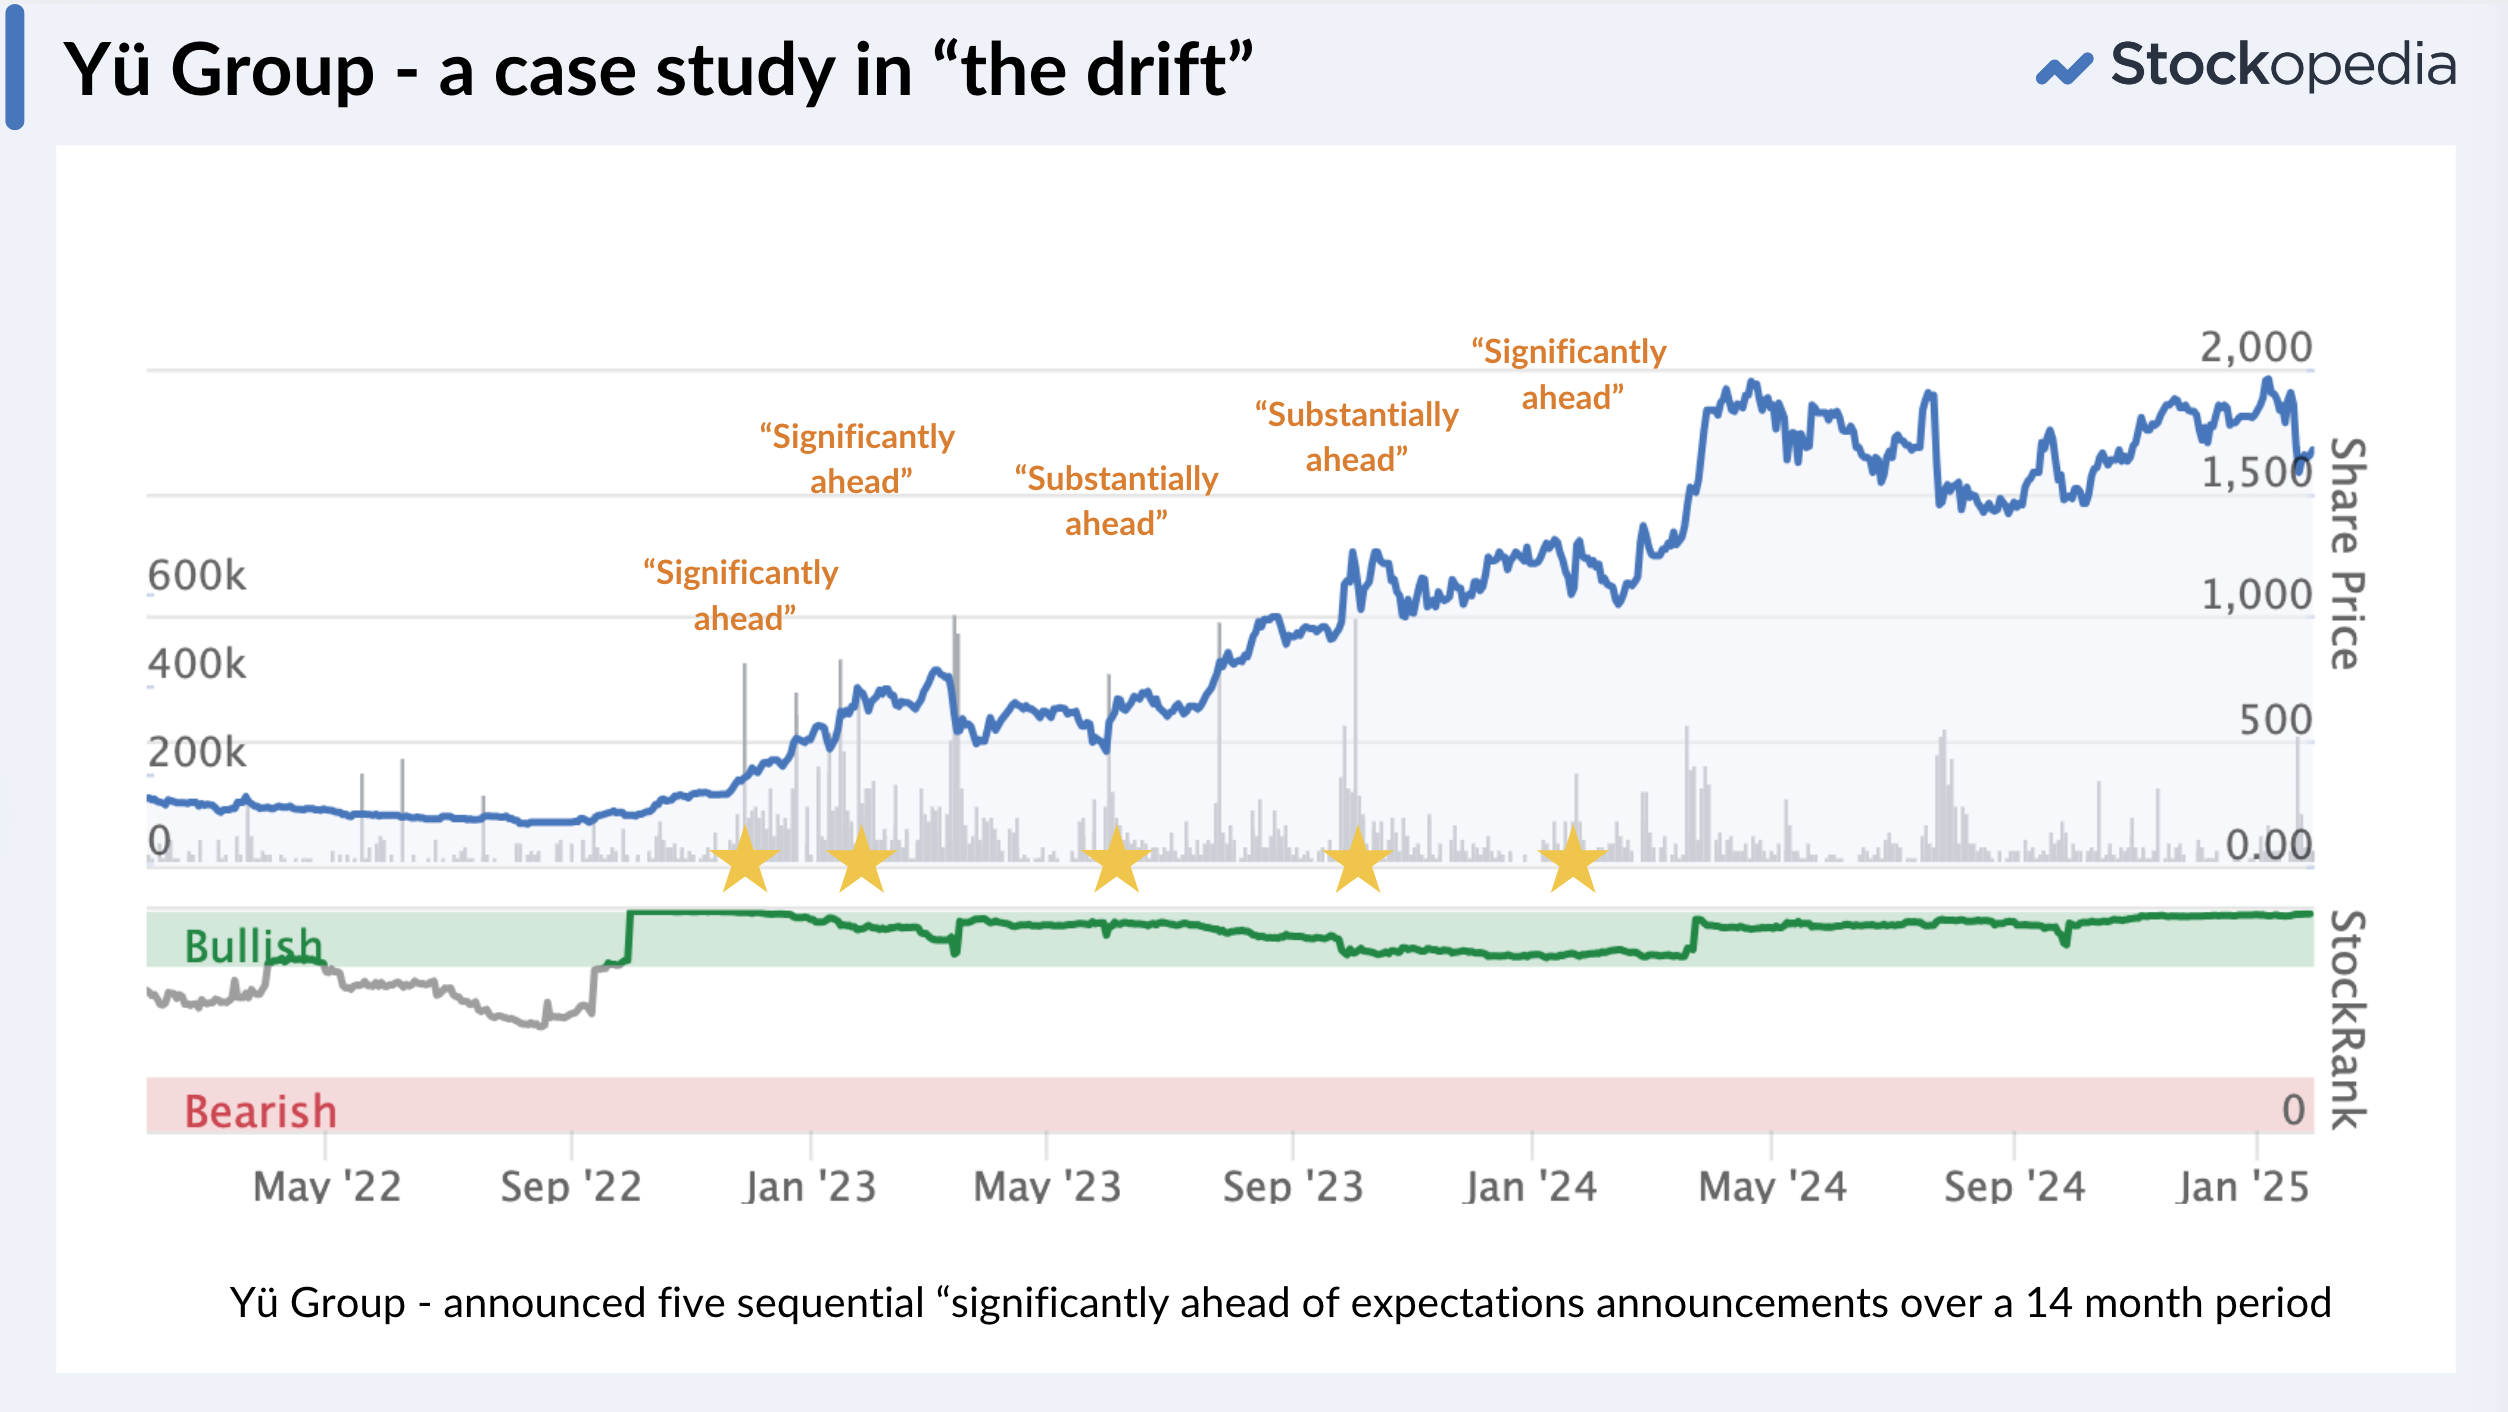
Soon after in January 2023, it announced again that it was significantly ahead of expectations. The shares were now above £6 having been trading below £2 only 6 months earlier. It was at that price that I bought the shares for the family, yes, with a lot of vertigo.
Brokers ratcheted up their numbers, and March final results came in strong, leading to a period of significant consolidation. But then within months, in May 2023 the company announced it was “substantially ahead” - another jump and drift. Yet again in July “substantially ahead”, and again the next January “significantly ahead”.
This performance shocked the City.
Why do analyst profit forecasts so often lag reality?
It’s extraordinary just how much City Analysts were consistently behind the curve in their profit forecasts. Here’s a chart showing how much they had to increase their forecasts over this 14-month period. A set of ratcheted increases in earnings per share took the earnings per share forecasts from zero to more than £1.50 per share.
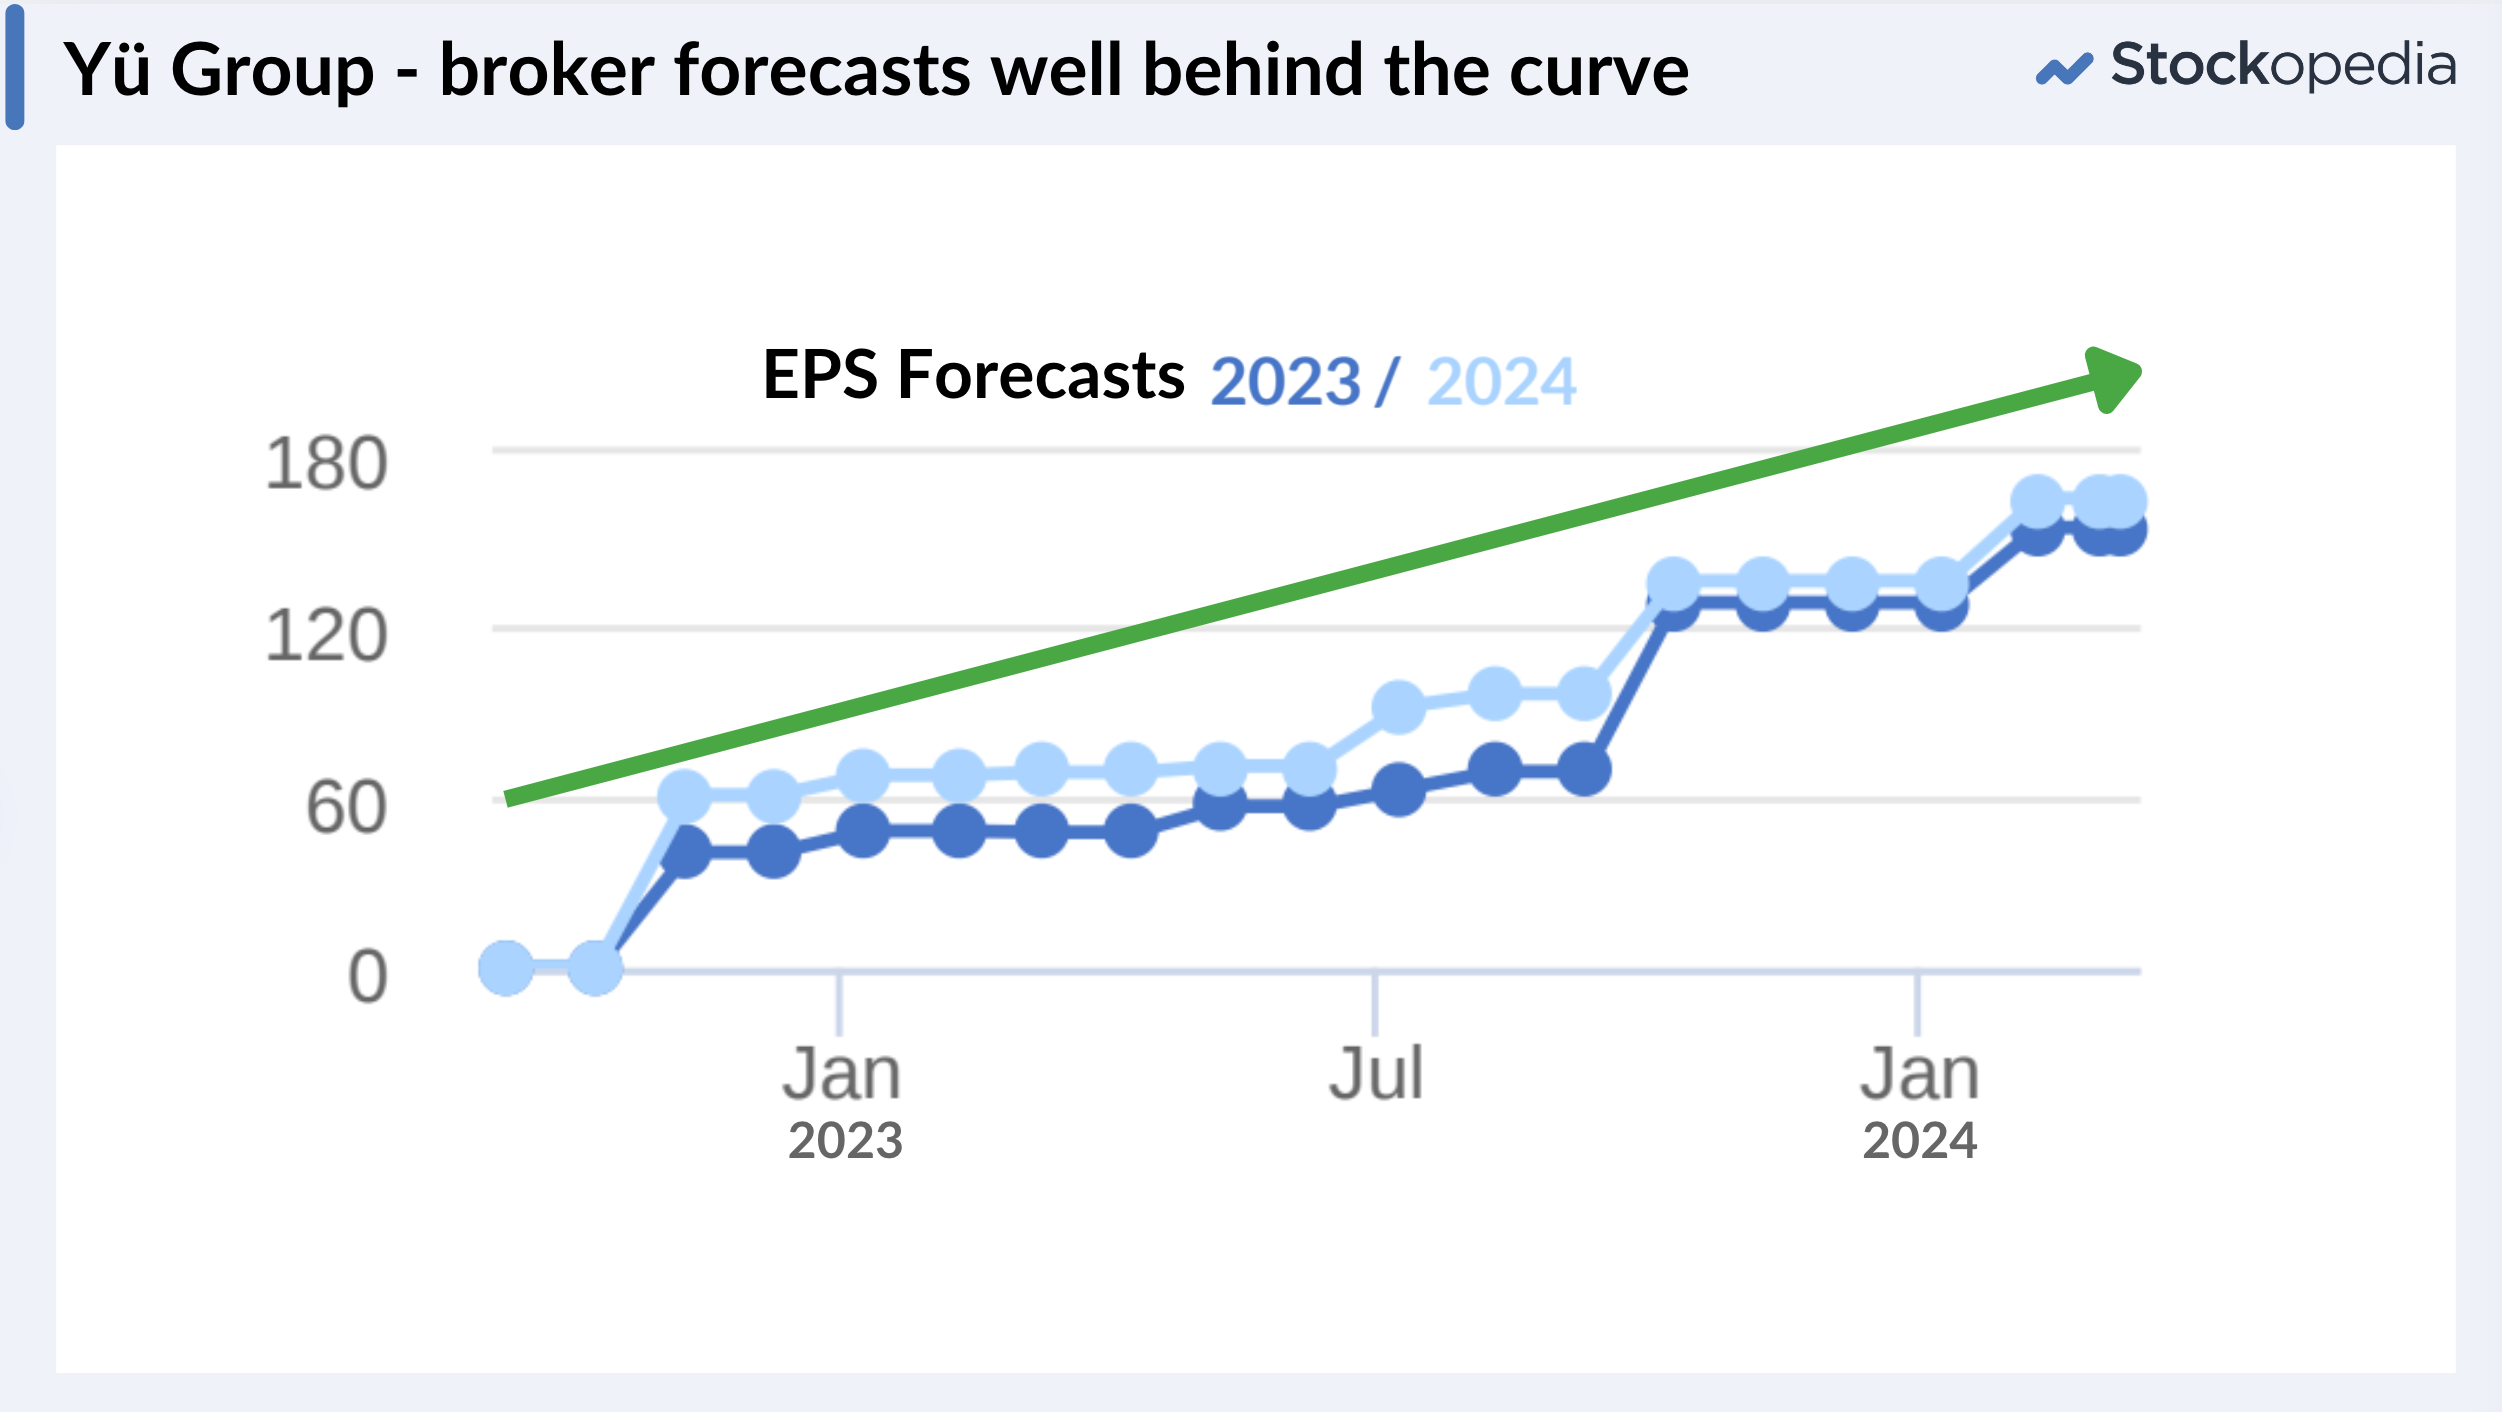
We see this theme again and again in the best stocks in the market - whether Yu (LON:YU.), Games Workshop (LON:GAW), Warpaint London (LON:W7L), Keller (LON:KLR) or Greencore (LON:GNC) in recent years, or some of the clear trending small caps recently like Filtronic (LON:FTC) and Synectics (LON:SNX) . The broker forecasts struggle to keep up.
Why do analysts get anchored on over-cautious forecasts?
There’s a well known behavioural bias called anchoring and adjustment. We all fall prey to it, and City Analysts are only human. We get “anchored” on current numbers and struggle to adjust.
Imagine you are a City Analyst forecasting a stock. You've built a big financial model with many well-considered inputs that calculate a well reasoned earnings forecast number.
When a trading statement comes along and surprises in a certain direction, you have to “adjust” your forecast model upwards. But you may have communicated your current numbers to colleagues, clients, or publicly. It was well reasoned. You don't believe that your previous estimate is too far from reality, so you only adjust it upwards partially.
That sets the scene for a company having to keep banging the table that they are still ahead of your expectations — again, and again, significantly ahead — until either the business slows down or your financial model finally catches up to reality.
Investors are slow to accept new information
It’s not only the analysts who are slow to adjust. Shareholders are too. Another extraordinarily weird human behaviour is that we are far more likely to sell a share quickly for a small profit than we are to crystallise a loss. This is known as the “disposition effect”.
What happens when share prices jump, is that current shareholders often sell - happy to pocket a quick profit - and new shareholders refrain from buying as they are anchored at the lower price and can’t bring themselves to cough up. So ironically, when a share price jumps on positive news, there is often too little buying, and too much selling.
New investors have to accustom themselves to the new information, and the new price levels until they are willing to buy. Often, trading statements don’t have that much information, so serious investors will wait for the full half-year or full-year results. This “slow diffusion of information” and repeated resets of expectations create trends (and often smooth trends).
The power of repeated “ahead” announcements
Of course, many companies that announce they are ahead of expectations don’t go on to repeat those words. In our research study, we’ve been using a brute force phrase matching technique, which only classifies about 50% of the trading statements over the last ten years, but the results are still compelling.
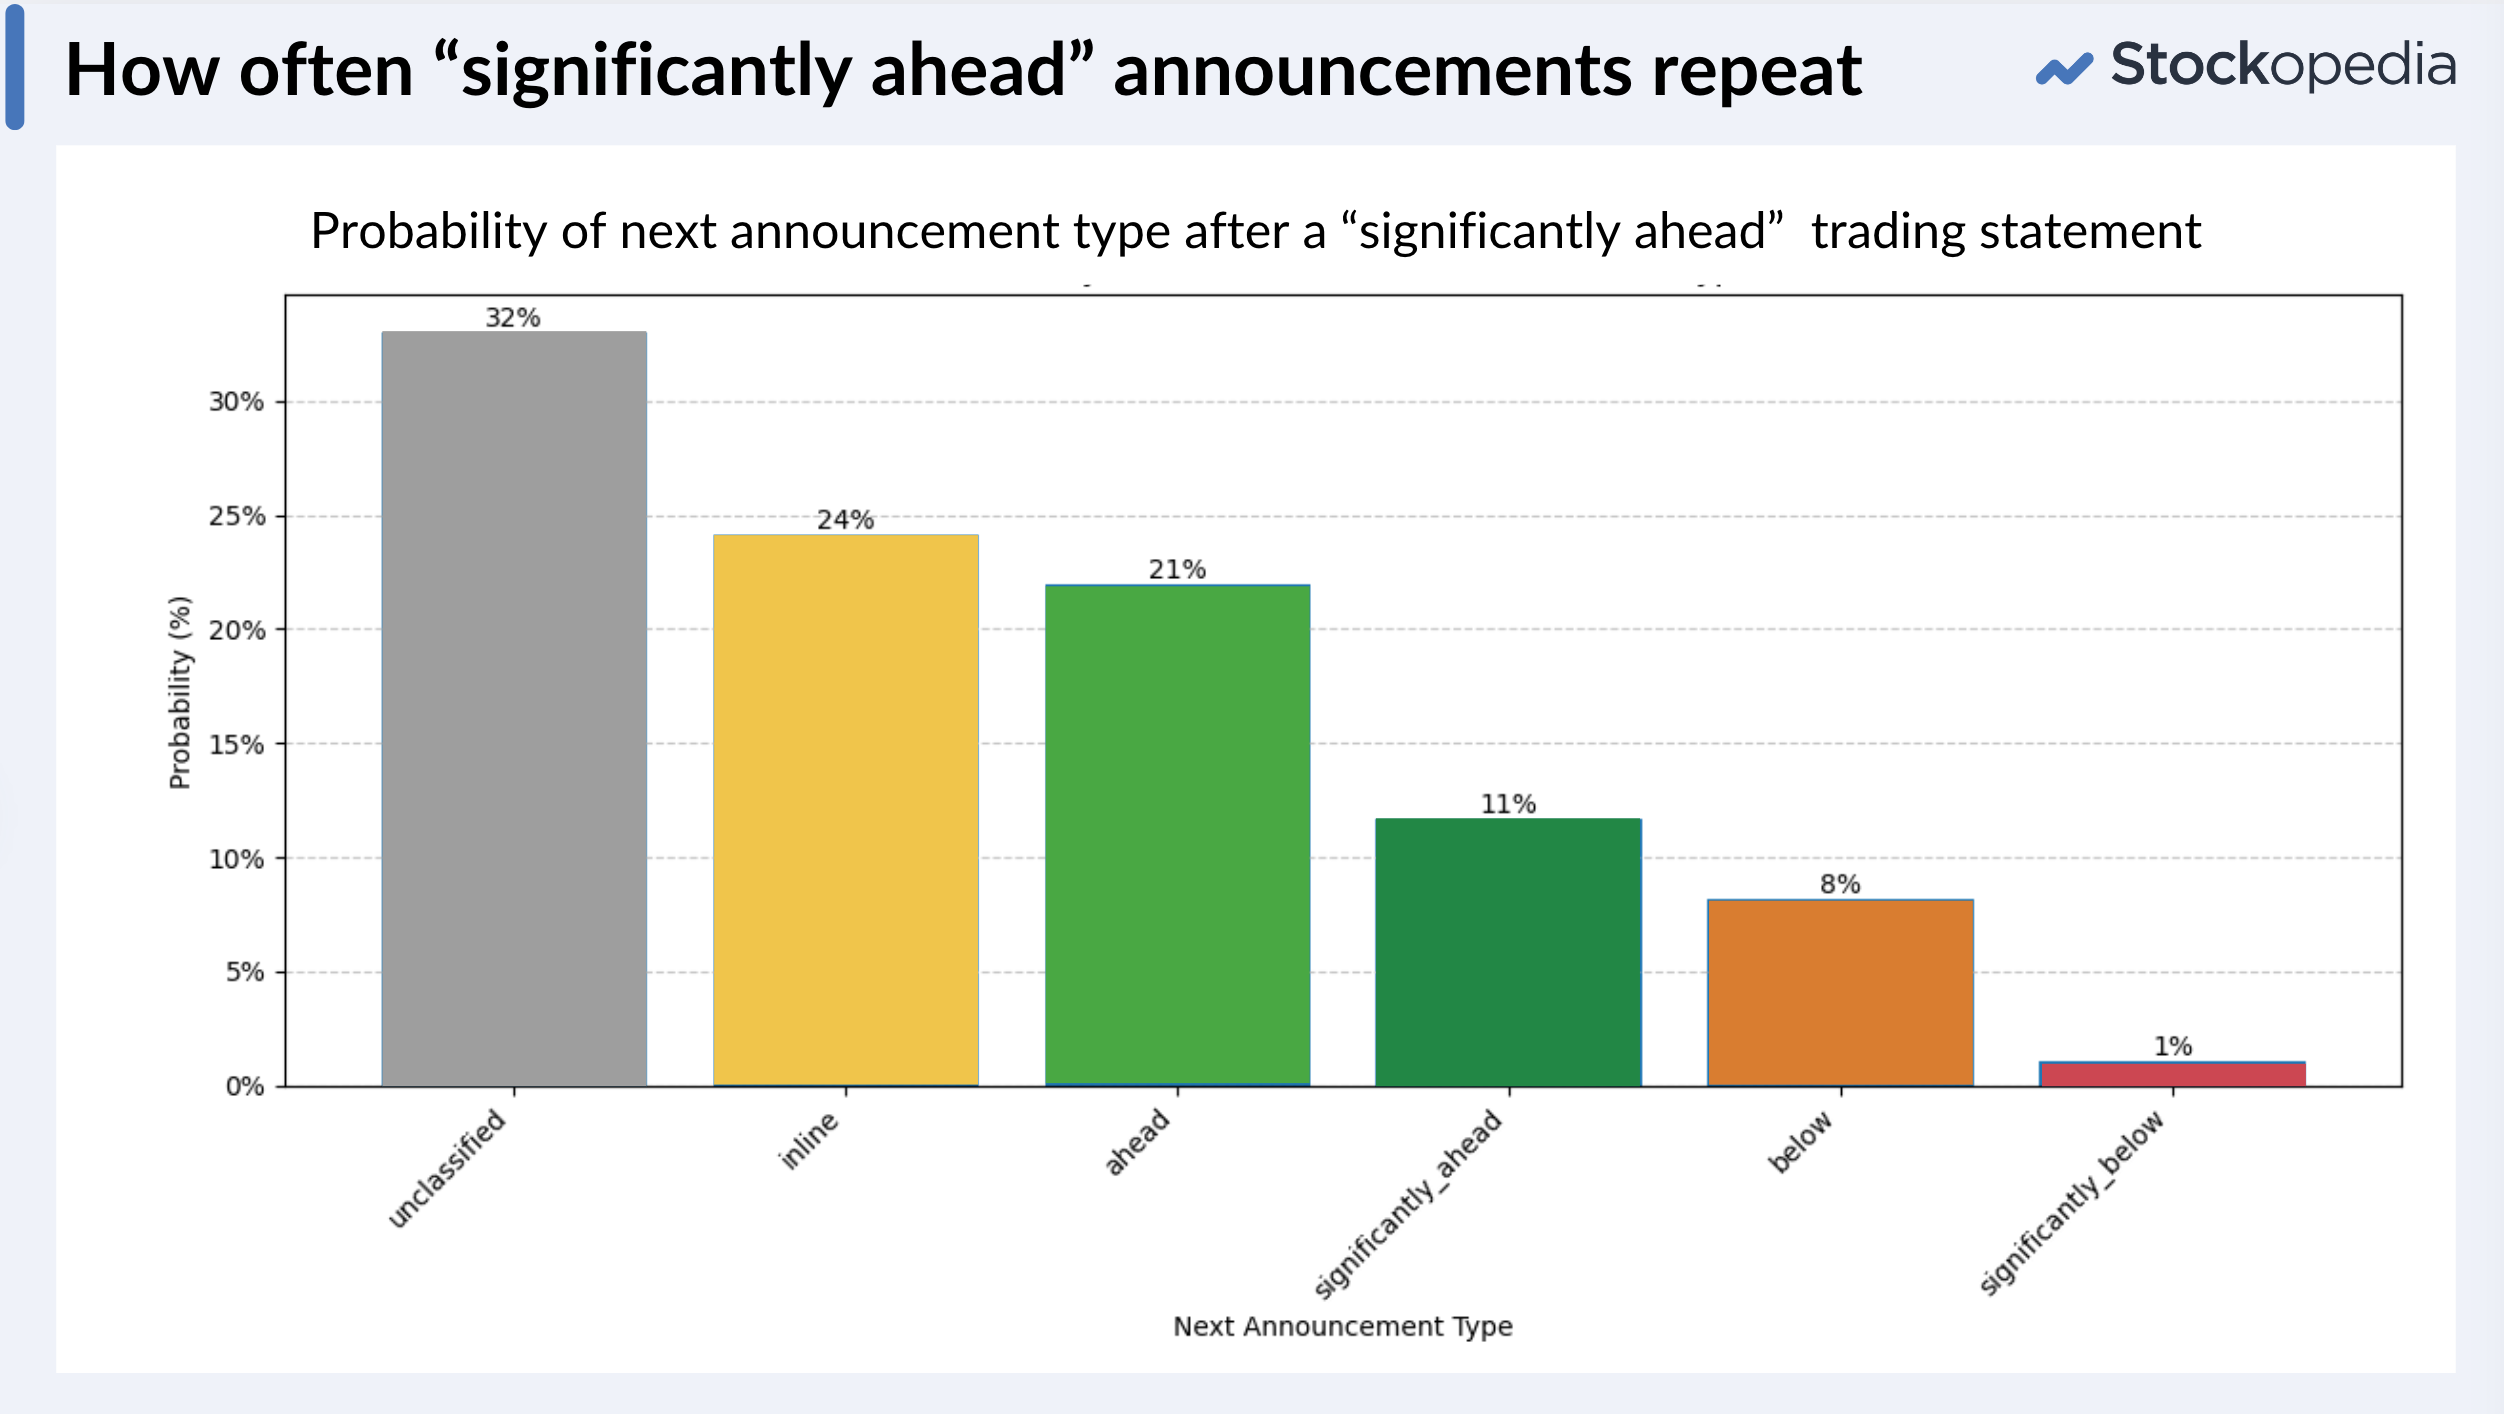
After a significantly ahead of expectations announcement, there’s about a one-in-three chance of it being followed immediately by another clearly identified positive “ahead” or “significantly ahead” announcement (and about 1 in 4 after an “ahead” announcement).
It’s startling how much higher the performance is for companies that announce sequential “ahead” announcements. If a company reports it is “ahead” of expectations (or better) and has a 5% jump on the day, the average return is 12% over the next 12 months. But those stocks that go on to announce another “ahead” announcement return an average 39% over the next 12 months, with some more than quadrupling!
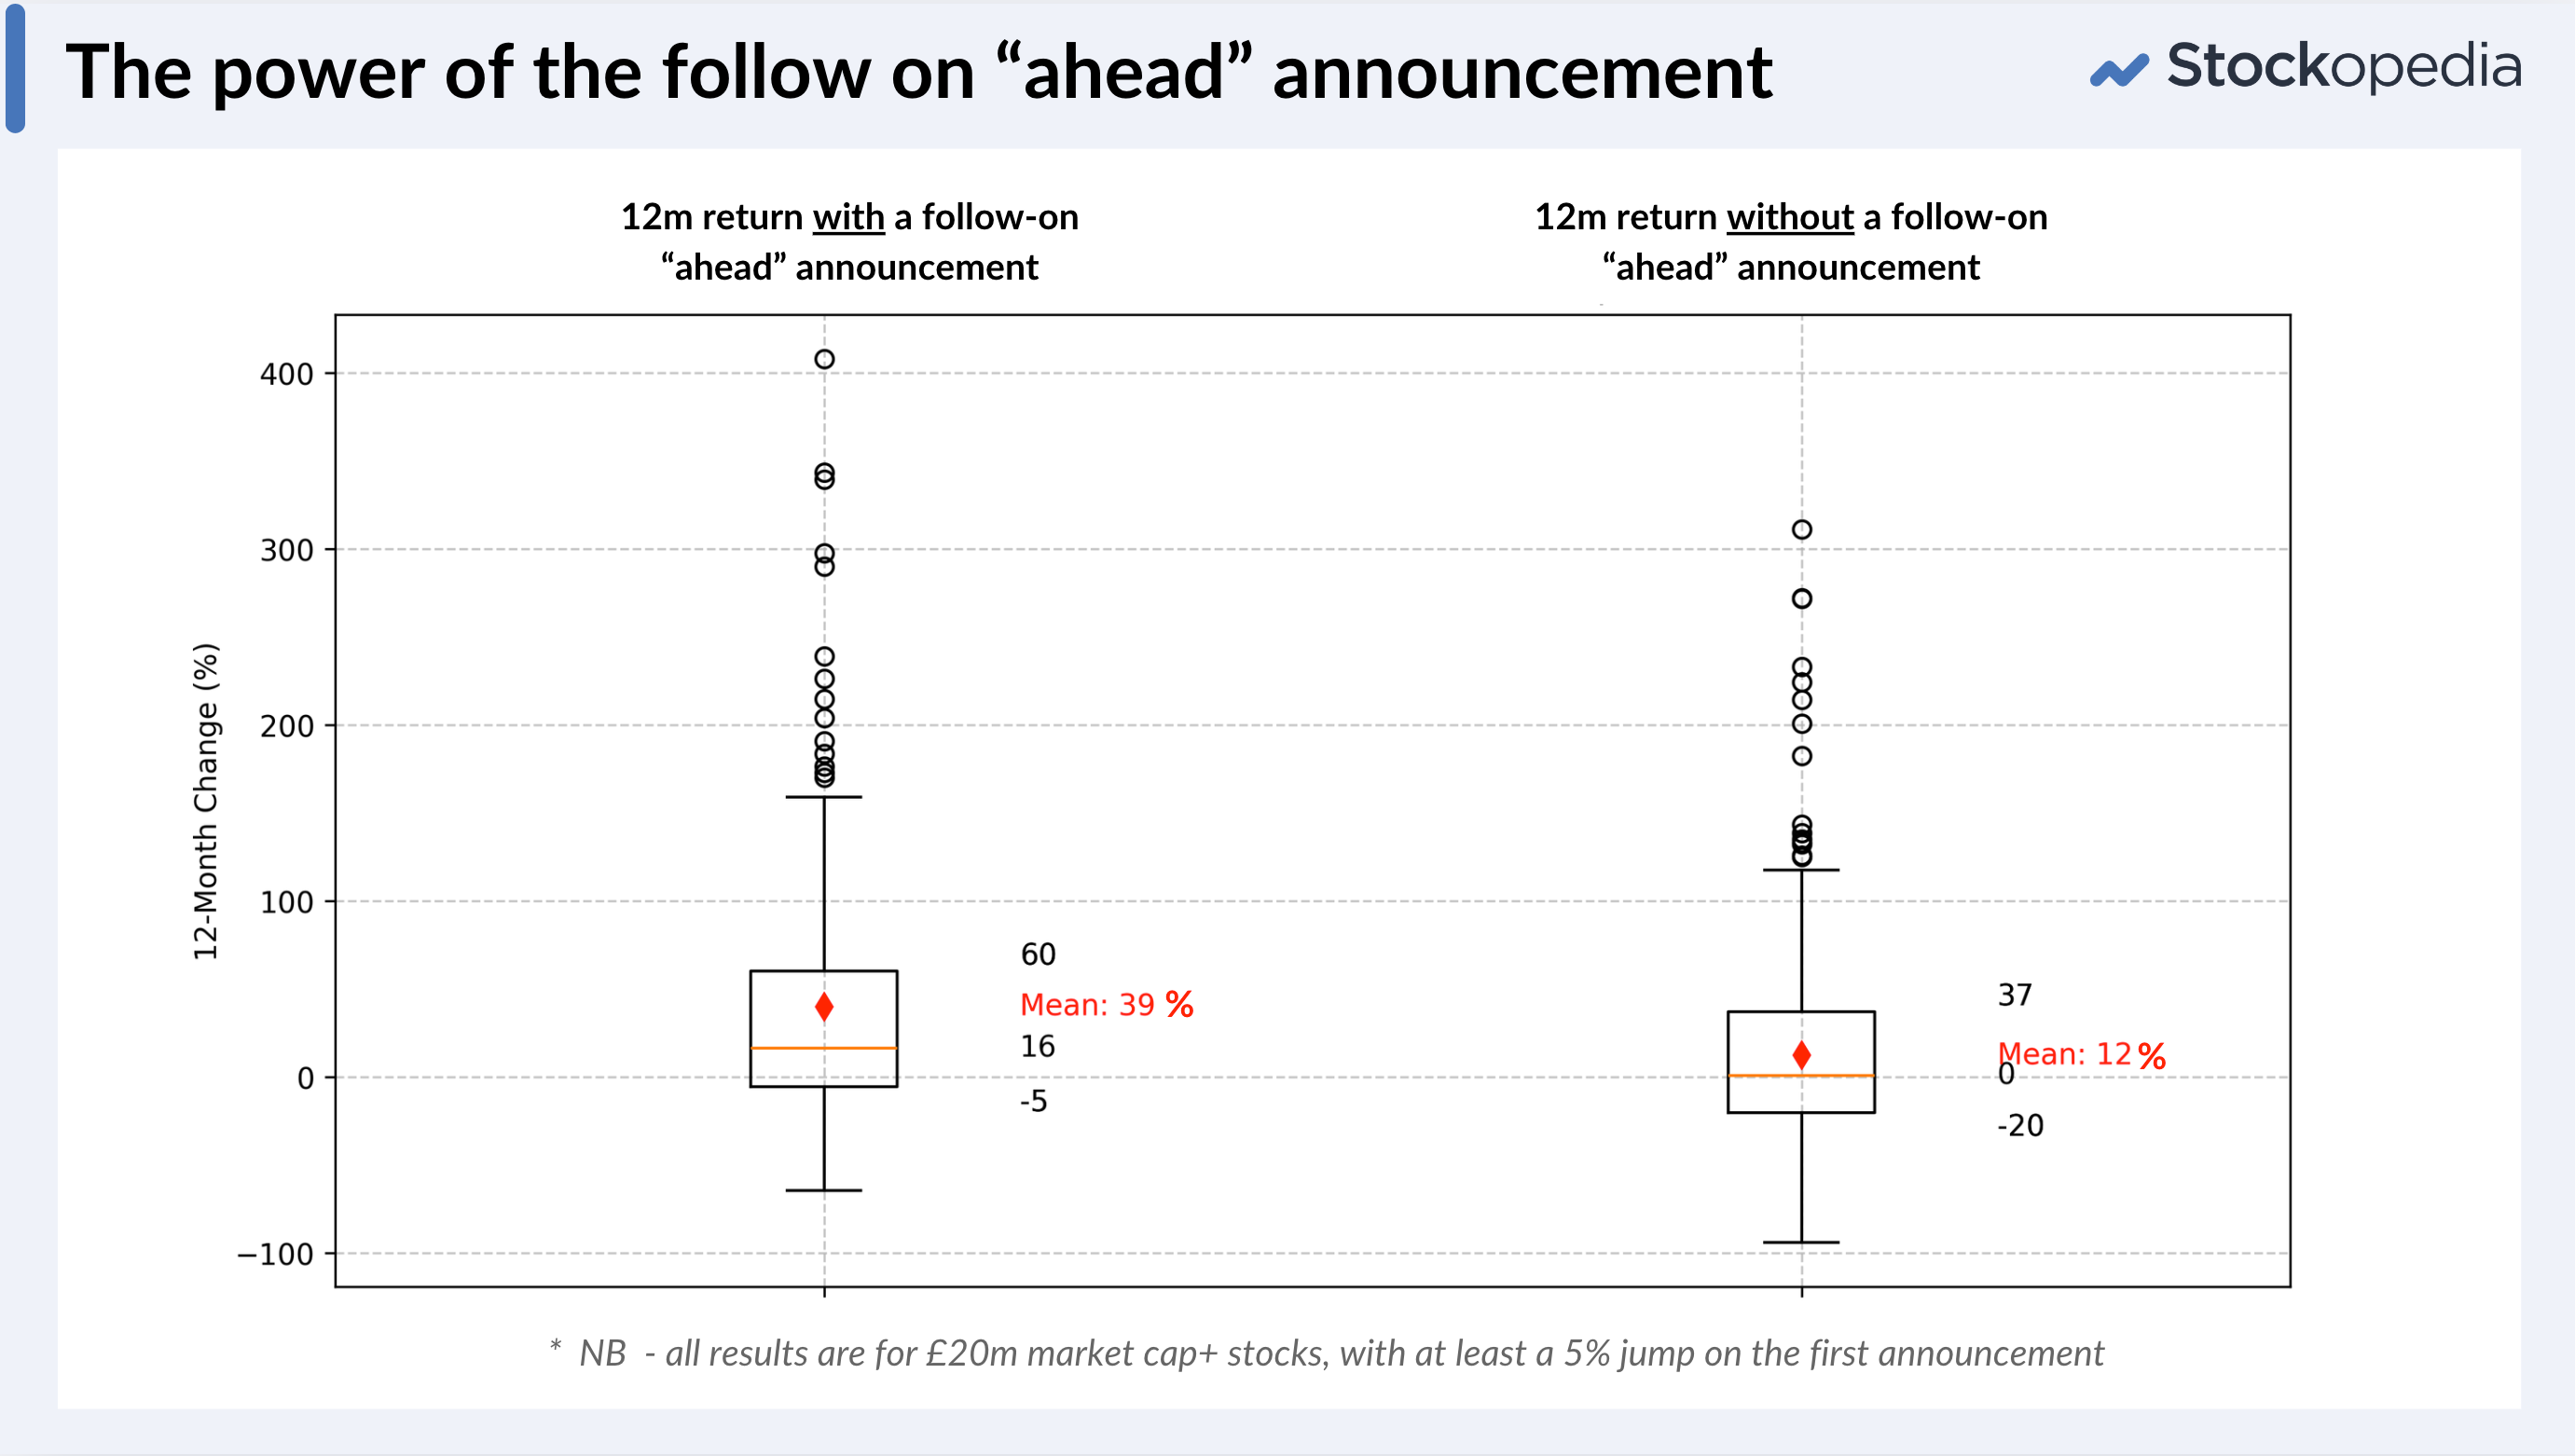
And these companies don’t take long to follow up. The average number of days after the first announcement to a follow-up announcement is about 110 days. Most companies in the UK only report every six months, but the real market stars issue positive trading statements every few months. These “serially ahead” shares really are the ones to own. They lead to upgrades, better fundamentals, increases in profitability, and most of all, outstanding capital returns.
Which stocks have been repeating “ahead” announcements recently?
Let’s have a look at a few of the stocks that have repeated serial ahead of expectations announcements recently. My data is a couple of weeks old, so doesn’t include more recent announcements - but I’m sure you’ve been reading the Daily Stock Market Report haven’t you?
- Filtronic - StockRank 73 - 2x “ahead” since 2024-12-16, and 4x since April with 1 inline.
- Distribution Finance Capital Holdings- StockRank 77 - 2x ahead since 2024-12-06.
- Synectics - StockRank 93 - 2x “significantly ahead” since 2024-09-16.
- Journeo - StockRank 95 - 2x “ahead” since 2024-07-30.
- Trufin - StockRank 69 - 4x ahead since 2024-05-13.
- Audioboom - StockRank 31 (which I don’t like) - but 3x “ahead” since 2024-10-15.
We often get downbeat on the UK stock market, but there are some great little listed businesses. It’s so good to see that a company like Filtronic, which told its story in person to private investors at a Mello event only 15 months ago, has gone on an outstanding run, signing a deal with SpaceX and become a great success story.
These are the kinds of stock market lift-offs are often only available to private investors, as institutions can only buy in size on IPO or at placings.
I hope that now you are aware of the catalytic power of ahead of expectations announcements, and the ensuing jumps and drifts, you can capitalise on them when they happen.
Disclaimer
This is not financial advice. Our content is intended to be used and must be used for information and education purposes only. Please read our disclaimer and terms and conditions to understand our obligations.

38 comments
Sterling Infrastructure (NSQ:STRL) which has a history of beating earnings expectations did it again yesterday when they announced they had smashed EPS estimates by 57% after Q1 revenue grew 92% YoY.
I've held since mid September '25 and it was sadly too early for inclusion in my public QM Growth Portfolio. I do hope some of you hold as it's on target to open up by 27% today. I'm sat on a 48% gain pre-open.
This video explains how to technically trade Post Earnings Announcement Drift much better than I can show with any charts. (699) How Traders Catch Big Moves After Earnings (PEAD Strategy) - YouTube
Here are some graphs demonstrating significant volume on trading updates leading to major moves. Was this institutional buying of the shares. The Games Workshop example was at the beginning of June 2017 which was significant volume then, not the mid June volume. But I`ve noticed sometimes there`s more volume that comes in after the initial spurt.
Have just read The Trading Handbook (released last week) and one of the set ups they highlight is when the share has the highest volume ever on the daily chart, or highest volume in a year. What is interesting is when I looked at the past winners you suggest in this article, I can see huge volume on every one of these charts on Trading Update days. Yu Group see 28/11/22, 25/7/23. Warpaint see 28/6/22, 26/4/23, 15/6/23, Games Workshop see 2/6/2017, Keller see 17/5/23, Greencore see 10/10/23, Filtronic see 24/4/24, Synectics see 11/12/13. Its not always the highest volume in a year, but it always significantly above average. It would be interesting to see if the level of volume on the day of a trading update is a significant indicator of whether the share will ultimately outperform
A great article Ed. The first section I read in financial statements is the chairman statement. They usually set the flavour.
Check out these there is so much research on movements before and after announcement's . Not that pages, to skim through
"Institutional Trading Around Earnings Announcements"
Summary: This study utilises a unique database comprising the daily transactions of institutional Australian equity managers to examine their trading patterns around earnings announcements.
Link: https://papers.ssrn.com/sol3/papers.cfm?abstract_id=972653
2. Investor Heterogeneity and Trading Around Earnings Announcements
Summary: This paper investigates how differences in the precision of information among investors affect trading behavior around earnings announcements.
Link: https://business.gwu.edu/sites/g/files/zaxdzs5326/files/downloads/InvestorHeterogeneityTradingEarningsAnnouncements_2014104.pdf
3.Transaction Sizes and Institutional Investor Trading Patterns around Earnings Announcements
Summary: This research examines the use of observed transaction sizes to differentiate between small and large investor trading patterns, particularly around earnings announcements.
Link: https://business.fiu.edu/academics/departments/accounting/research-workshops/docs/w-cready-working-paper.pdf
4. Institutional Trading around Corporate News: Evidence from Textual Analysis
Summary: This paper explores how institutional investors trade around corporate news events, including earnings announcements, using textual analysis.
Link: https://files.fisher.osu.edu/department-finance/public/institutional_trading_around_corporate_news_evidence_from_textual_analysis.pdf
How many Analyst's/ brokers give a sell? None, its a fixed market. Banks own the brokers. Conflict of interests.
Last 20 years brokers have been wrong.
Of the books recommended on stockopedia is David Dreman contrarian investing . Top book, one whole chapter on brokers and analysts and why you should bin their recommendations and just ignore analyst estimates /take with a pinch of salt.
When do you see a sell by Barclays or Goldman sachs, or Jefferies for a top firm?
How much noise was there with w7l thats been flat for an age
"When do you see a sell by Barclays or Goldman sachs, or Jefferies for a top firm? "
When they want to buy some!
Surprised how much influence brokers have on share prices lately.
Really useful article and podcast discussion.
Apologies if it's an amateur question but how would we screen for shares that have the EPS forecast chart rising? Ideally on a month by month basis? Is that possible?
Also would it be possible to be able to view that chart on screener results (where you have table view, chart view, bubble view ) in a future upgrade?
Thanks!
There are a few ways you can do it. Search for "upgrades" in the screener and you'll see a few options or you can copy this one - https://www.stockopedia.com/sc...
Excellent thanks Ed
Interesting article, unfortunately most of my picks are reporting in line with expectations rather than exceeding or ahead but Reach (LON:RCH) is one that has recently issued a statement reporting ahead of expectations will be tracking what the next few announcements state. I do think a lot of UK companies who employ a lot of people in the UK may want to taper announcements to see what impact the government budget will have on their own costs plus the state of the economy.
Thanks for yet another fascinating article. Have you looked at, or has existing research looked at, the extent to which PEAD applies across all levels of market cap? For example, for mega caps that receive more attention than small caps, is the time window for PEAD shorter than for smaller caps that receive less analyst and investor attention? Also in terms of the scale of subsequent moves, it sounds like the research suggests there is some meaningful PEAD at all levels but does it very by market cap? Also does it vary by market for instance comparing the USA to the UK?
The best summary of the research is in the paper "50 years in PEAD Research"
There's lots on small caps in there, and yes the drift is stronger in small caps.
Ed,
Does your 10 year RNS data reveal what % of the total were the equivilent of "Ahead" and "Signifigantly Ahead" please?
It's a moveable feast... but of those I can classify...
Now we need to figure out how to predict those companies that will announce a "significantly ahead" trading statement !
Ed - great article as always.
I believe the research, including Stockopedia’s. Anticipatory prediction might be an ask too far, but will it be possible for Stocko to monitor and publish on a daily basis for subscribers the companies which make these RNS announcements containing the magic words? Otherwise, if I have to review all RNSs every day, I don’t have time to do it and simply won’t be able to take advantage of these findings.
Derek
Hey Ed,
The climbing EPS analysts estimates curve is a key feature of my screening process and I'm looking for FY1 & FY2 estimates to be climbing. This combined with high QM screening and some balance sheet checks are key items of my screen(s).
Might I suggest a good starting point would be ...
1) EPS Upgrade Streak values >= 1.
Stockopedia helps says "The EPS Upgrade Streak shows how many consecutive quarters over the last 15 months (5 quarters) have seen estimate upgrades for the company.
Rationale: Analysts (who are often slow to adjust up growth figures) are, on average, revising up the companies estimates.
2) EPS Surprise Latest >= 0
Stockopedia help says "EPS Surprise %, Last Interim, shows what the percentage EPS surprise was against the last interim report. If a company releases a number higher or lower than the consensus (a combination of all the released estimates), this is known respectively as a positive or negative surprise."
Rationale: I want to avoid companies that produced a negative surprise last quarter regardless of how rosy things look in terms of expected EPS estimates
Additonally I'd like to include No of EPS downgrades = 0 but as yet I'm unsure how this field works. I have a feeling it might be set to 1 if an analyst marks down the EPS estimate even if the average EPS estimate increases. If that is the case I'm not sure how useful it is. Maybe if the 1m EPS for FY2 has increased (analysts consensus estimate is up) but I have 1 downgrade to the 1m FY2 EPS I can be assurred that whilst 1 analyst has revised down the estmates the consensus of the rest of the analysts marked the estmate up? I'd appreciate some clarification on this field though.
Best of luck
Phil
Hi Phil. I have been using the Stockopedia EPS upgrade streak for years and would like to clarify & illuminate exactly how I believe it works. This is because a lot of people (though probably not you) may fail to understand it properly. 1) Any positive number for the upgrade streak means that there must have been an upgrade in the most recent quarter. So if there were 4 upgrades in the last 15 months, but none in the last quarter, then there is no longer any upgrade streak and the screen defines the upgrade streak as being zero. 2) The upgrades in question are only for FY1. FY2 is not involved. Unfortunately the information & help screens on here do not make these matters clear. I came to the above two conclusions by setting up a number of screens for upgrade streaks and then examining the history of the upgrades for the companies which the screens found.
Ed,
Am I right is thinking that about 50% of all announcements could not be classified, and if so that about 2.2% of all RNSs were therefore "significantly ahead"?
If a trading statement states profits will be slightly ahead or at the top end of consensus, do you consider these as ahead or inline. Also are you just looking at trading statements for these comments, or do you look at interim and final reports as well. Finally have you looked into earnings surprises at all, as Stockopedia does calculate these figures- can you see this ahead of expectations reflected in these figures?
Just trading statements at the moment. Will pick up results news analysis as results season starts. Many of the same phrases are repeated in results.
Slightly ahead would be "ahead". Top end would be "inline".
Re. Earnings surprises - lots to dig into there, but no we haven't done a research project on it yet.
Duplicate for some reason.
Great article as usual.
The obvious question is whether Audioboom with a stock rank of 31 is worth investing in. I suspect that the PEAD effect equally applies, although i would be very reluctant to buy that company.
I have it on my watchlist, Michael Taylor had it as one of his stocks for the year in Shares magazine a couple of weeks ago.
Audioboom (LON:BOOM) Sorry, that should have been Moneyweek mag on the 10th Jan
Thanks Ed, great article. This theme is also covered brilliantly in John Minervini's book 'Trade Like a Stockmarket Wizard'. Don't be put off by the title, it's the best book on trading and investment I've read to date.
One question Ed - "It’s startling how much higher the performance is for companies that announce sequential “ahead” announcements. If a company reports it is “ahead” of expectations (or better) and has a 5% jump on the day, the average return is 12% over the next 12 months. But those stocks that go on to announce another “ahead” announcement return an average 39% over the next 12 months, with some more than quadrupling!"
Is the 'next 12 months' taking the same starting point for both groups (those with and without a follow on) or in the follow on group measuring from the point of the second ahead announcement? Just to be crystal clear.
cheers
Jonny
@PastPerformance - yes Minervini is an inspiration. And the USA has amazing growth stocks that benefit from PEAD. He's the master at finding them.
Yes - it's the same starting point for both sets of stocks - the close price at the end of the original announcement day.
Is John minervini related to Mark? ;)
They sure do love some cheesey titles over there don't they. Absolute gold tho.
Made me laugh. They do love their acronyms too
Thanks for another brilliant article on this Ed.
Just as buying on better then expected updates often works very well, so the opposite applies too. I.e sell on the first profits warning even if, as with Shoe Zone (LON:SHOE) it’s only a very mild one. That mild profits warnings was followed by 3 more last year and the share price collapsed.
Below is a paste of a post I did on December 18th last year on the Daily Stock Market Report thread, after a further Shoe Zone (LON:SHOE) profits warning. Selling onthat first mid warning meant escaping ahead of the later share price dropping warnings.
Selling on that first warning also means avoiding the point where the share price fall can get so extreme that those still holding can reach the stage of wondering whether it’s too late to sell.
It’s SO much better having got out ahead of the big share price falls after the first mild warning and then, instead of wondering whether it’s too late to sell, instead to be in a position to buy again having missed those falls, on the first hints in an update that better times are ahead.
Here’s that Shoe Zone (LON:SHOE) post:-
“Selling is so much easier with the tactic I’ve used for the last few years. It’s simple. SELL on the first hints of bad news ahead and certainly even on what looks a mild profits warning.
If using that tactic with Shoe Zone (LON:SHOE) investors would have sold in March on the day of their first profits warning. Far better selling then around £2.60 than still to be holding today at just 88p?
The share needs to triple now to get back to the price when SHOE investors had such an obvious chance to escape (possibly still at a profit then) at 260p.
Using this simple sell tactic works far more often than not.
Far better to sell and look for alternatives and sometimes with a record of “better than expected” updates.? Again seems obvious surely? Likely to do better than a share sold on the first profits warning still being held even after several profits warnings?
Here’s the section from Paul Scott’s write up in March listing the reasons for profits being marginally below expectations. Not just one hint of trouble ahead, but 4!
“At this stage of our financial year, trading is marginally below expectations, due to -
a higher than expected increase in the National Living Wage,
an increase in container costs due to the ongoing situation in the Suez Canal,
higher costs associated with upgrading our property portfolio and
the impact of a slower than expected end to our Autumn/Winter season."
6216 RepliesReply
@Ken - yes your instincts completely align with the findings of our profit warnings research!
This is a great article, with direct application to improving our investing approach. It's for this sort of insight that I subscribe to Stockopedia - thanks Ed!
Thank you, Pete and Pippasfan too!
Ive just had to read this twice,,brilliant stuff
Any thoughts on Stockrank changes? ie. those stocks that have seen the greatest positive change in rank in the past 1 month or 1 quarter, and their subsequent performance over the following month or quarter.
I haven't completed my project on StockRank jumps - but the early read was inconclusive at best. I will get back to it at some point,