The FTSE isn't as strong as you think and you aren't doing as badly

It's been a pretty brutal twelve months for everyone investing in stock markets - not only here, but all around the world. But one area of optimism has been the performance of the UK broader benchmark - the FTSE All Share.
According to my measurement, the FTSE All Share has fallen by 6.2% over the last 12 months since October 4th. Given the index has yielded 2.77% over that timeframe, it's been pretty robust in what have been very difficult markets.
But most of us are down 20%+ in this timeframe. Some subscribers have written in who have constructed their portfolios using 80+ ranked stocks and asked why the they are underperforming the FTSE so badly.
It's a good question... but are we really underperforming?
Value Weighting vs Equal Weighting
One of the most vital things to get your head around when assessing an index's performance is *how the positions are weighted*. This has a huge impact on the reported returns.
* Value Weighting - often called "market capitalisation weighting" - is weighting each position relative to the total value of the company's shares (market capitalisation). In this way Shell (at £161bn market cap) will we weighted almost 12,000 times larger in the index versus Made.com (£13.7m market cap).
* Equal Weighting - this is the process of weighting each position in exactly the same size. So Shell and Made.com would have the same weights.
Most benchmark indexes use Value Weights (Market Cap Weights) for their construction. There are huge benefits to doing so as it's so much cheaper for product providers (like Vanguard, iShares etc) to build investment products around them. In a value-weighted index fund, once a position is bought, it doesn't need traded again. It's buy and hold forever, or until a stock leaves the index. Equal weighting on the other hand requires regular rebalancing of position sizes, so is more expensive to operate.
The equal weighted performance of the FTSE All Share
One useful feature on the site is the 'simulation charts' that we provide on watchlists. These create an equal weighted portfolio of shares from all watchlist constituents 12 months ago and track the performance forwards. It provides a quick measure of the difference between equal and value weighting below.
I created one quickly by copying in all the FTSE All Share constituents. In the chart below you can see the official 'value weighted' FTSE all Share performance in grey, but the 'equal weighted' FTSE All Share performance in blue.
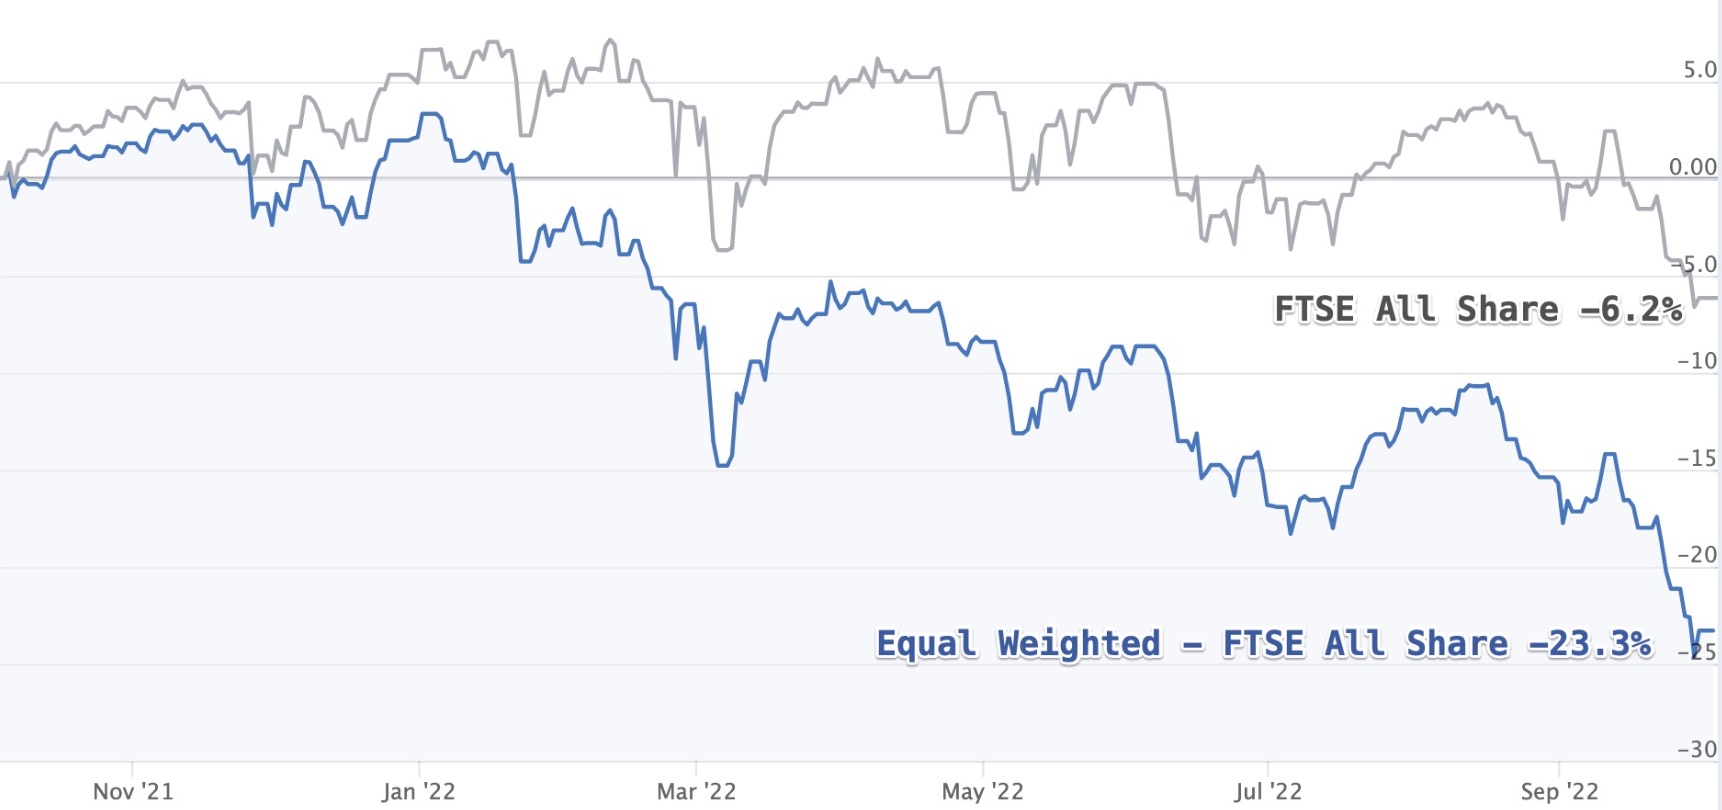
The equal weighted FTSE All Share has declined 23.3% in the last year, versus a value weighted decline of 6.2%.
Why such a difference?
Well the performance of a market cap weighted index is due to the handful of giant stocks that dominate it. Of the top 20 stocks by size in the FTSE All Share - 15 have risen in price in the last year, and only 5 have declined. The resilience of the index has been driven by the dominance of large cap, value stocks in the index. It's been a great time for large cap value stocks.
But the average stock is down 23.3% in this index. If we looked at the FTSE AIM All Share, I'm sure we'd see the average stock down far, far more.
Comparing the StockRanks performance vs FTSE All Share
The StockRank performance histories that we provide in the Learn > StockRanks section are also based on equal weighted performance tracking, not value weighted. So we can compare the 80+ StockRank set of shares over the same 12 month period (using annual rebalancing) and see a similar story.
While the 80-100 ranked stocks have underperformed the value weighted index, they have actually outperformed the equal weighted FTSE All Share by about 2%.

Key takeaway
The performance of the FTSE has been driven by a handful of large cap value stocks - but the average stock has suffered a lot of pain. This is masked by the market cap weighting of the index. If we unwrap the index as an equal weighted portfolio, it's far more comparable with typical private investor portfolios. The StockRanks have held up well against the equal weighted FTSE All Share - especially given they include AIM stocks which have been even harder hit than main list stocks.
Large cap value has been the very best strategy in the market in the last 12 months - and given the market predicament this may continue until there's an intervention or the regime changes. I've long argued that every investor should keep some large cap value spine in their portfolio, but given most private investors equal weight their portfolios it's unlikely many of us are seeing FTSE All Share type returns.
My expectation is that at some point we'll see a bottom in these markets - when that happens I won't predict, but the market itself will tell us. When markets bottom after a bear market, the stocks that recover fastest are almost always the beaten down small cap value stocks. That's not to say these kinds of stocks have bottomed yet, but when they do, they will be the first to bounce back. In coming weeks we'll publish some more articles about positioning a portfolio for a recovery.
Disclaimer
This is not financial advice. Our content is intended to be used and must be used for information and education purposes only. Please read our disclaimer and terms and conditions to understand our obligations.

13 comments
Indeed Ed, bruality is a relative score and there are very few big names propping indices up not least the oil majors
Here's a plot of relative performance based on price 3M vs YTD
AIM is in the very low left while the FTSE 100 is outperforming every major index YTD (though Japan is catching up with their unconventioal monetary policy)
: Shell (LON:SHEL) and £BP. now make up 13% of the index by cap
Mind you , when you add 2 and 10 year UK gilt yields into the relative performance plot the statement of the problem becomes clearer: especially the Trussonomic moves over the past week
I also track market breadth both on 52W and all-time highs and lows; this is a measure of the number of shares making new highs to new lows and is useful in showing the overall health of the internals and how fewer stocks are propping up the overall indices.
last Thursday we did see a major sell-off and a spike down in ATLs - likely capitulation selling.
There's a strong correlation to ATLs and levels of debt ( corrected for sector capital peculiarities ): probably not unsurprising given rate hikes and where we are in the business cycle.
This is the ATH/ATL plot expanded - peaks and troughs tend to align with market maxima and minima .
I'm a data viz wonk and post stuff like this on Twitter - @runningprofits https://twitter.com/runningpro...
A very helpful article - I like many others compare my performance with the FTSE All Share Index and I have been down on a relative basis by 6 or 7% all year despite holding over 30% cash - which I think is my worst ever performance. Nice to get a clear explanation. Hopefully, 2023 will be much better. I've written this year off as a no hoper as we haven't bottomed out yet. Markets tend to recover from a confirmed recession and when things reach bottom. That looks 3-6m off to me.
Bear markets don't last forever; a bottom will come. I suspect it will be when the Ukraine war ends or when energy sanctions on Russia are lifted, most probably the latter - US will keep sanctions on even after the war, but EU will be a different story. Without cheap Russian gas - who can afford US LNG at three times the price - the EU simply can't function. With ten percent reduction in energy use, EU gas will run out in Feb; at twenty percent it will last until March. Not to mention the fertiliser shortage sanctions, which is another ticking time bomb. I think the EU will capitulate on sanctions sooner rather later, they don't have any choice. Its fine for the US they are energy independent, though not immune to global energy market prices.
Bear market's still in the early days, but there will be bear market rallies as its looks we are in now, which will make some believe the bear market is over. I would rather play it safe and stay in cash, or follow the money and only trade in oil and gas stocks(with strong cash balances and increasing EPS growth) or particular mining stocks. I'm up 33 percent overall this year so far, and expect to be up 50 percent plus by month's end or maybe two, so my strategy seems to be paying off . Max drawdown/loss per trade is less than 5 percent - I see drawdown and loss as the same thing - a loss is loss whatever you want to call it.
This cuts both ways though, NAPs etc and the top Stock ranking shares have not done so badly, this year, compared to an equal weighted index, but the previous years won't have outperformed so well either, because the largest UK companies have hardly grown in the last 10 years, but that does not include dividends, some such as £BP and £Shel used to pay around 6%, add that on and compound it up, will make quite a difference. My NAPs was down 25% last week, has recovered slightly since, my NAPs is different from Ed's selection.
Yes 100% right. I would imagine an equal weighted FTSE All Share wouldn't be far from the performance of 60 ranked shares.
So somewhere like that vs the ranks.
Ed, would it be possible to add the FTSE 250 Index ( MCX ) to benchmark choices, I feel that would be closer to my folios than the FTSE 100 and Allshare indexes.
In the U.S the S&P 500/400/600 and Nasdaq 100 are also Mcap weighted but the DJIA is price weighted.
three FT30 as well
I use the FTSE All Share Index as my benchmark and it is making me look like an idiot this year! But hey at least it keeps me humble!
On another point @Edward Croft how are subscriber numbers holding up? Have many people given up and left the platform?
Great article. London Market seems cheap and US still expensive. Not sure whether a fall in Wall Street will affect London that much.
That was a very helpful analysis Ed. I have always been attracted to the index investing and factor/stock rank investing styles, mainly because I'm lazy, and divide my invetsments ~equally between the two . I was wondering why the factor/stock rank portfolio was doing worse, so thanks for explaining.
Are there any generally available indices which are equal weighted which subscribers might want to use as their benchmark?
Unfortunately it doesn't seem like there are any in general use. There does seem to be a FTSE 100 Equal Weight Index. And an ETF that tracks it with the symbol XFEW. I can't seem to find any data on it, aside from the factsheet here - https://www.ftserussell.com/an...
It does show some significant performance divergences over 5 years.