The Hump and the Bowl - understanding the patterns of Momentum

The stock market can be a wild place. Prices swing far more than they “should”, and that excess volatility has baffled academics for decades, and my portfolio for the last week.
If you’re serious about investing, you have to understand how prices really behave. Price movements can be quite random, but they do often repeat in patterns - and some of the most powerful are the patterns of momentum.
In simple terms, momentum is the idea that winners keep winning and losers keep losing. But as we’re hard-wired to seek bargains, we normally reject the idea completely. That’s a mistake.
Momentum is the most powerful return driver of all - and completely beats value investing across most timeframes. But there are some nuances to how momentum behaves across timeframes, which can trip you up if you don’t know they exist.
So let’s dive into some details.
Phase 1: Short-Term Reversals (1 week to 1 month)
In the short term, prices tend to reverse.
A share that’s surged for a few weeks will often pull back, while one that’s fallen too far tends to bounce. This is called the short-term reversal effect. It’s especially common in choppy markets, and it can be very frustrating.
Yesterday, we saw a really nasty reversal in the gold and silver prices after a very strong recent run, and all the precious metal mining stocks fell 10% in tandem.
Prices often pull right back to stop-loss levels, so you can end up selling at trend lows, only to see the share whip back up again without you. Or you might think you’ve timed a breakout to perfection - only to see it stall. Deeply frustrating, but so often expected.
But, there is an exception to this rule.
When a company releases genuinely new, material news - say an “ahead of expectations” trading statement or a transformational contract - like Goodwin (LON:GDWN) recently or Filtronic (LON:FTC) after its SpaceX contract last year - the price often jumps and keeps drifting in the same direction.
These aren’t liquidity or sentiment-driven moves, they’re the market digesting new information. The former often reverse, while the latter often spark new trends.
That’s why staying on top of news matters. It’s often the trigger that flips a stock from short-term moves into the next phase - mid-range momentum.
Phase 2. Mid-Range Momentum (6–12 months)
This is where the real magic happens.
The shares that have risen the most over the past 6 months to one year tend to keep rising (while the losers keep on losing). But this effect fades after a year to 18 months - which is what I call the “momentum hump”. The chart below is a good summary from an old classic momentum research paper:
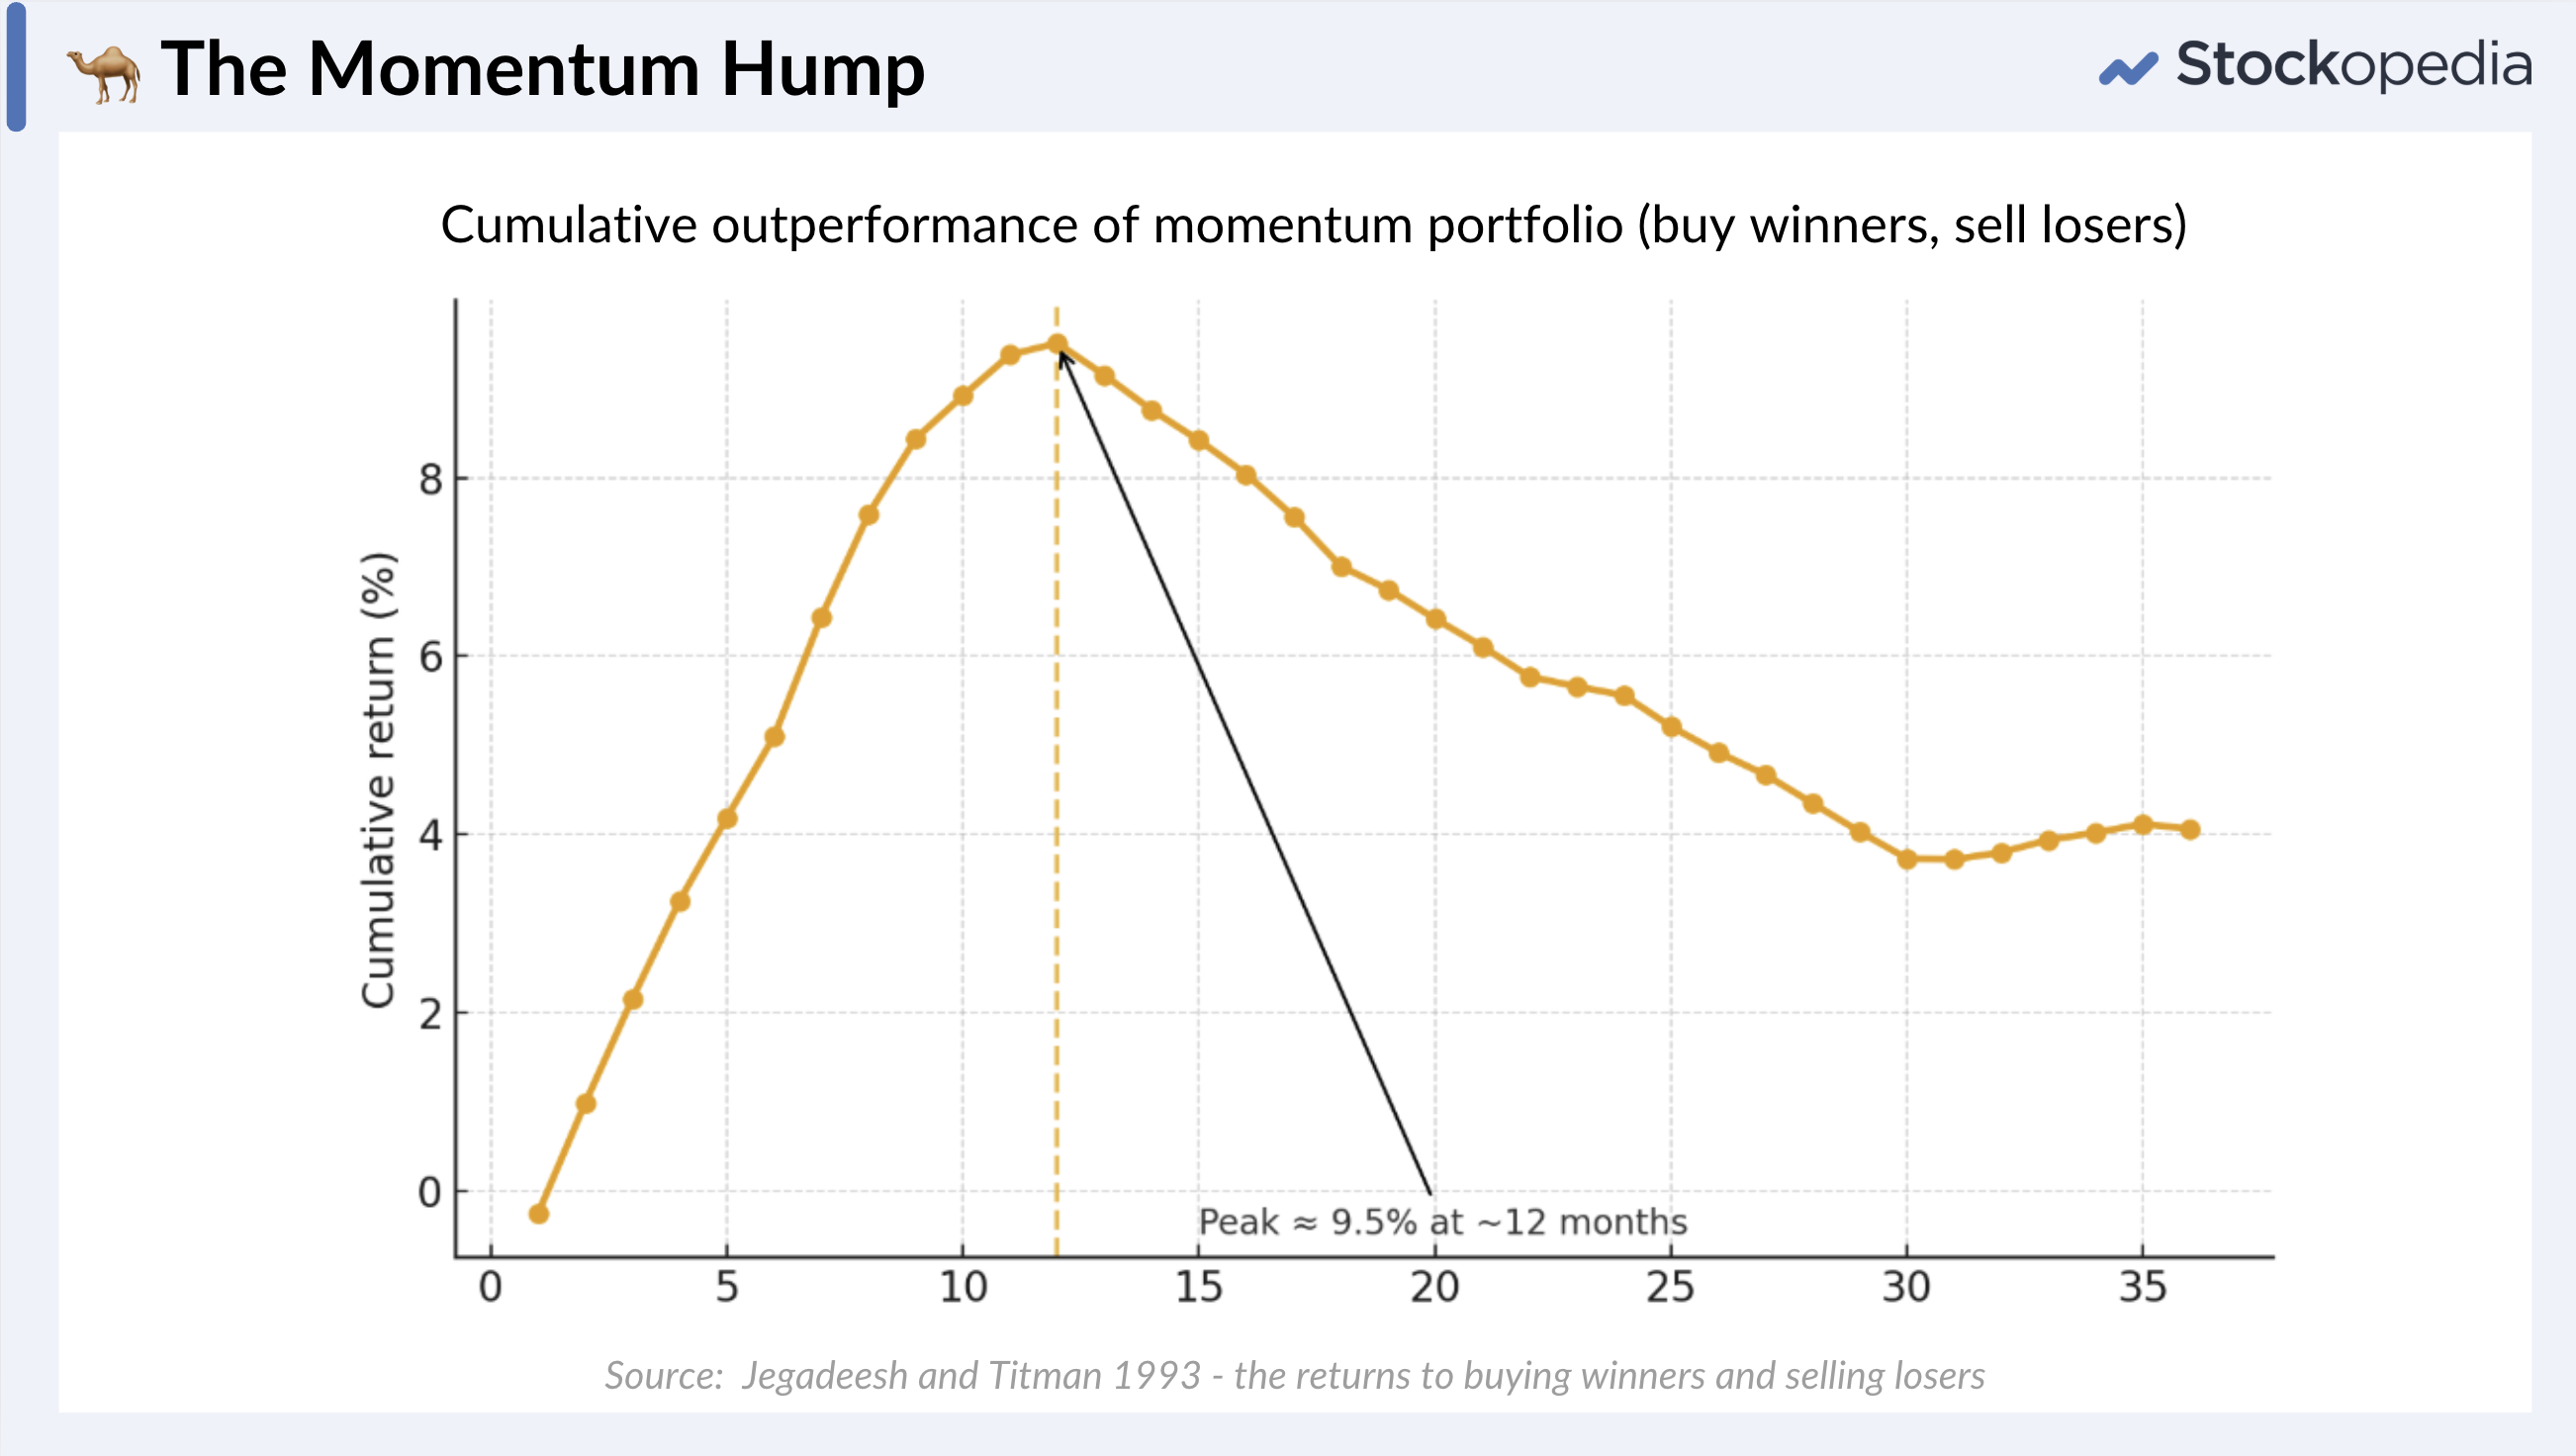
I’ve long thought that this momentum effect is a bit like fashion - it lasts for a season, then goes out of fashion. The 12 month holding timeframe is a sweet spot for momentum, and one reason why the maxim “run your winners” actually works.
And yet, this is the bit most private investors can’t stomach. Buying stocks at new highs feels uncomfortable. But this is where the data is really clear - we have to learn to act against our discomfort, and not take profits too early!
Why does it work? Well, at first, investors under-react to new information - for example to a series of “significantly ahead of expectations” announcements - so prices haven’t moved enough in the first six months. But after time, as awareness catches up, investors over-react, a band-wagon effect takes hold, and valuations get pushed too far.
Phase 3. Long-Term Reversal (3–5 Years)
Here’s where things get counterintuitive again.
Over three to five years, the pattern flips. If you sort the market by worst five-year performance, the biggest losers tend to outperform. To be clear - not the one-year losers that so many search for - avoid those like the plague - but the three-to-five-year losers.
These stocks are often deeply ignored and undervalued. When conditions turn, they can sometimes rebound powerfully. That’s why value investors love this part of the curve - the long-term loser bucket is fertile ground for stock picking cheap, oversold shares.
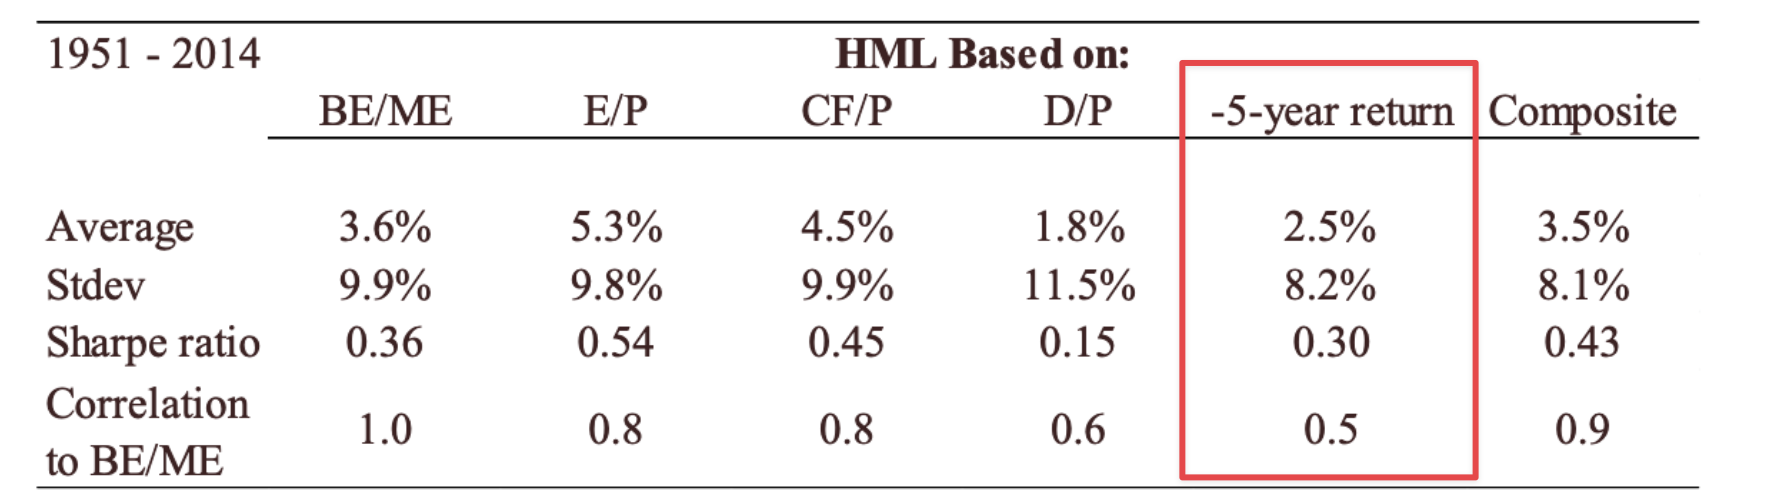
Cliff Asness in his excellent “Fact, Fiction and Value Investing” paper showed that the “worst 5 year losers” actually outperformed the highest dividend yielding shares (D/P in the graphic below).
Look for “bowls” to bring it all together
If you can spot a long-term loser that suddenly experiences a catalyst - an earnings surprise, a restructuring or new management - you might just be at the start of a powerful new trend.
There’s a moment where all these powers can intersect:
- Long-term loser (5 year loser turns a corner)
- Short-term surprises (good news)
- Mid-term momentum (6m-1y strength)
At this point, you might see the long term chart carve out a “bowl”, as Cockney Rebel called it. Stan Weinstein and Jesse Stine have both written brilliantly about the same pattern: when a share transitions from long-term neglect into fresh momentum.
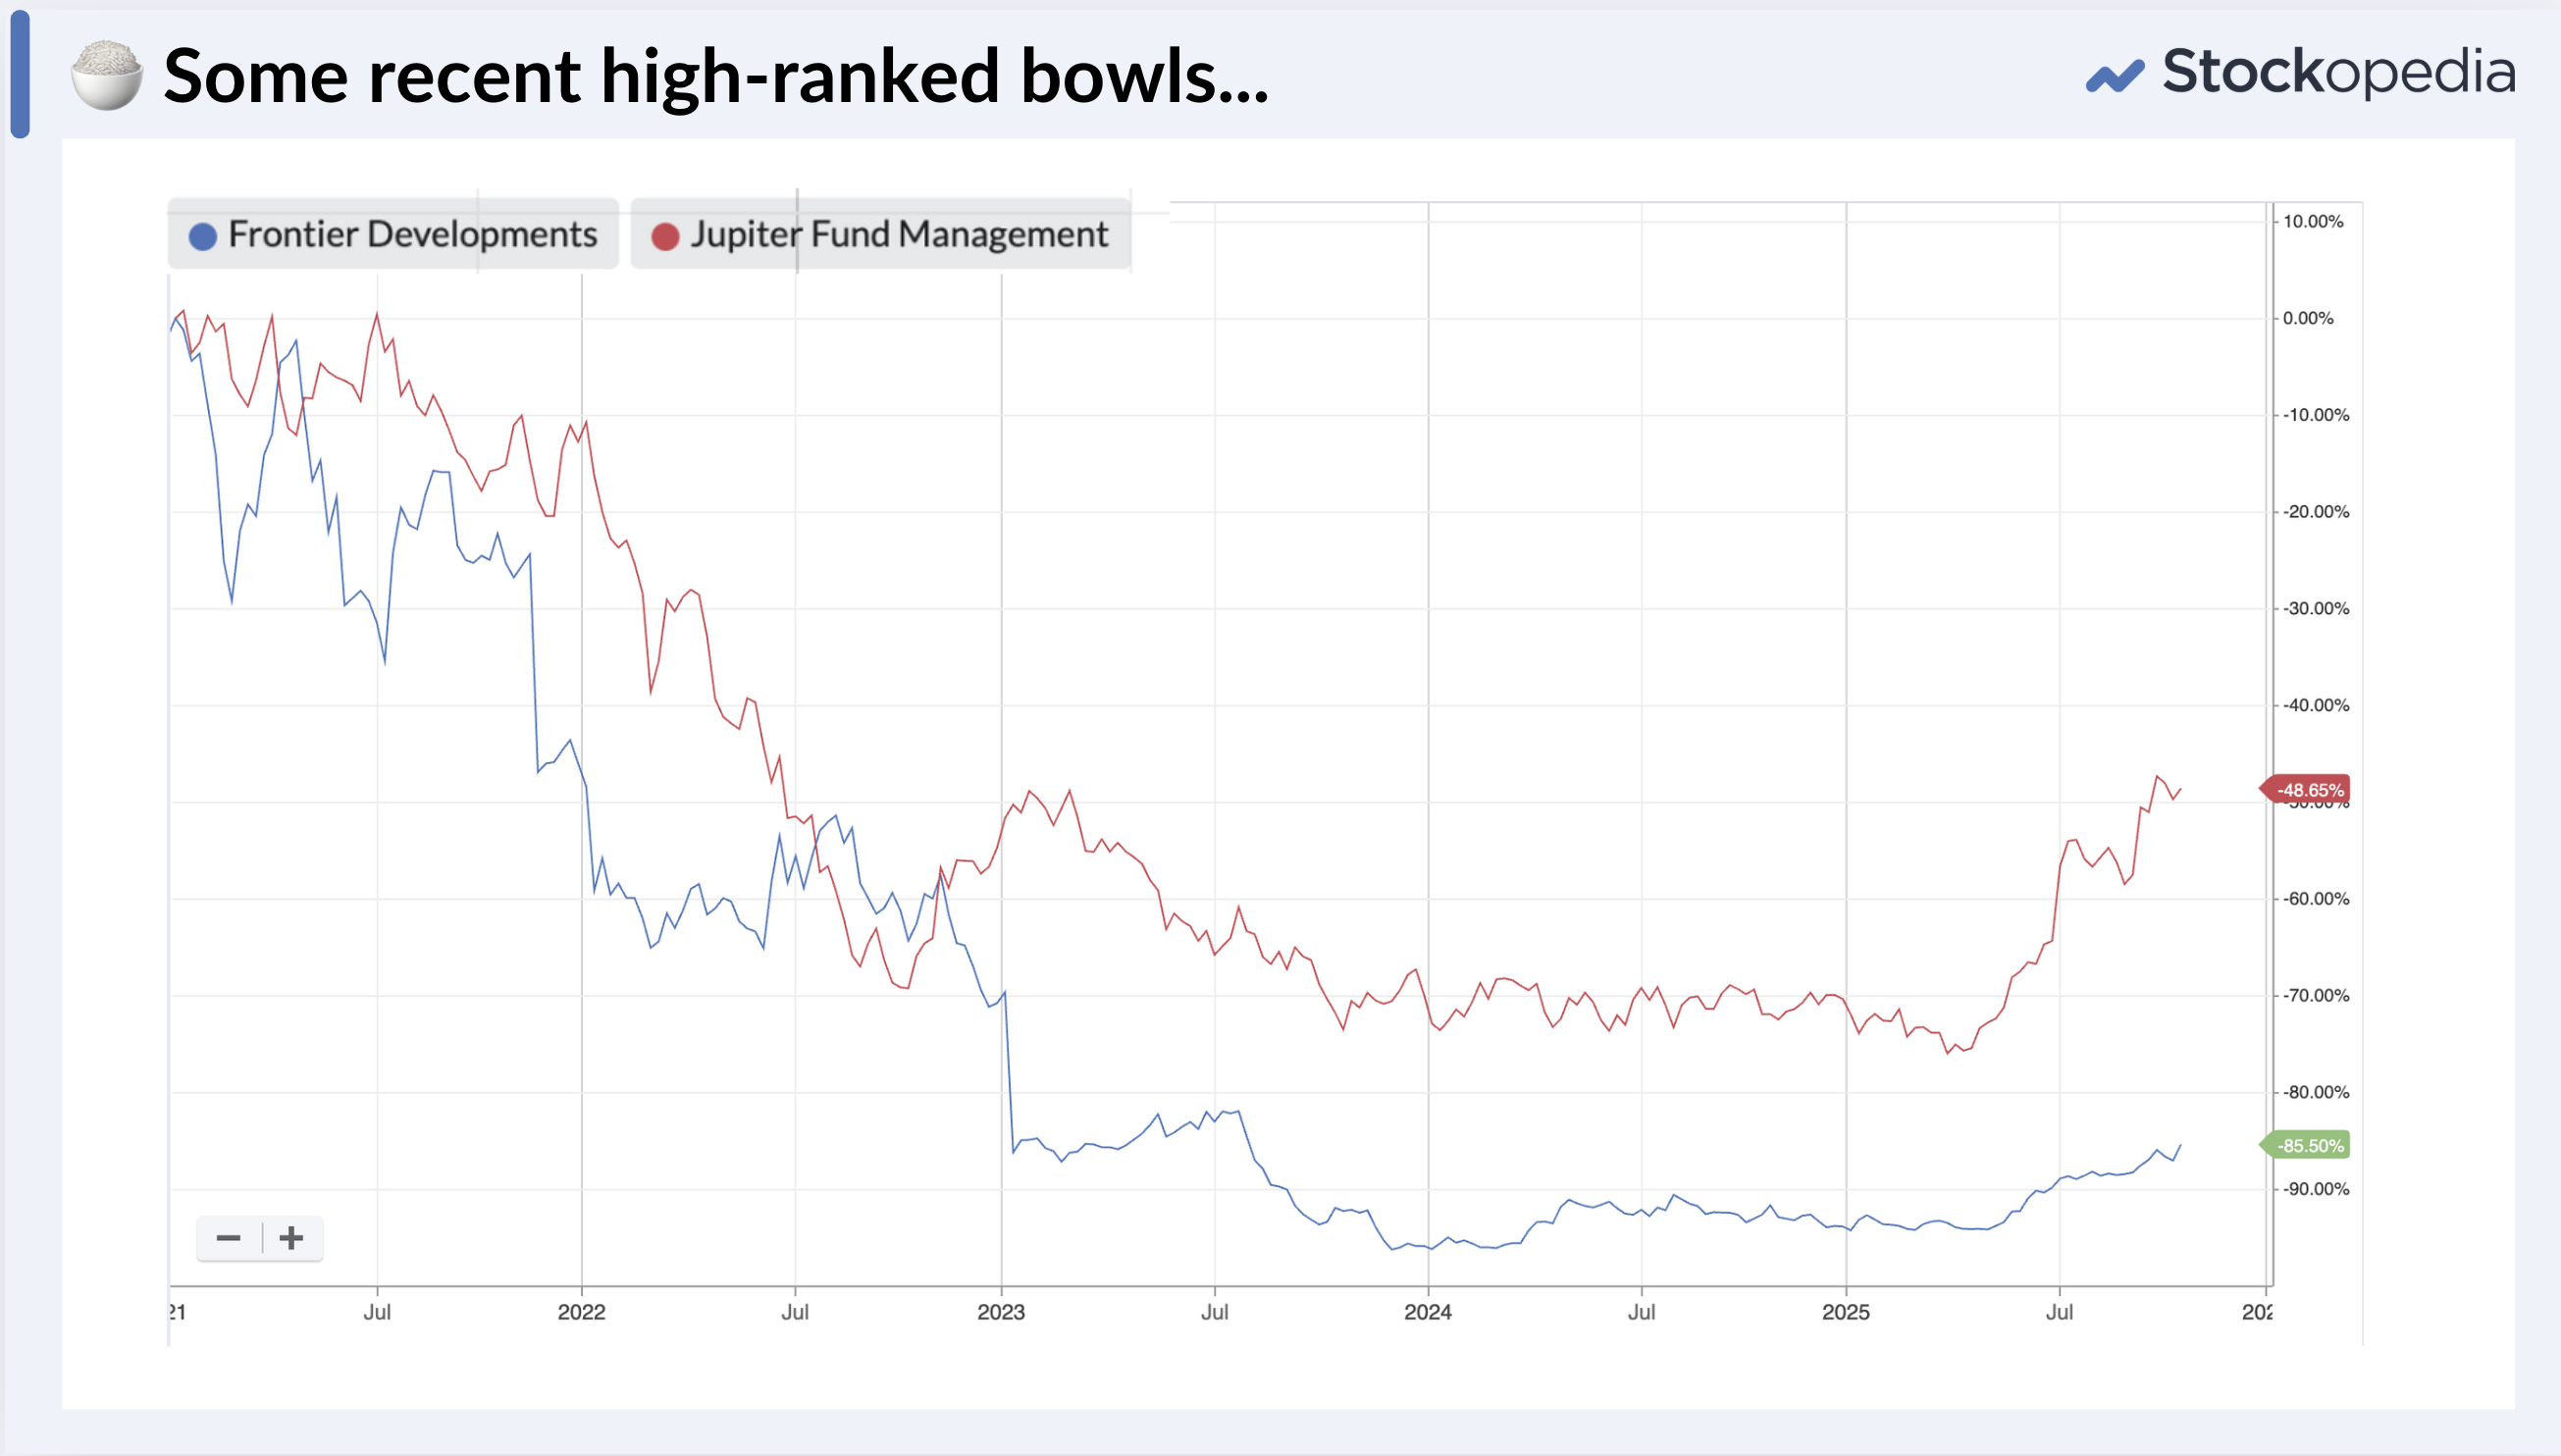
Next week Mark will be doing some screening to find shares showing bowls in their charts, but just a couple that caught my eye in the last 6 months included Frontier Developments and Jupiter Asset Management. Their 1-year charts are terrifying, but on a long term view, less so.
The takeaway
Momentum isn’t a theory - it’s one of the most proven return drivers in markets, with reams of academic research behind it. And as a private investor, you really can take advantage of it. Much momentum is driven by large institutions that are accumulating shares over days and weeks. They can’t take advantage of momentum due to their size, but we can learn to benefit and surf these moves.
So keep mining the market for these kinds of shares. Watch for catalytic jumps on news announcements. Run your winners for a season, and cut your losers. But most of all learn to embrace the discomfort that accompanies buying shares at new highs!
If you’d like to learn more on this topic - tomorrow we’re doing a webinar with Phil Hoffer who has returned 17% annualised for the last 12 years, at a 656% return. He has mastered the art of buying high - it will be a great session and you can sign up here.
Disclaimer
This is not financial advice. Our content is intended to be used and must be used for information and education purposes only. Please read our disclaimer and terms and conditions to understand our obligations.

17 comments
Good post Ed, I'm guessing on a weekly chart this would end up occasionally forming a sort of 'cup and saucer' style setup on the weekly charts, similar to that used by William O'Neil. Something I look out for in conjunction with certain stock ranks. This must resonate closely as I also have both Frontier and Jupiter in my SIPP this year.
Excellent Quality + Momentum Video with Ed and Phil last night. Can Phil or Stocko post a link to Phils screen metrics please, so I can duplicate?
Hi Ed, fantastic insight into momentum and backs up my confidence in JUP - Unsure whether this is a feature already but saving key articles could be a nice addition making it easier to revisit key insights from the Stocko team.
Thanks
I 2nd this, it would be a great idea to be able to save certain articles
You can always bookmark / save them to your "favourites" in whatever browser you use
That's a good idea...many thanks, I hadn't thought of that
The Hoffer links sent by email are not highlighted Ed.
Will the Hoffer webinar be recorded? I dont live in the European timezone?
Yes it will be - it should be interesting watching!
Frontier Developments (LON:FDEV) is another case in point because it exhibits several momentum anomalies:
But and this is a big but, in a troubled market Frontier Developments (LON:FDEV) is up +11% in the last 2 days since the launch of its new computer game Jurassic World Evolution 3 (JWE3) on 21st Oct. Sales of previous JWE versions 1 and 2 both achieved 1M units in their 1st year and the new JWE3 version is £50 a pop. Goggle JWE 3 magazine and user reviews and see if you can estimate what the new version will contribute in £sales this year?
Add to this a StockRank of 97 and Frontier Developments (LON:FDEV) like its new game is an “evolving” opportunity. To quote Ed: “In a world of thin research coverage and biased forecasts, we need better rules of thumb. And the StockRanks do seem, by design, to be a good proxy for discovering unexpected earnings growth”.
So on a number of counts and if the positive game reviews are representative of future sales we could be in for Frontier Developments (LON:FDEV) substantive earnings growth and broker upgrades. I hold.
Worth mentioning the Frontier Developments (LON:FDEV) appears in Phils video in his Quality/Momentum portfolio, as one of the few UK shares that passed his very strict screening criteria. The QM Rank today is 99.
Interesting as this agrees with William O'Neil's momentum approach. He advocates using basic fundamentals but with strict rules to only buy rising stocks that are forming a 'cup & handle with vol' in rising sectors & only when the market itself is rising. Followed by very strict rules on selling. It has to be said he has many very successful followers.
A calm reflective post in the aftermath of a sudden, deep reversal.
Thanks a lot Ed, great to read your thoughts supporting my own lack of knee jerk reaction to recent correction.
Thank you Ed. Given the powerful screening tools available, it would be interesting to create a standard screen for this.
Duckers, here's another related article that includes a screen (though my version of it throws up nothing I find interesting, mostly trending down!!!)
https://www.stockopedia.com/co...
Jon
Thank you Ed, all very helpful. My loser bucket leaks, I look forward to Mark's bowl graphs to pour some into those.