The power of consistency

When we think of successful investors, we often look for those who post outsized numbers; those who generate 30%, 40%, 50% or even higher returns in a single year. An investor who does that for a few years gets noticed. Others will assume that they have the Midas touch and start to follow their every move. However, this reputation rarely lasts an extended period of underperformance. I can think of many seemingly great investors whose records didn't stand the test of time, and they quietly exited stage left.
The problem is that when we look at other investors' short-term records, we rarely see the risks they took to get there. Successful investing is as much about avoiding the big down years as delivering the big up years. Let me demonstrate.
A tale of two portfolios
Here are two hypothetical sets of investment returns. Which would you want to own?
| Year | Portfolio A: Return | Portfolio B: Return |
|---|---|---|
1 |
64.8% |
35.2% |
2 |
−29.7% |
−8.8% |
3 |
86.6% |
45.3% |
4 |
−51.6% |
−18.9% |
5 |
43.0% |
25.0% |
6 |
35.7% |
21.6% |
7 |
−44.2% |
−15.5% |
8 |
79.4% |
41.9% |
9 |
13.9% |
11.5% |
10 |
−0.6% |
4.7% |
11 |
−22.6% |
−5.4% |
12 |
57.6% |
31.8% |
13 |
28.5% |
18.3% |
14 |
−58.8% |
−22.3% |
15 |
72.1% |
38.5% |
16 |
6.6% |
8.0% |
17 |
−37.0% |
−12.2% |
18 |
50.3% |
28.4% |
19 |
21.2% |
14.9% |
20 |
−15.2% |
−2.0% |
Average |
15.0% |
12.0% |
On the surface, it is a no-brainer. Portfolio A has the higher average return. There are a few years where they even generate 70%+ returns; this must be the work of an investment genius. Let's get them a podcast, or ask them to write for Stockopedia. OK, there are a few bad years, but no one does well in COVID or when there's an unexpected war, right? No guts, no glory?
Of course, most readers will have guessed it by now; I've gamed the system. Here are the actual returns these same sequences of annual returns would generate as a compound annual return (CAGR):
| Portfolio A: Return | Portfolio B: Return | |
|---|---|---|
Average |
15.0% |
12.0% |
CAGR |
5.0% |
10.0% |
Portfolio B generates twice the compound returns of Portfolio A. Over 20 years, that turns £100 into £673 against £265, a profit around three and a half times as large. Any rational investor would rather have owned Portfolio B. The chart makes it even clearer:
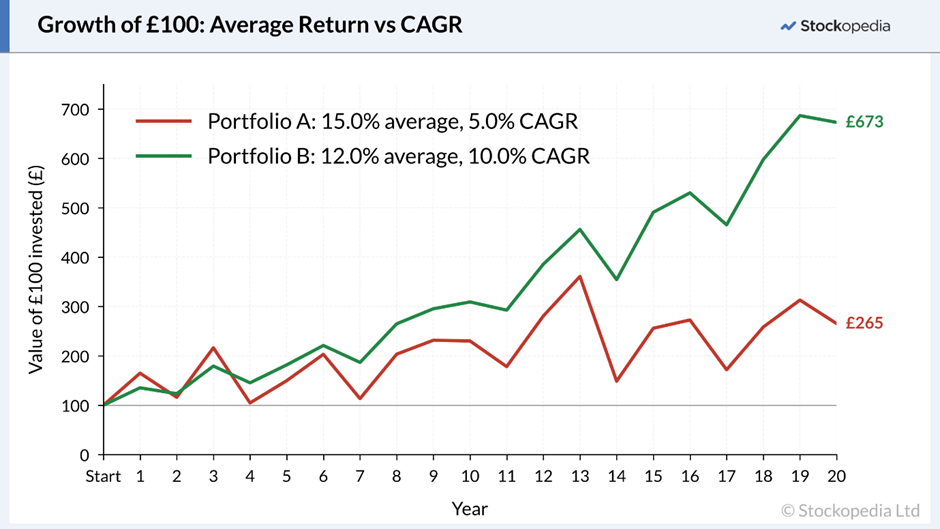
Both sets of returns are closely correlated, as you would expect from equity portfolios subject to wider market trends. However, by avoiding the very big drawdowns, Portfolio B leaves investors far better off.
Why does a 15% average shrink to a 5% compound return? Because losses and gains are not symmetrical. A portfolio that falls 20% needs a 25% gain to get back to where it started. One that falls 50% needs 100% to recover. Portfolio A's worst year, a 58.8% fall, needs a gain of 143% just to break even. The bigger the swings, the more of the average return is spent simply repairing the damage.
The same issue shows up in the time spent underwater. Portfolio A peaks at £361 in year 13 and, seven years later, is still 26% below that level. Portfolio B's worst fall is 22.3%, and it reaches a new high the very next year. The two portfolios have almost the same number of losing years, eight for A and seven for B. The difference is not how often they fall but how far.
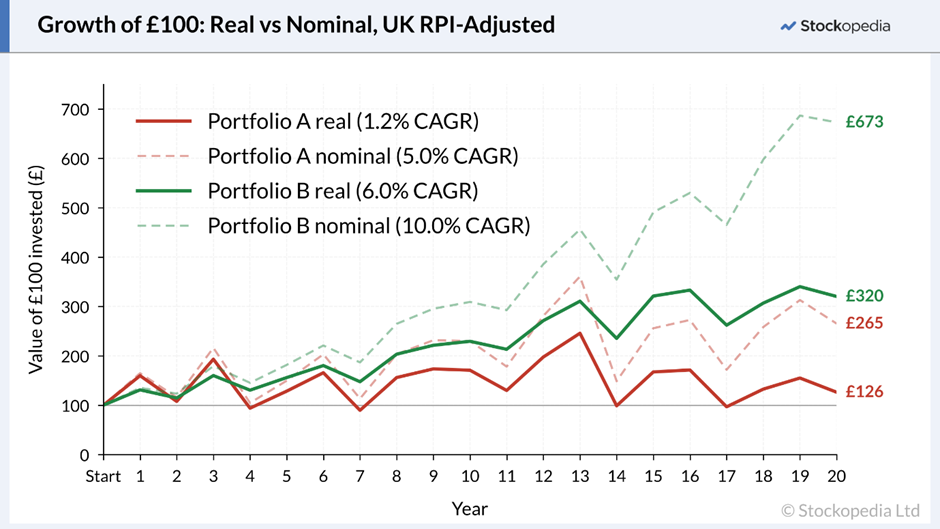
The difference is even starker if I adjust the returns for inflation, as modelled by the UK Retail Prices Index over the last 20 years. While these obviously remain entirely hypothetical portfolios, Portfolio A barely generated any real returns, while Portfolio B trebles an investor's purchasing power:
There is also a practical lesson here about position size. An investor who put only half their money into Portfolio A and kept the rest in cash earning 3%, rebalancing once a year, would have compounded at 6.6% a year and ended with £359, against 5.0% and £265 for someone fully invested in A. Their worst year would have been a 28% fall, not 59%. The same picks with smaller bets made more money.
The Sharpe end of investment returns
The idea that volatility matters is not new; it is a central tenet of academic finance. William F. Sharpe is a Nobel Prize-winning Stanford economist who proposed a simple way to judge fund managers: divide the return they earned by the volatility they took on to earn it. He called this the "reward-to-variability ratio," but the industry soon started calling it the Sharpe ratio. He later refined the definition so that it measures return above a risk-free benchmark, becoming:
Sharpe ratio = (Portfolio return − Risk-free rate) ÷ Standard deviation of portfolio returns
It tells you how much extra return you got for each unit of volatility you accepted. A higher ratio means you were paid more for the risk. On this measure, Portfolio B wins comfortably, even though the ratio uses mean rather than compound returns.
| Portfolio A | Portfolio B | |
|---|---|---|
Average annual return |
15.0% |
12.0% |
Volatility (std. dev.) |
46.0% |
21.4% |
Sharpe ratio (3% risk-free) |
0.26 |
0.42 |
Over the long term, UK broad market indices have had a Sharpe ratio of around 0.33, so Portfolio B beat the market and Portfolio A lagged it.
However, I have been critical of using the Sharpe ratio to compare the performance of individual investors' portfolios. One known limitation of the ratio is that it treats upside and downside swings the same, and many practitioners prefer more advanced ratios, such as the Sortino ratio, that take account of this (and use CAGR returns as well).
I am sympathetic to these concerns, but they don't capture my real issue with the ratio. My problem is that it measures how efficiently a return was earned, not how much wealth was created. Take another hypothetical portfolio, one with a low annual return of 5% but a very low volatility of just 1%:
| Portfolio A | Portfolio B | Portfolio C | |
|---|---|---|---|
Average annual return |
15.0% |
12.0% |
5.0% |
Volatility (std. dev.) |
46.0% |
21.4% |
1.0% |
Sharpe ratio (3% risk-free) |
0.26 |
0.42 |
2.00 |
Portfolio C has a phenomenal Sharpe ratio, almost eight times that of the underperforming Portfolio A. Many fund managers would kill to get such a high Sharpe ratio, and a downside-only measure would flatter it even more, as Portfolio C never has a losing year. Yet Portfolio C ends up in the same place as Portfolio A. It just gets there more smoothly:
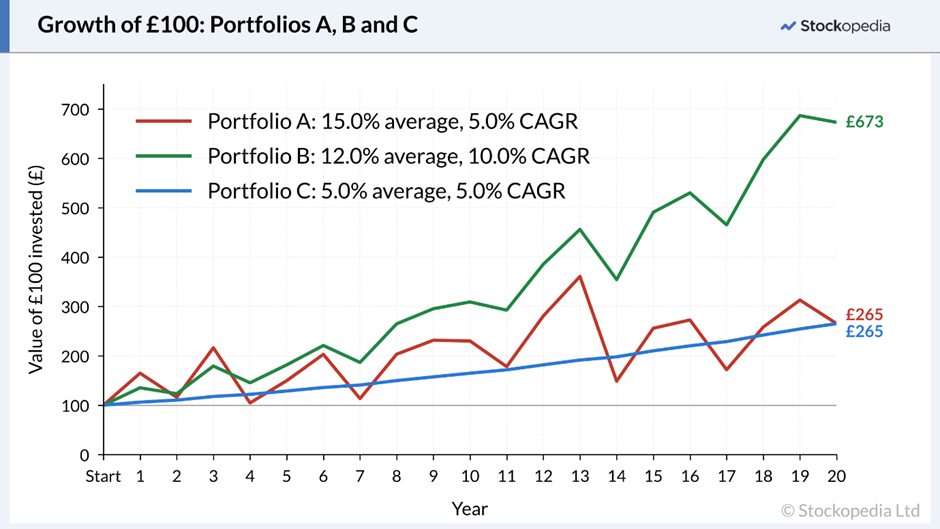
In theory, this doesn't matter, as you could leverage Portfolio C to generate the same returns as the broad stock market, or even higher, while still having lower return volatility.
In practice, few individual investors could gear up at the risk-free rate. Even if an individual investor can access leverage via spread bets or similar, would they really want to bet that they can keep delivering returns at very low volatility, and gear up to a level that wipes them out if the future looks different from the past?
The risk is not just theoretical. Long-Term Capital Management, a hedge fund whose partners included two Nobel laureates, applied heavy leverage to supposedly low-volatility strategies and had to be rescued in 1998 when markets stopped behaving as its models expected.
Nor is Portfolio C as safe as its volatility suggests. After adjusting for RPI inflation, it compounds at just 1.2% a year, and it loses purchasing power in years 17 and 18, when inflation ran well ahead of its returns. Low volatility is not the same as low risk.
Psychology
High volatility of returns doesn't just reduce wealth through the maths of compound returns; it can also lead investors to make suboptimal decisions. The typical investor has terrible market-timing instincts. They sell out or switch strategies at market nadirs, when extended losses lead to despondency. Then they go "all-in" at the top, carried by the enthusiasm that high market returns generate.
When managing your own portfolio, you should aim for the maximum compound return you can get. This requires consistency of performance, not just because big drawdowns tend to lead investors to make poor decisions, but because building real wealth demands it.
Building consistency
Stockopedia provides investors with many tools that help them build higher, more consistent returns. At the heart of many of them is the StockRank, which takes in the combination of a stock's Quality, Value, and Momentum characteristics and combines them into a single number. It may seem too simple to matter that much. However, the evidence suggests investors should take note.
Favour stocks with a high StockRank:
Stockopedia writers have found several reasons why owning high StockRank stocks can tip the odds in your favour:
High StockRanked companies tend to deliver more good news and less bad news:
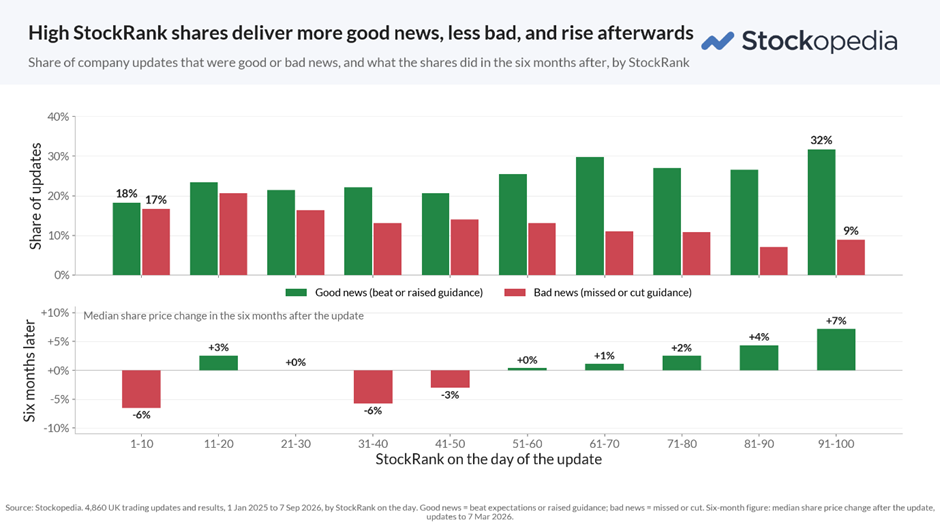
The market tends to reward good news and punish bad news.
High StockRanked companies tend to have the lowest forecast earnings growth and the fastest realised earnings growth:
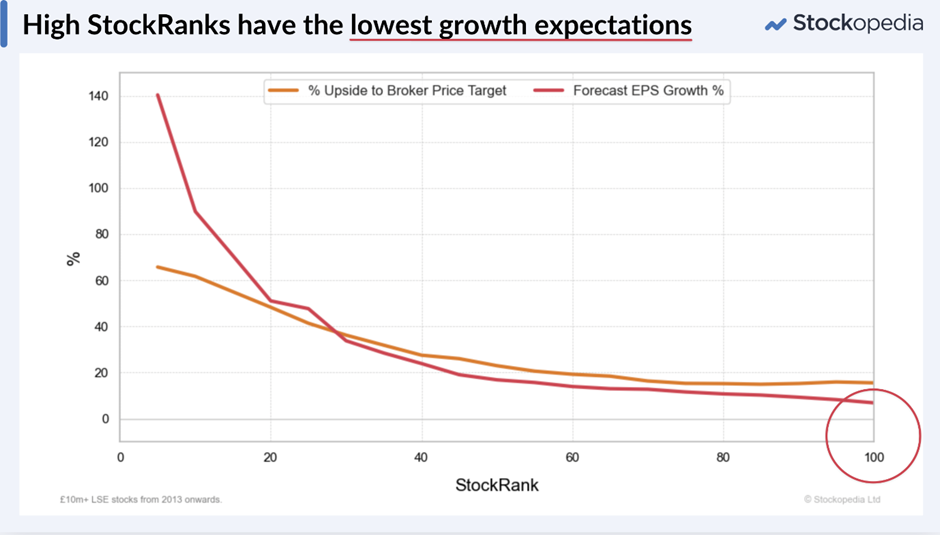
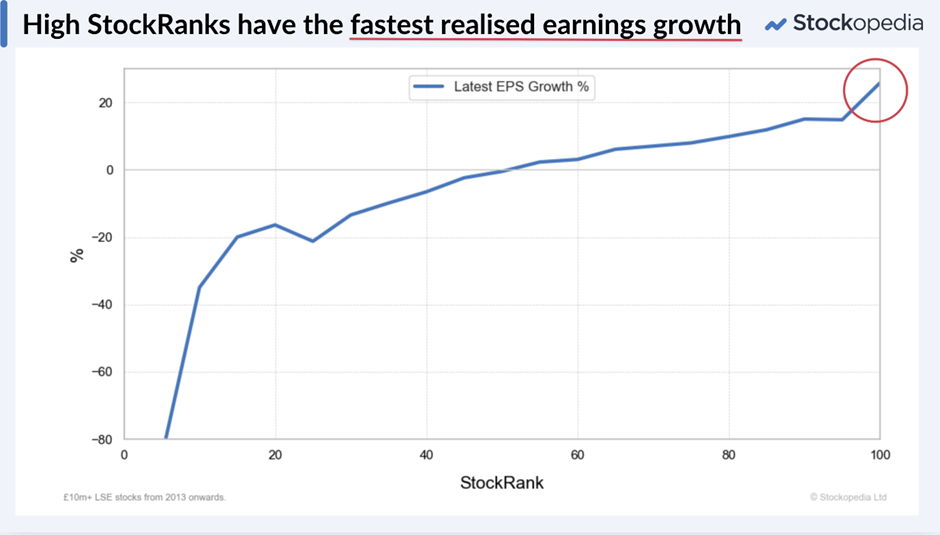
Many academic studies have shown that broker forecasts usually miss the mark, and nowhere is this more obvious than in this mismatch. This tendency generates positive earnings surprises that are rewarded by the market.
Avoid stocks with low individual ranks:
Many investors, including myself, are not pure quant investors and seek to enhance our returns through further research. We also tend to gravitate towards strategies that suit our personalities. For me, that is Value investing, buying stocks that are cheap on earnings or assets.
I often don't find high Momentum stocks particularly attractive, and I struggle to buy expensive-looking stocks purely because their price action is strong. However, that doesn't mean I should completely ignore the Momentum Rank. Our research shows that a portfolio of Quality Value picks with very low Momentum is likely to underperform a set of similar stocks with better Momentum characteristics:
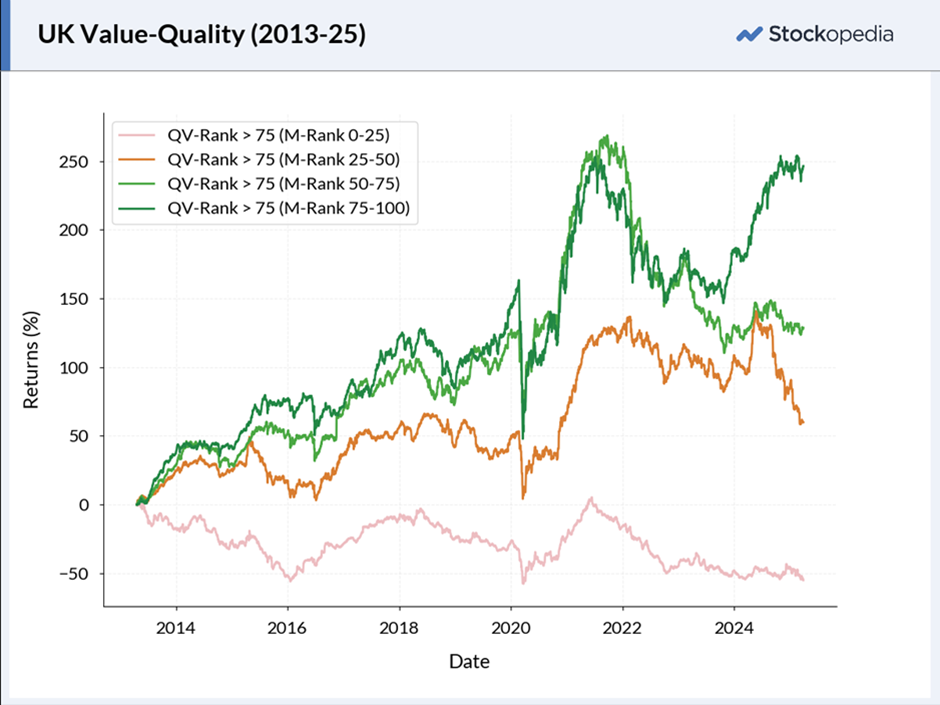
The evidence for investors in High Flyers (QM) avoiding low Value-ranked stocks, or Recovery (VM) investors avoiding low Quality-Ranked stocks, was less strong. However, a very low-ranked stock on any of the individual Q, V, or M measures should give investors pause.
Look for improving StockRanks:
Ed found that smaller companies that saw a one-week StockRank jump of between 20 and 40 points to become Super Stocks significantly outperformed the market:
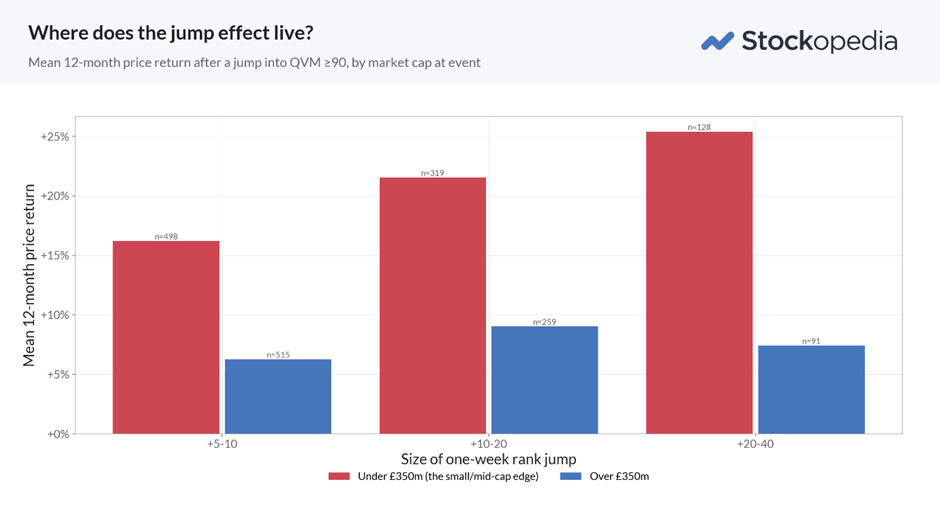
The evidence for avoiding stocks with falling StockRanks is less clear-cut. However, I found that a rapidly declining Momentum Rank can often give a warning sign, especially in High Flyers.
Diversify
Volatility in individual stocks isn't necessarily a bad thing. Ed recently compared the performance of Super Stocks and found that those rated "Speculative" by the algorithms due to their higher-than-average volatility outperformed the set of Super Stocks as a whole:
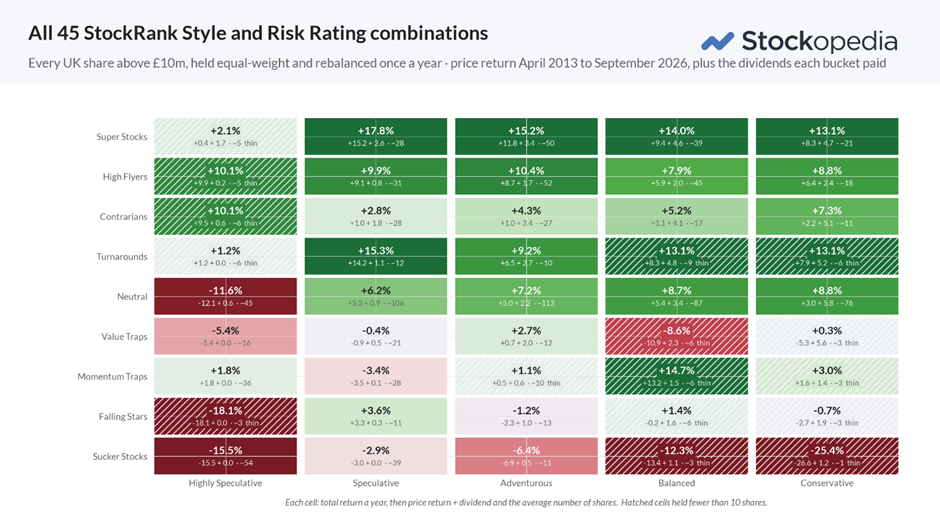
However, to capture that return, investors needed to hold at least 20, and perhaps as many as 30, stocks. That volatility may have also enabled investors who regularly rebalanced to generate an even higher return, as rebalancing volatile, somewhat uncorrelated assets is known to enhance returns.
The key is consistency at the portfolio level, and diversification can help deliver that, even when portfolio components are volatile.
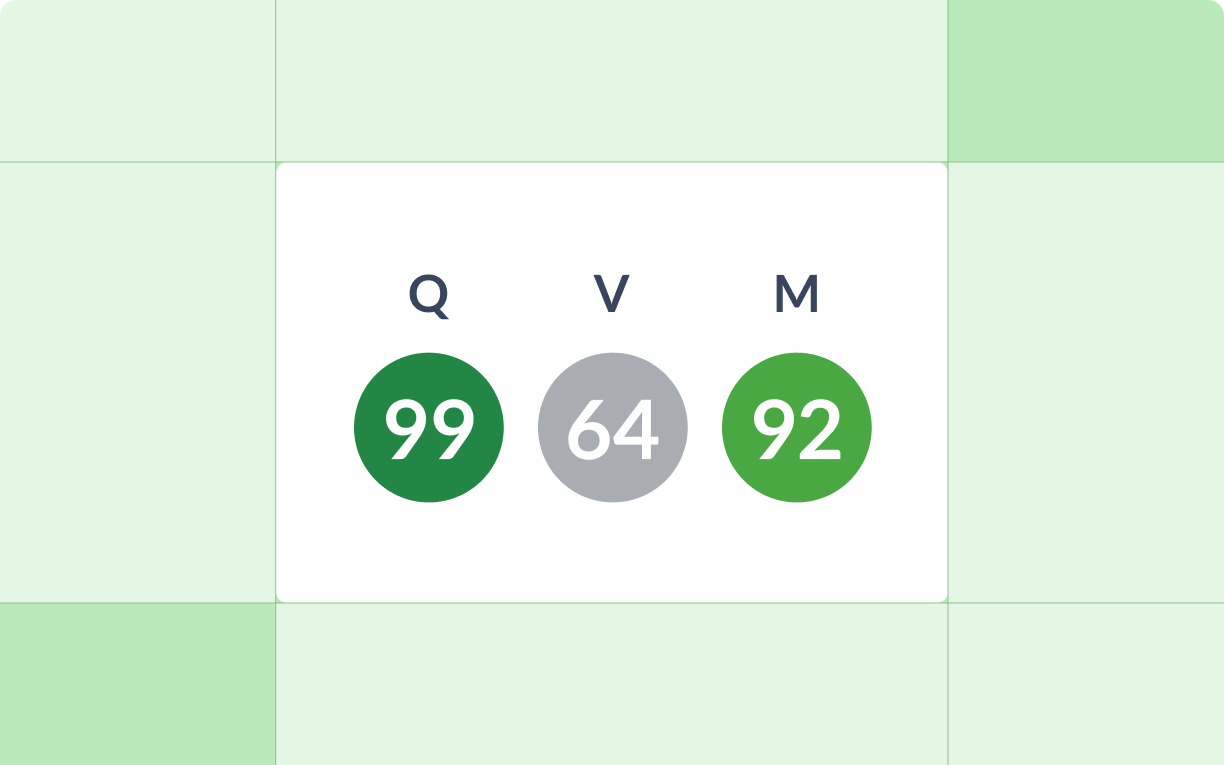
My go-to example is IG Design (LON:IGR). This company had a 99 StockRank in August 2024 and lost investors (including myself) 75% of their money over the following six months:
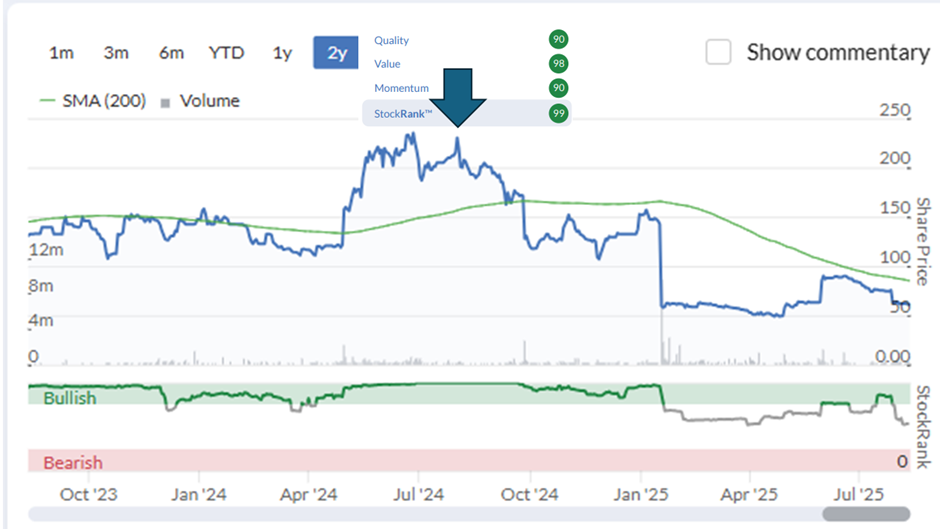
This example doesn't negate the idea that investing in high-Ranked stocks works; it just means the variation in performance of a single Super Stock is still very wide.
Diversification across sectors:
Investing in volatile assets that deliver consistent results as a whole only works because those investments tend to be uncorrelated. So this strategy tends to break down if an investor's portfolio is overly exposed to the same sectors. Stocks in the same sector tend to share the same drivers, so they rise together, and they fall together.
Gold is the obvious recent example. After a spectacular 2025, gold started this year at around $4,340 an ounce and had passed $5,300 by late January, a gain of more than 20% in a matter of weeks. Investors with portfolios full of gold miners looked like geniuses. Since then, the price has fallen back to around $4,050. That is roughly a quarter below the peak and lower than where it started the year. Miners' profits are geared to the gold price, so their shares tend to move by more than the metal, in both directions. An investor who owned ten gold miners didn't have ten uncorrelated investments.
This is why Ed's NAPS strategy picks two or three Super Stocks from each sector, for 20 shares in total, rather than just the top-ranked shares. Personally, I feel investors could afford to be even more diversified on this front, if they value consistency. However, there is no doubting the long-term performance of the NAPS.
Real sectors are never completely unrelated, and in a market sell-off most shares fall together. But banks, housebuilders, miners and software companies don't usually all have their worst years at the same time. It is worth checking how much of your portfolio depends on a single sector or a single commodity price. If the answer is most of it, your returns will only be as consistent as that one theme.
Stop Losses:
Finally, an article about generating consistent results wouldn't be complete without considering stop losses. After all, the fact that it takes a 100% return to recover from a 50% fall in share price is often cited as the reason to have stops in place. While cutting your losses early is certainly a good strategy for avoiding the most pervasive of behavioural biases, loss aversion, it is not a panacea.
Ed measured the performance of implementing a Stop Loss at various levels on his NAPS portfolio. As expected, these did reduce the maximum drawdown in the portfolio:
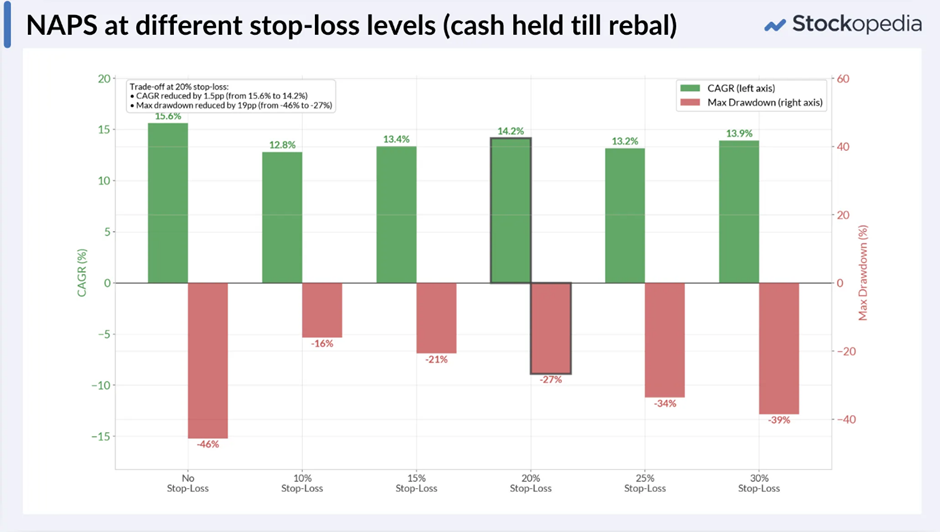
While we are some way from the very consistent but low-returning Portfolio C, the effect is similar; the use of Stop Losses led to lower annualised returns, and hence lower long-term wealth:
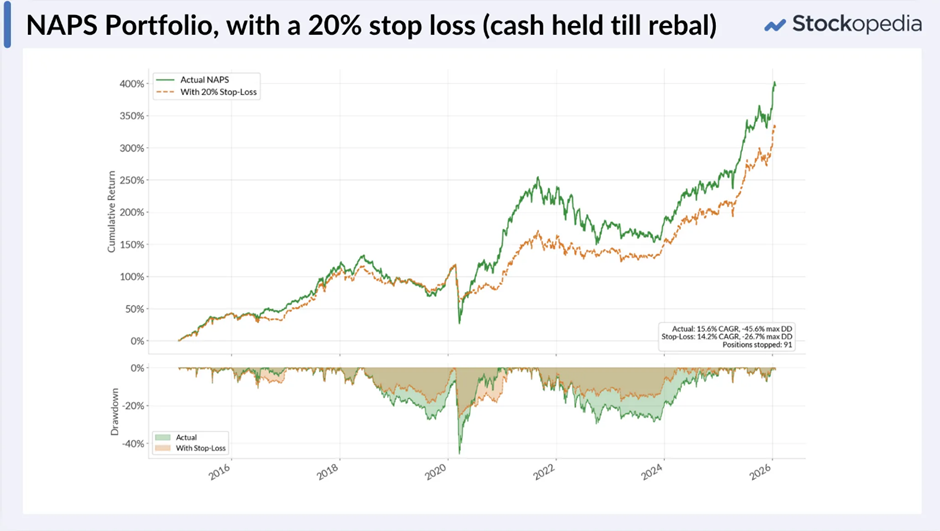
For some, that trade-off is well worth considering. After all, few of us can remain completely sanguine when facing an almost 50% drawdown on our portfolio. However, for many, these risks may be better managed through greater diversification than through strict stop losses.
Conclusion
Consistency is incredibly important in generating long-term wealth. The investors who get noticed build Portfolio As. The ones who get rich build Portfolio Bs. Stockopedia tools can help investors generate those consistent returns.
Disclaimer
This is not financial advice. Our content is intended to be used and must be used for information and education purposes only. Please read our disclaimer and terms and conditions to understand our obligations.
2 comments
Fascinating, perhaps because it makes some of us feel better about our own mediocre returns, but as an investor with an income bent, not to say and need for income inn order ton fund my retirement (!) my own folio is unlikely to shoot the lights out, while it does , according to snowball analytics, boast a low beta and currently a 12% YTD, excluding 75% of dividends from this August. (Income, according to the same source, which I heartily recommend as complementary to Stocko, runs at about 7.6%) Question is, given its overweight on financials, property and (mainly green) infrastructure to what extent it can withstand the seasons of 'drawdown'. But I'm inclined to think that that a folio of well run, relatively high income shares in almost whatever sector are likely to resist the down tides, even their capital values may take a temporary hit. Rather like the robber who was alleged to explain why he only robbed banks ("Answer: because that's where the money is") I'm also inclined to think that so long as people need places for their savings and vehicles to protect themselves from risk, as well as infrastructure to supply themselves with essential energy, and indeed property in which to live, or run their businesses, one is not taking an overly cyclical risk, so much as stake (for better or worse) in the proper functioning of UK PLC, both a economy and as a functioning society. Which is not a moral point, so much as basic surmise on the security (or otherwise) of the shares I mainly hold and rely on for my income.
I think a lot of us oldies do, either despite or because of having lived through a series of seemingly existential financial crises. It pushes us (or me) somewhat towards the so called "Natural Income Strategy" way of doing things, as naturally as certain physical limitations push me away from certain kinds of physical exertion where i have been injured before, but now take far longer to recover!
The lesson, if I've got it right, is that it's more important to avoid the worst of the injuries than to capture the most of the fun.
;)
Thanks, Mark. An excellent reinforcing summary of Stocko research and ideas.