The Screen of Screens just breached a 100% return in 3 years

I have just noted that the Stockopedia Screen of Screens (SoS) has now generated a 100% return since 2012 inception. It's trucked along for the last 3 years at a 24% compound annual growth rate. It's too short a timeframe to draw conclusions, but it's clearly a phenomenal record to date for what has been a fully diversified 25 stock portfolio throughout.
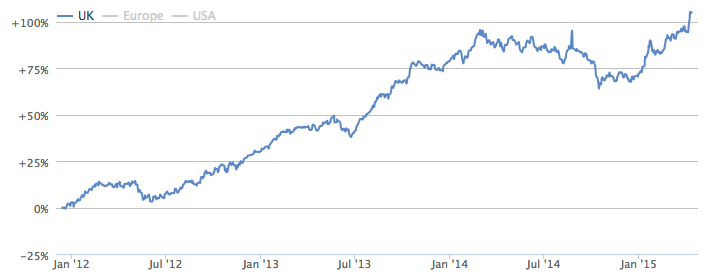
What has been particularly fascinating about this performance is how the Screen of Screens has outperformed the majority of the Guru Screens which contribute to its selections. It currently ranks 15th out of 65 screens since inception, beating 75% of them. For those that don't already know, the Screen of Screens selects stocks that qualify for the most Guru Screens on Stockopedia, and this blended approach across quality, growth, value and momentum appears to have worked well.
Due to the nature of the Guru Screen collection on Stockopedia - where there are more value strategies than momentum strategies - the Screen of Screens is structurally weighted more heavily towards value than growth or momentum. Given there are quite a few Ben Graham Bargain screens in the collection some of the candidate stocks can often raise a few eyebrows.
Where the strategy has been unsuccessful is in its selection of the more dodgy bargain stocks like Naibu - which made this farcical news announcement in February before delisting - but it's also been brave in picking other controversial bargains like Quindell which turned a profit of 150% in just 3 months for the strategy in the first quarter of 2015.
But mostly the Screen of Screens diversifies quite broadly across different classifications of good, cheap and improving stocks - from momentum stocks like Just Eat through to high quality yielders like Next. The screen has an average StockRank of 87 which shows exposure to the same factors that drive the outperformance of the StockRanks.
Although I don't personally use the SoS as my own investment strategy (I'm a StockRanks zealot these days), I do love to see the stocks I buy qualify for at least a couple of guru screens on their StockReports. I was born into stock market investment through the use of stock screens, and they'll always be a key part of my own personal toolkit.
If you've been using the Screen of Screens as part of your own investment process I'd be fascinated to hear how it's been going in the comments below.
Disclaimer
This is not financial advice. Our content is intended to be used and must be used for information and education purposes only. Please read our disclaimer and terms and conditions to understand our obligations.

14 comments
How does the 58% account for the spread on buying and selling each stock?
Yes good point - there's no transaction costs built into the 58% so you do have to weight that in. Transaction costs obviously depend on broker choice, portfolio construction and portfolio size so they can be hard to generalise, but let's give it a go.
If I take an example implementation of the top 20 UK StockRank 97.5+ stocks with a £50m+ capitalisation. The average bid-ask spread is just over 1% though it's skewed upwards by 4 stocks with spreads of greater than 2% . Investors could likely get better execution than that from their brokers, but including commission etc that's not a bad estimate of transaction cost.
So churning a portfolio outright would cost about 1% in spreads/commission each time, though not every share would need sold & re-bought as many would continue to qualify and could just be held.
Below is perhaps a more realistic annually (rather than quarterly) rebalanced portfolio built with the above parameters (97.5+ StockRank and £50m cap) before costs - it's rebalanced twice since inception. Real implementation would have cost no more than 3%.
Past performance is of course no indicator of future returns. This is for illustration purposes only. DYOR.
Thanks Ed, correction of fact much appreciated.
Would be good if we had more bench marking options in the portfolios, whilst I appreciate there are other free to access tools that do this (morningstar for example), would be interesting to be able to compare my own portfolio to Stockopedia specific strategies e.g. screen of screens and particularly stockranks.
Yep we're working on it as we speak... hope we can get our own benchmarks into the mix. Looking like year end 2015 though.
thank you
Hi Ed, sorry to be the one that does this, but according to Trustnet Charting, the FTSE 250-IT has returned the same total return over the same period.
Underscored... couple of points here:
Firstly, I'm not including dividends above... so your FTSE 250 total return figure is not comparable. If we included dividends the SoS would probably be up more than 117%. The FTSE 250 ex-IT has an 88% capital only return over the same period, while the FTSE 250 incl IT has an 81% return. So the SoS is outperforming the best of the UK indices.
Secondly the FTSE 250 is probably my favourite stock market index - we've owned it in our investment club for 10 years. It has a natural sell mechanism (overvalued stocks exit to the FTSE 100), an average StockRank of 75, and a sweet spot in terms of market cap. I like it and would recommend that passive index investors buy the 250 over almost all other UK tracker funds.
It is though a very good point you raise. We have to make sure our proprietary strategies beat every index - otherwise what's the point right? While the SoS is an interesting experiment & I'm glad it's outperforming it's not our core proprietary strategy - the StockRanks certainly are though.I note that since inception the top 10% of StockRank stocks are up 58% versus 31% for the FTSE 250 which is a big outperformance - that's the benchmark I am keeping my beady eye on.
Ed you said -" FTSE 250 is probably my favourite stock market index.."
Then you should love this on a 14% discount with some modest gearing too!
Thanks for the update Ed. Having used a number of tools and screen over the years, I have now settled on Stockopedia as the best, and use Stockopedia StockRanks religiously. I think I spent too many years chasing bargain value stocks, and in many cases was very successful. However, this was counterbalanced by a large number of cases where I was profoundly unsuccessful, and so overall returns were not as good as I would have liked.
The SoS is one of, if not my most preferred screen, and by and large these days any stock that doesn't have at least a reasonably decent StockRank doesn't warrant any further attention IMHO. I know I may miss some good stocks as a result, but having tried and failed, and also having a very busy life, the StockRanks and SoS reduces the world that I need to investigate dramatically, and allows me to achieve this alongside all of my other work commitments.
Stockopedia is, I believe, the best tool around today, and long may you prosper.
Thanks.
Hi Ed
Very impressive.
Can you expand more on your "I'm a StockRanks zealot these days" comment or perhaps another post! :-).
I'm often expounding on the StockRanks theme - e.g. here http://www.stockopedia.com/content/a-gratuitous-deconstruction-of-the-stockranks-96108/
Very good. Congratualtions on being able to develop such an effective screener.
I'm confused as to why it is a 25 stock portfolio when there are far more companies in the screen. How are the 25 selected?
For performance tracking we just track the top 25 stocks in each portfolio. Lots more info in the knowledge base. http://help.stockopedia.com/knowledgebase/topics/26542-guru-screens