The SNAPS Portfolio 2024 - selecting stocks when expecting the unexpected

What a shocking weekend in America. The full ramifications of the Trump assassination attempt are yet to unfold, but this is yet another illustration of increasing political turbulence and uncertainty on both sides of the pond. This creates a difficult environment for investors and one which I’ll be musing on later in this article. Nonetheless, in the short term, markets continue to have a positive frame of mind, with the US futures indicating strength at the open. At the end of last year, the UK stock markets flagged an extreme oversold indicator, followed by a strong change of trend. I’ve been fully invested since, and see no reason to change that stance.
The NAPS year to date
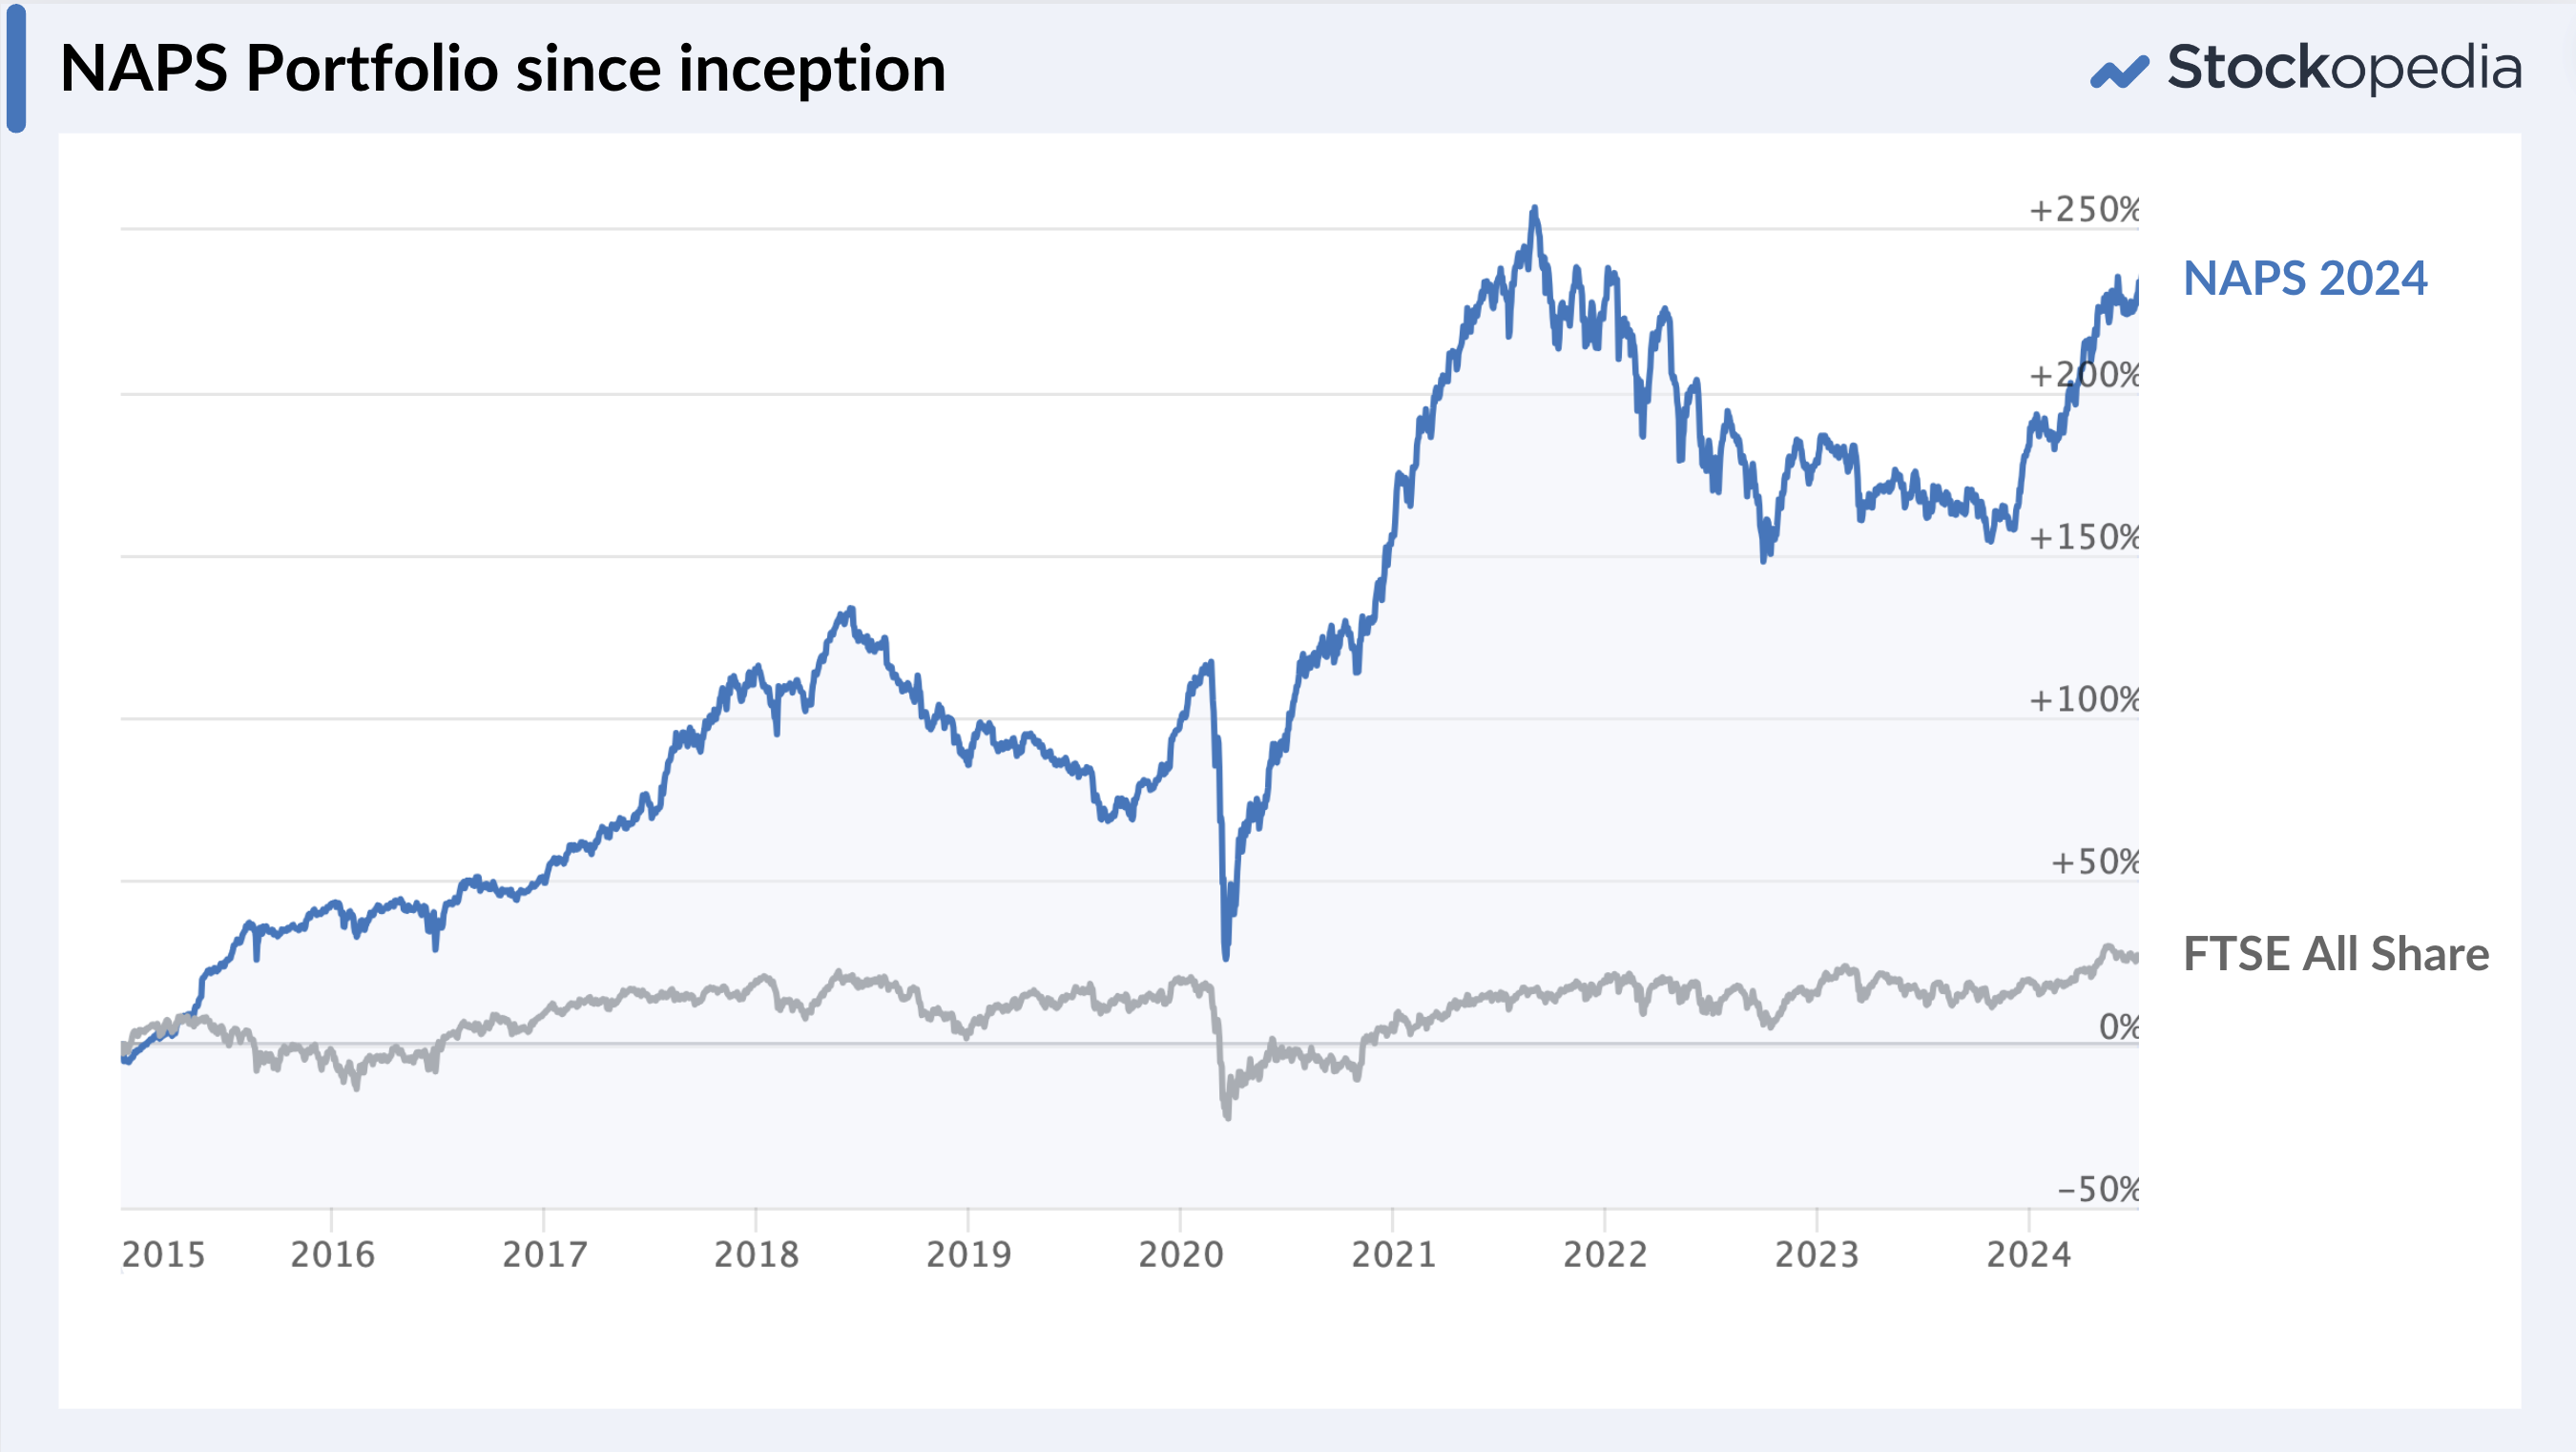
The NAPS Portfolio has outperformed all the major indices and continues its strong run of form since inception almost ten years ago. By June 30th, the portfolio had returned almost 14.8% (now 18%), versus the FTSE All Share at only 5.2% and a flat AIM market. Both the portfolio and the index have a more than 3% dividend yield which push these returns further. The NAPS has even continued its outperformance against the S&P 500 which had returned 10.8% by the same mark.

The NAPS Portfolio is a simple systematic investment process, that buys a portfolio of the 20 highest-ranked stocks distributed across ten sectors (read up on almost ten years of history here). It’s effectively a well constructed sample of high ranked stocks, so I always like to compare the portfolio against the average return of the 90+ StockRank set. While this year’s outperformance is down to luck, after a few difficult years for UK investing, it’s gratifying.

While the aggregate statistics have been strong, there’s no denying that 2024 has been a stock pickers market. Paul and Graham’s watchlists have trounced the NAPS Portfolio year to date, with 31% and 35% returns as of today. Their standout selection, CMC Markets (LON:CMCX) , has more than tripled. Congratulations to them, and to every investor in the community that has beaten the NAPS. It’s in markets like these that smart, discretionary stock pickers really can make a difference. Please do let me know how you are getting on in the comments below.
The underlying portfolio performance
Breaking down the NAPS by position, highlights the breadth and depth of the winners. Fifteen out of twenty positions have generated positive returns, with some standout winners in Metals Exploration (LON:MTL) ,Greencore (LON:GNC) , Renold (LON:RNO) and Seplat Energy (LON:SEPL) .
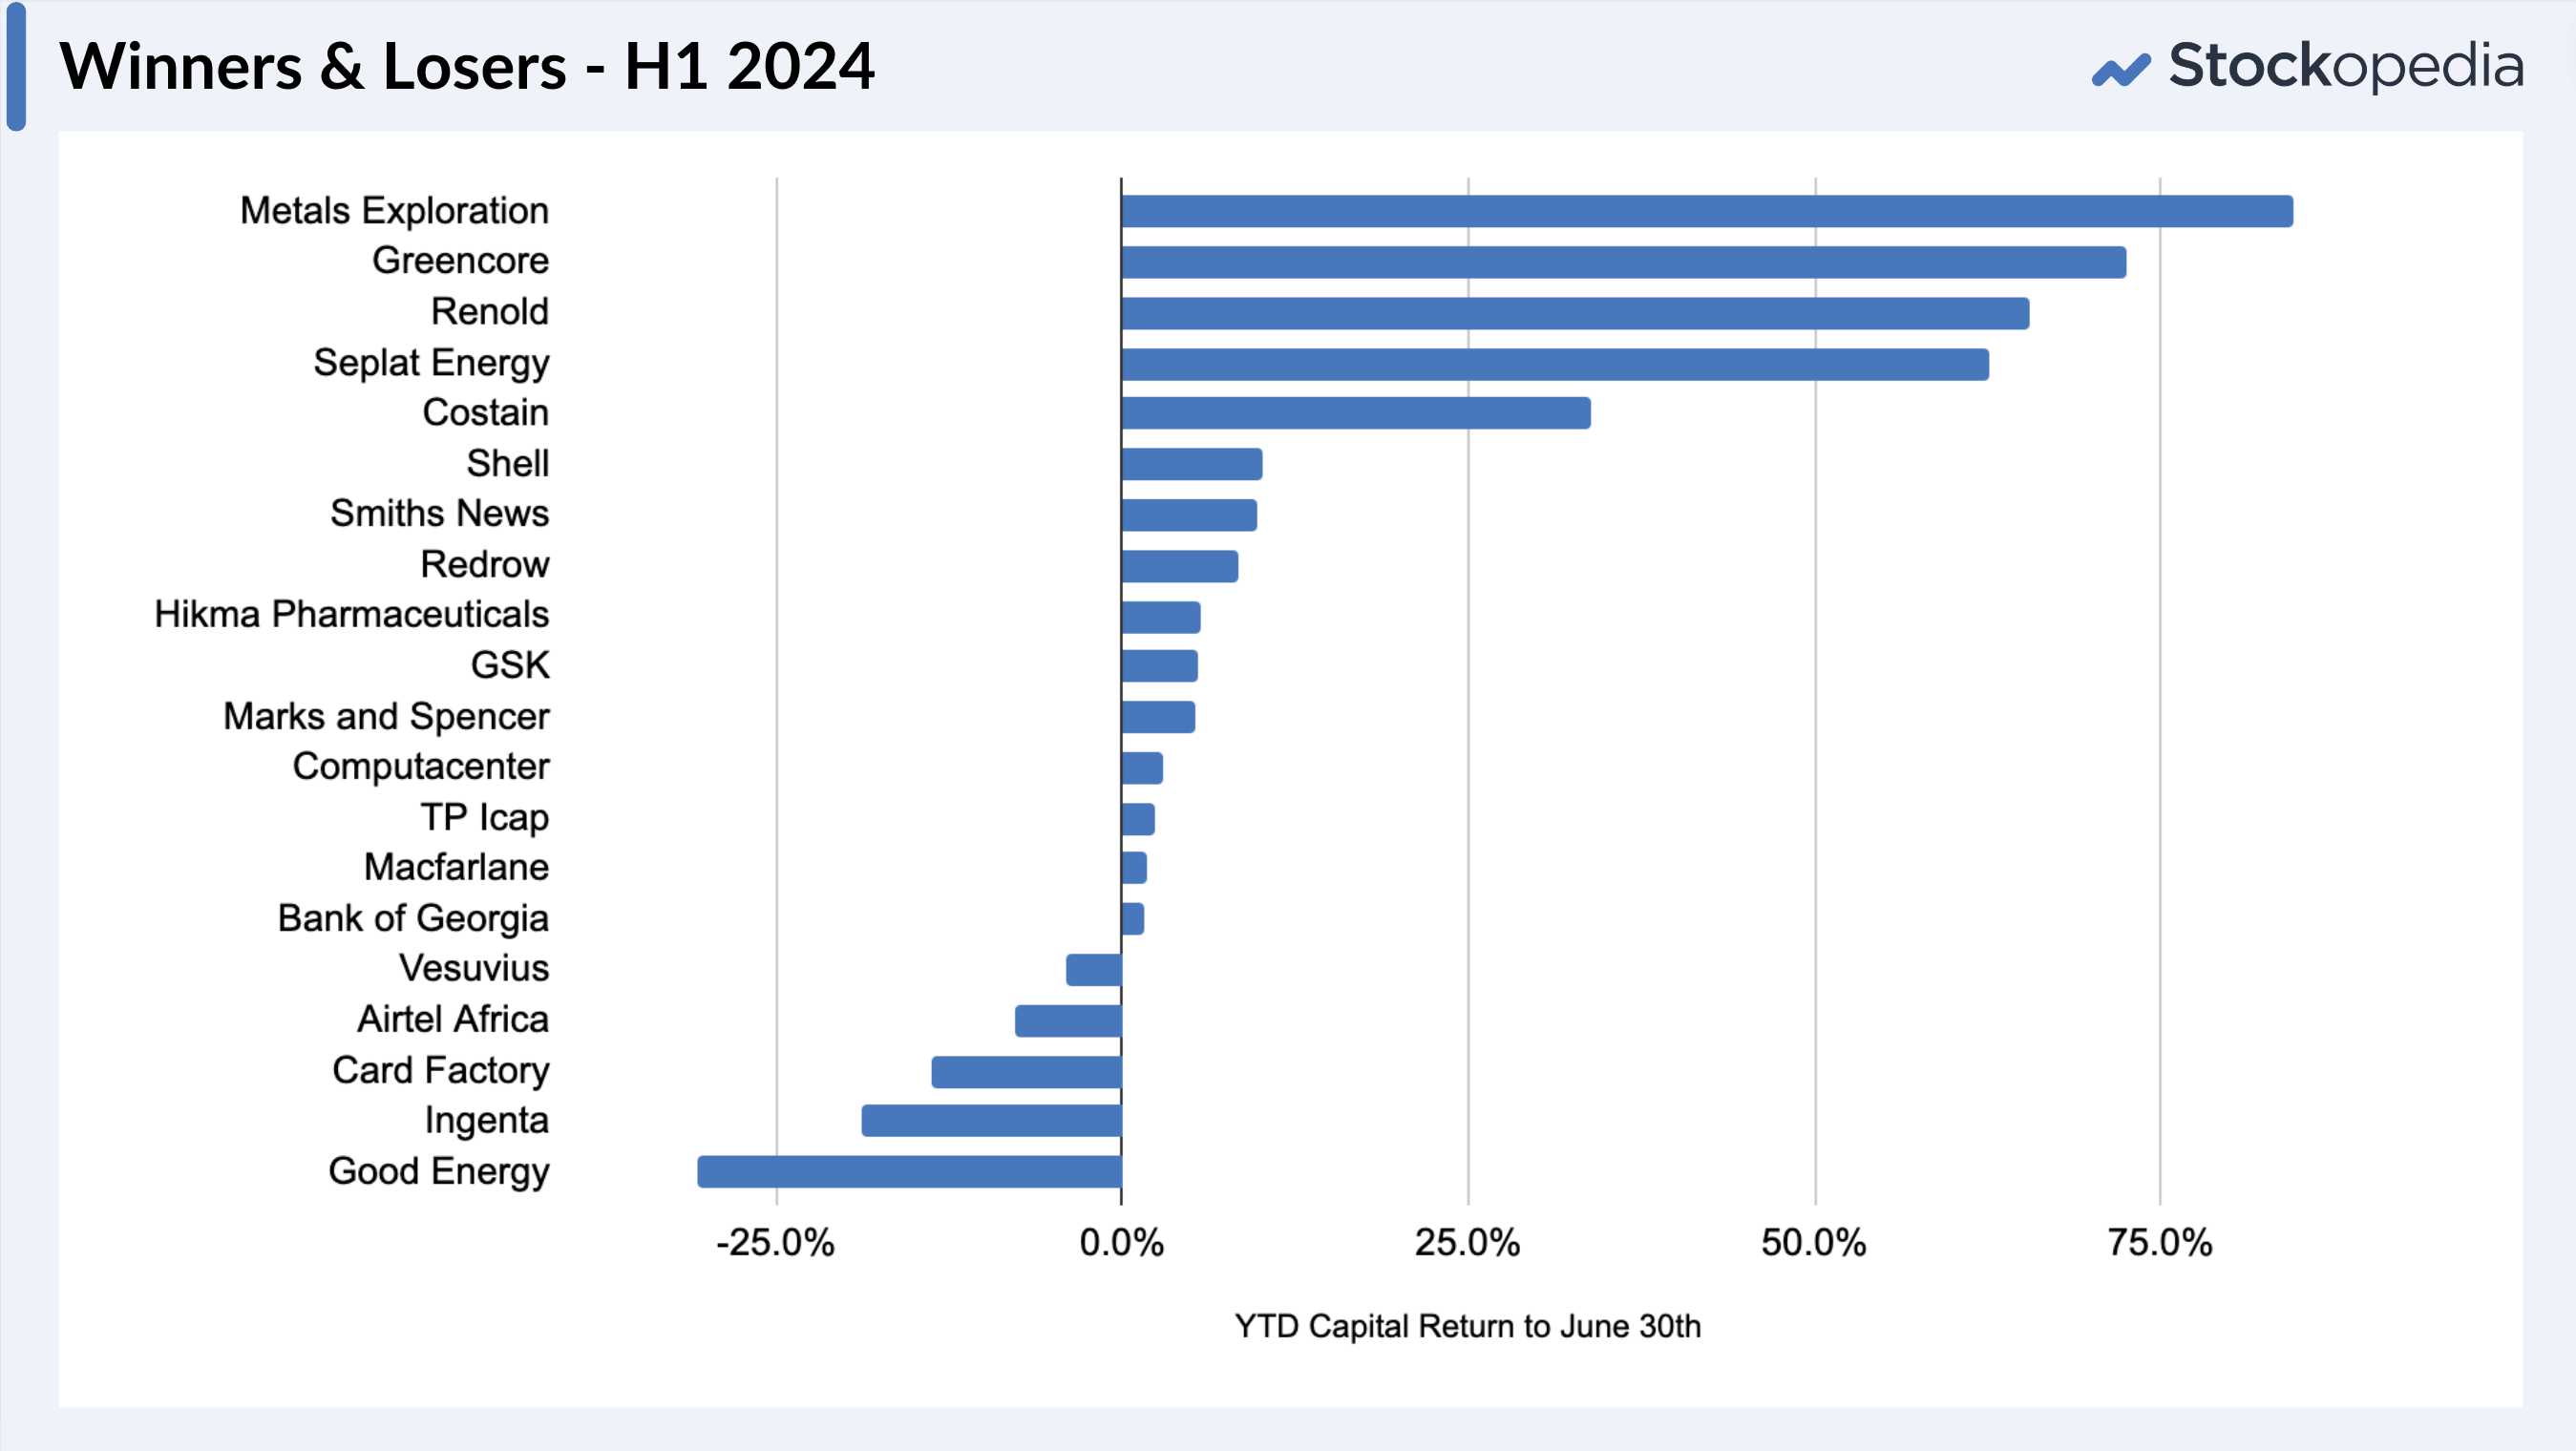
The list highlights some of the trials and tribulations of investing in popular stocks. Renold (LON:RNO) has been one of the more broadly held stocks among the community and has strongly rewarded the faithful. But at the start of the year, Good Energy (LON:GOOD) and Card Factory (LON:CARD) were in vogue, which have since struggled. Meanwhile, Ingenta (LON:ING) has pulled back, while seeing favour among much smarter investors than me. These stocks may come good, but it’s so important when constructing a portfolio to keep an independent mindset and not be too swayed by the actions of others. Develop your own rules, stay patient and stick to them.
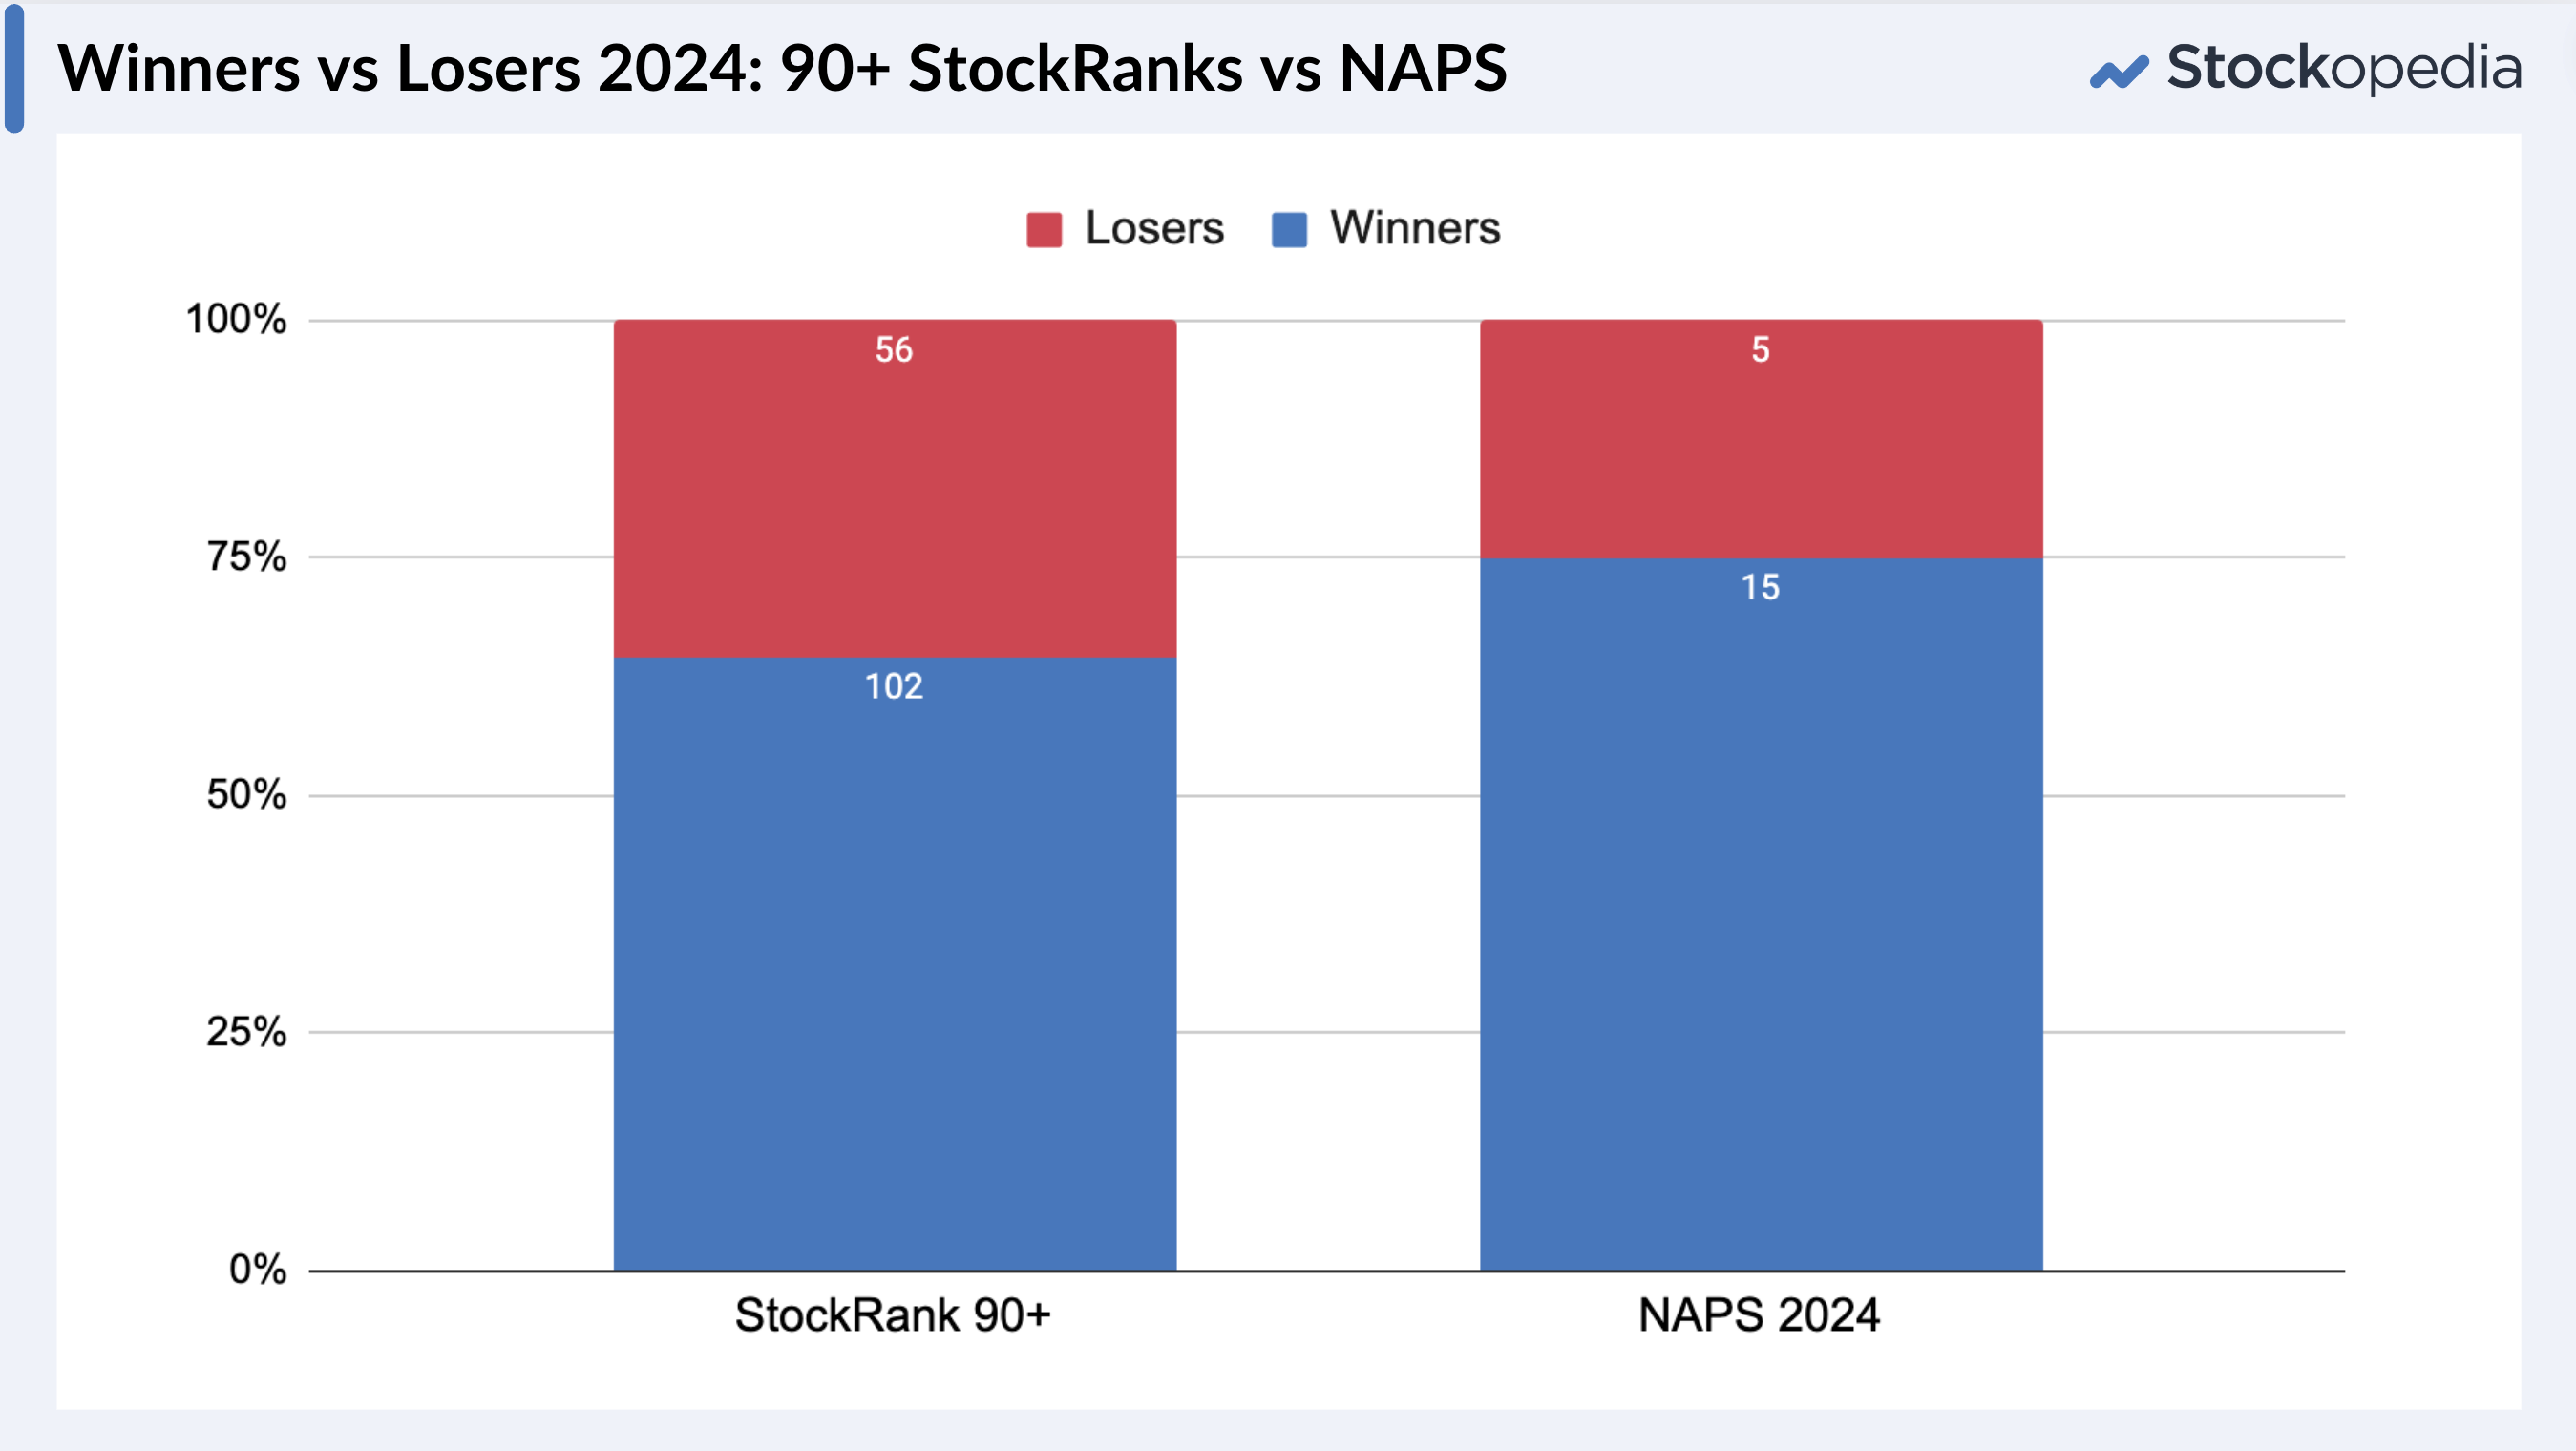
The portfolio’s 75% win rate is fortuitous, and well beyond that of the 90+ StockRanks as a whole at 65%. This is a good sign, which suggests not only that the portfolio is behaving well, but that there’s increasing technical breadth behind the overall market.
On expecting the unexpected
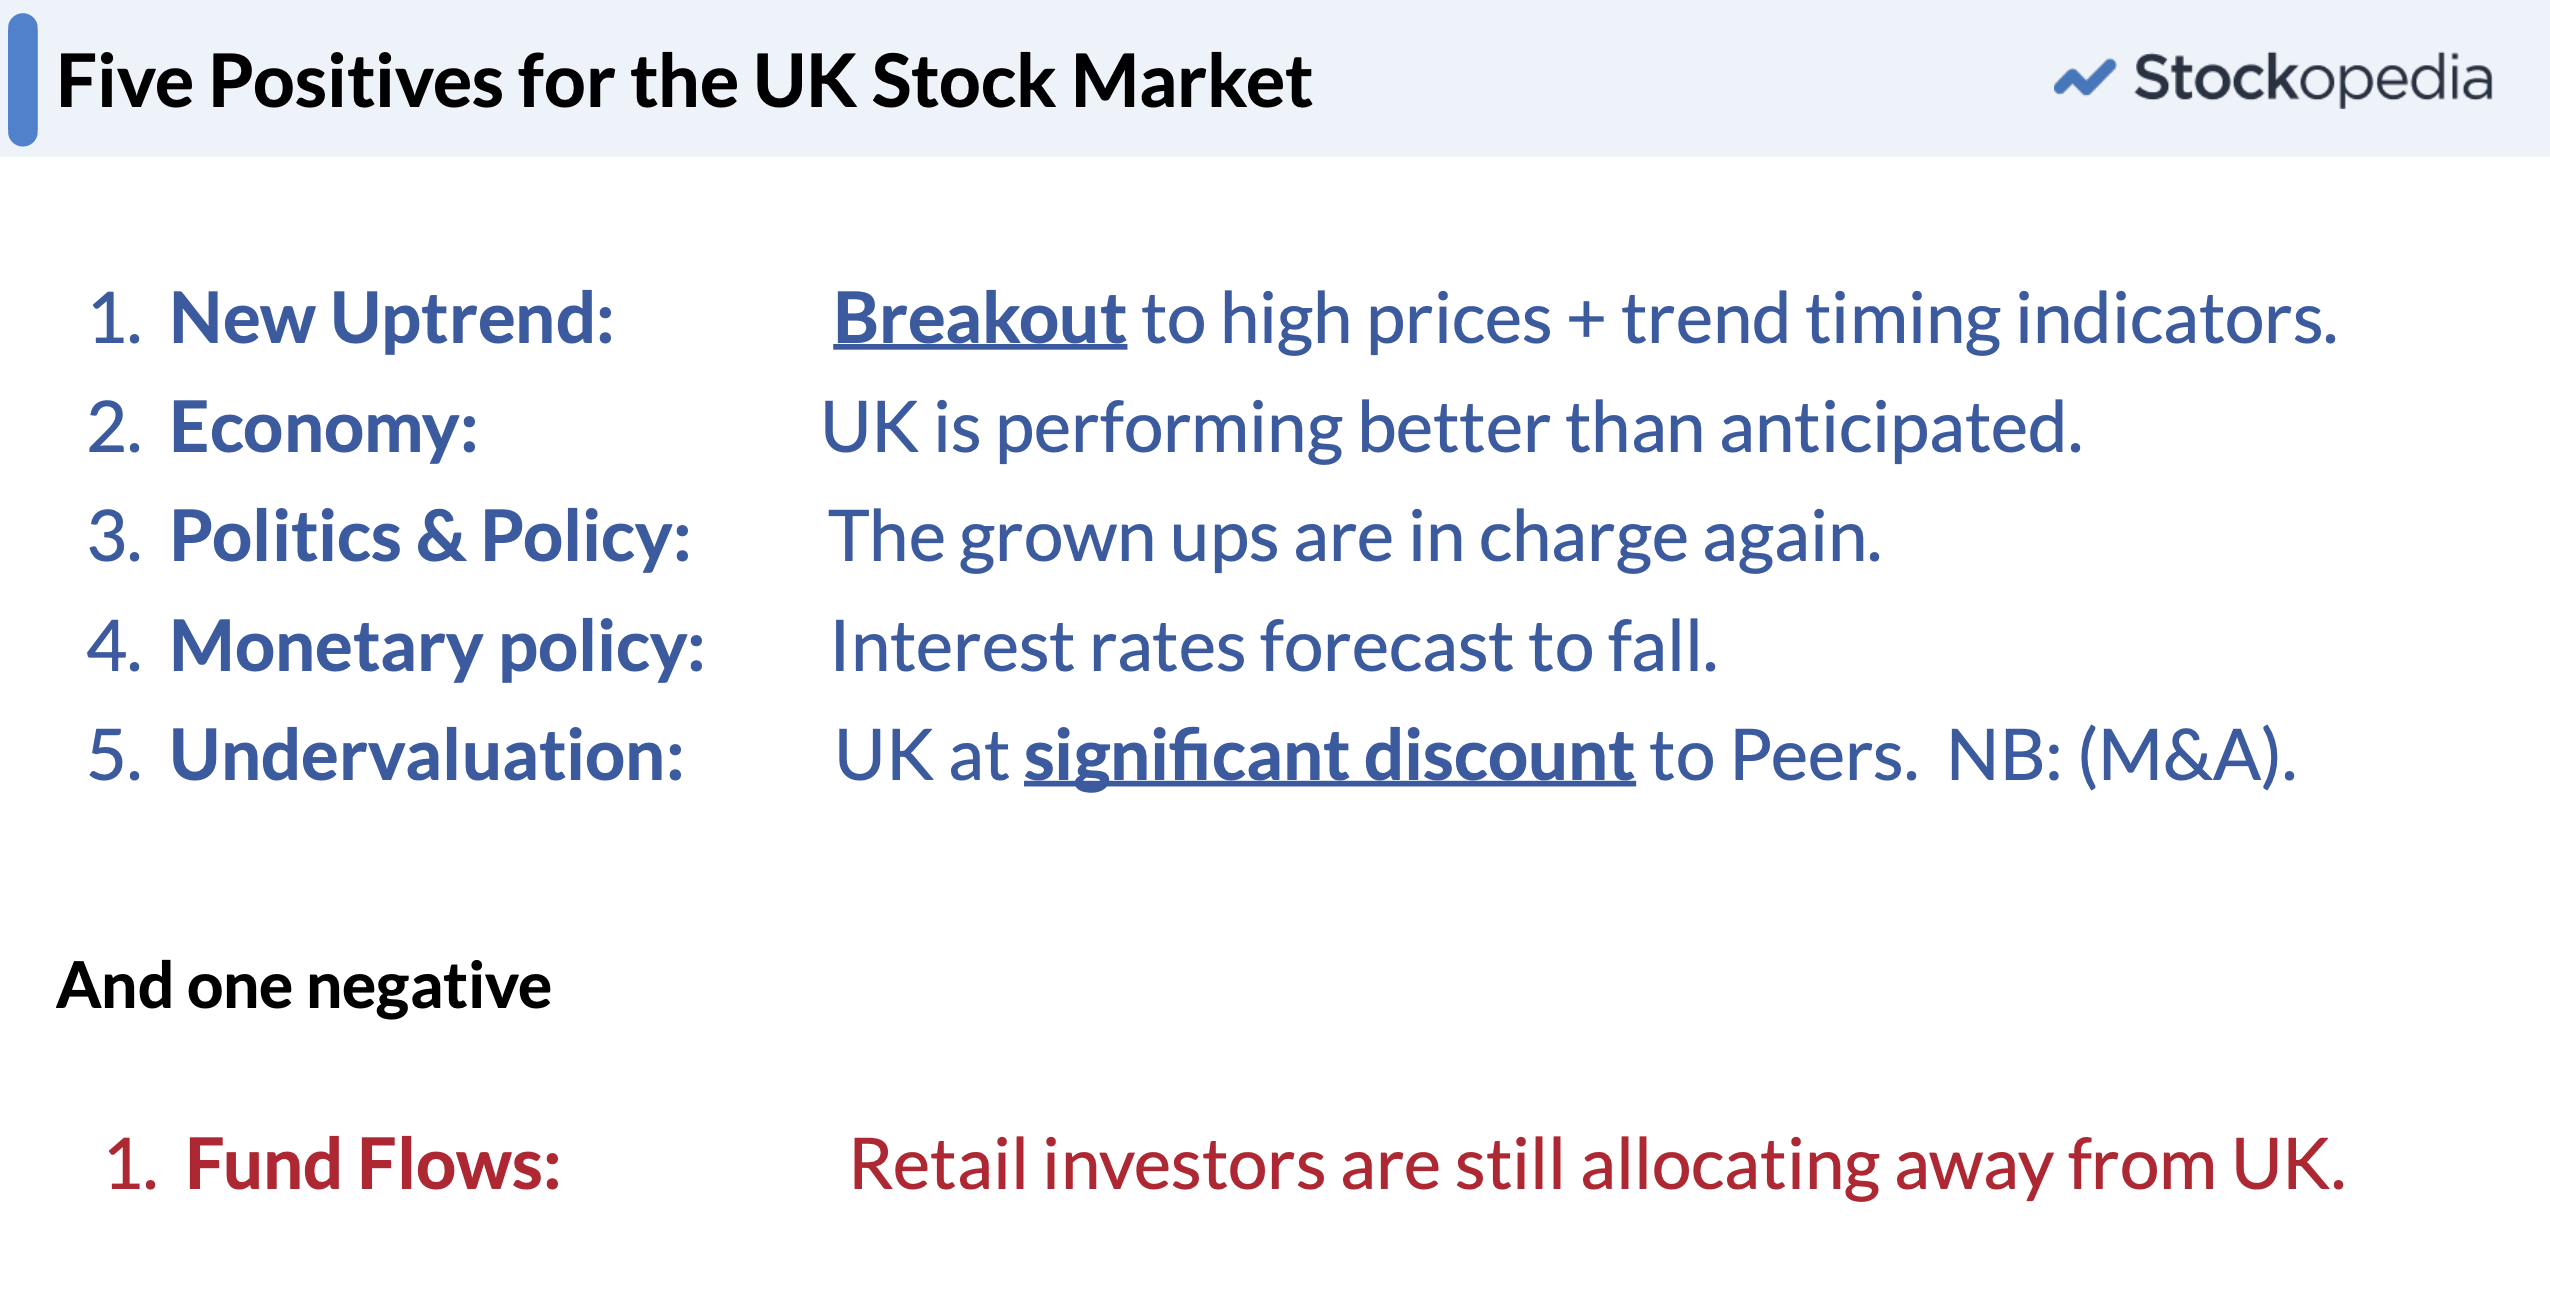
I recently hosted a webinar about how to pick the best value stocks for the UK market recovery. While I don’t pretend to be a deep economic thinker, the introduction to the webinar went into a few key points about the UK equities markets. Not only are we seeing a new uptrend, but the UK is deeply undervalued relative to its peer group while the economy and interest rate environment are improving. Clarity on the political environment here should continue to bring more strategic international investment into the UK and perhaps, finally, we may start to see fund flows turn positive. Most of these factors remain positive for the UK, and do check out the slides if you don’t have time to watch the webinar. It also serves as a good reminder and primer about the StockRanks.
Given the above, I’m still hopeful that we’ll see a new all-time high for the NAPS this year. It’s been more than three years since the 2021 peak, and we’re well overdue.
Nonetheless, Trump’s assassination attempt highlights increased political risk around the world. We’re seeing a resurgence of far-right politics all over Europe and in the UK, while protectionism and deglobalisation all appear to be growing.
A few years ago, I came across Peter Turchin. He’s a statistician who cut his teeth in biology before applying his statistical prediction methods to social sciences. In 2010, he predicted we’d see a pandemic in the coming years, and a rise in political discord and violence. He’s gained a great deal of renown as a result, publishing his thoughts in books such as “Ages of Discord” and "End Times".
At the heart of his predictions are two multi-factor measures: Elite Overproduction (with too many qualified people seeking power who can’t get it) and Popular Well-Being (which is independent but trends counter-cyclically to Elite Overproduction). When there is high Elite Overproduction, and low Popular Well-Being (such as now) you see greater political violence and discord. That time is now.
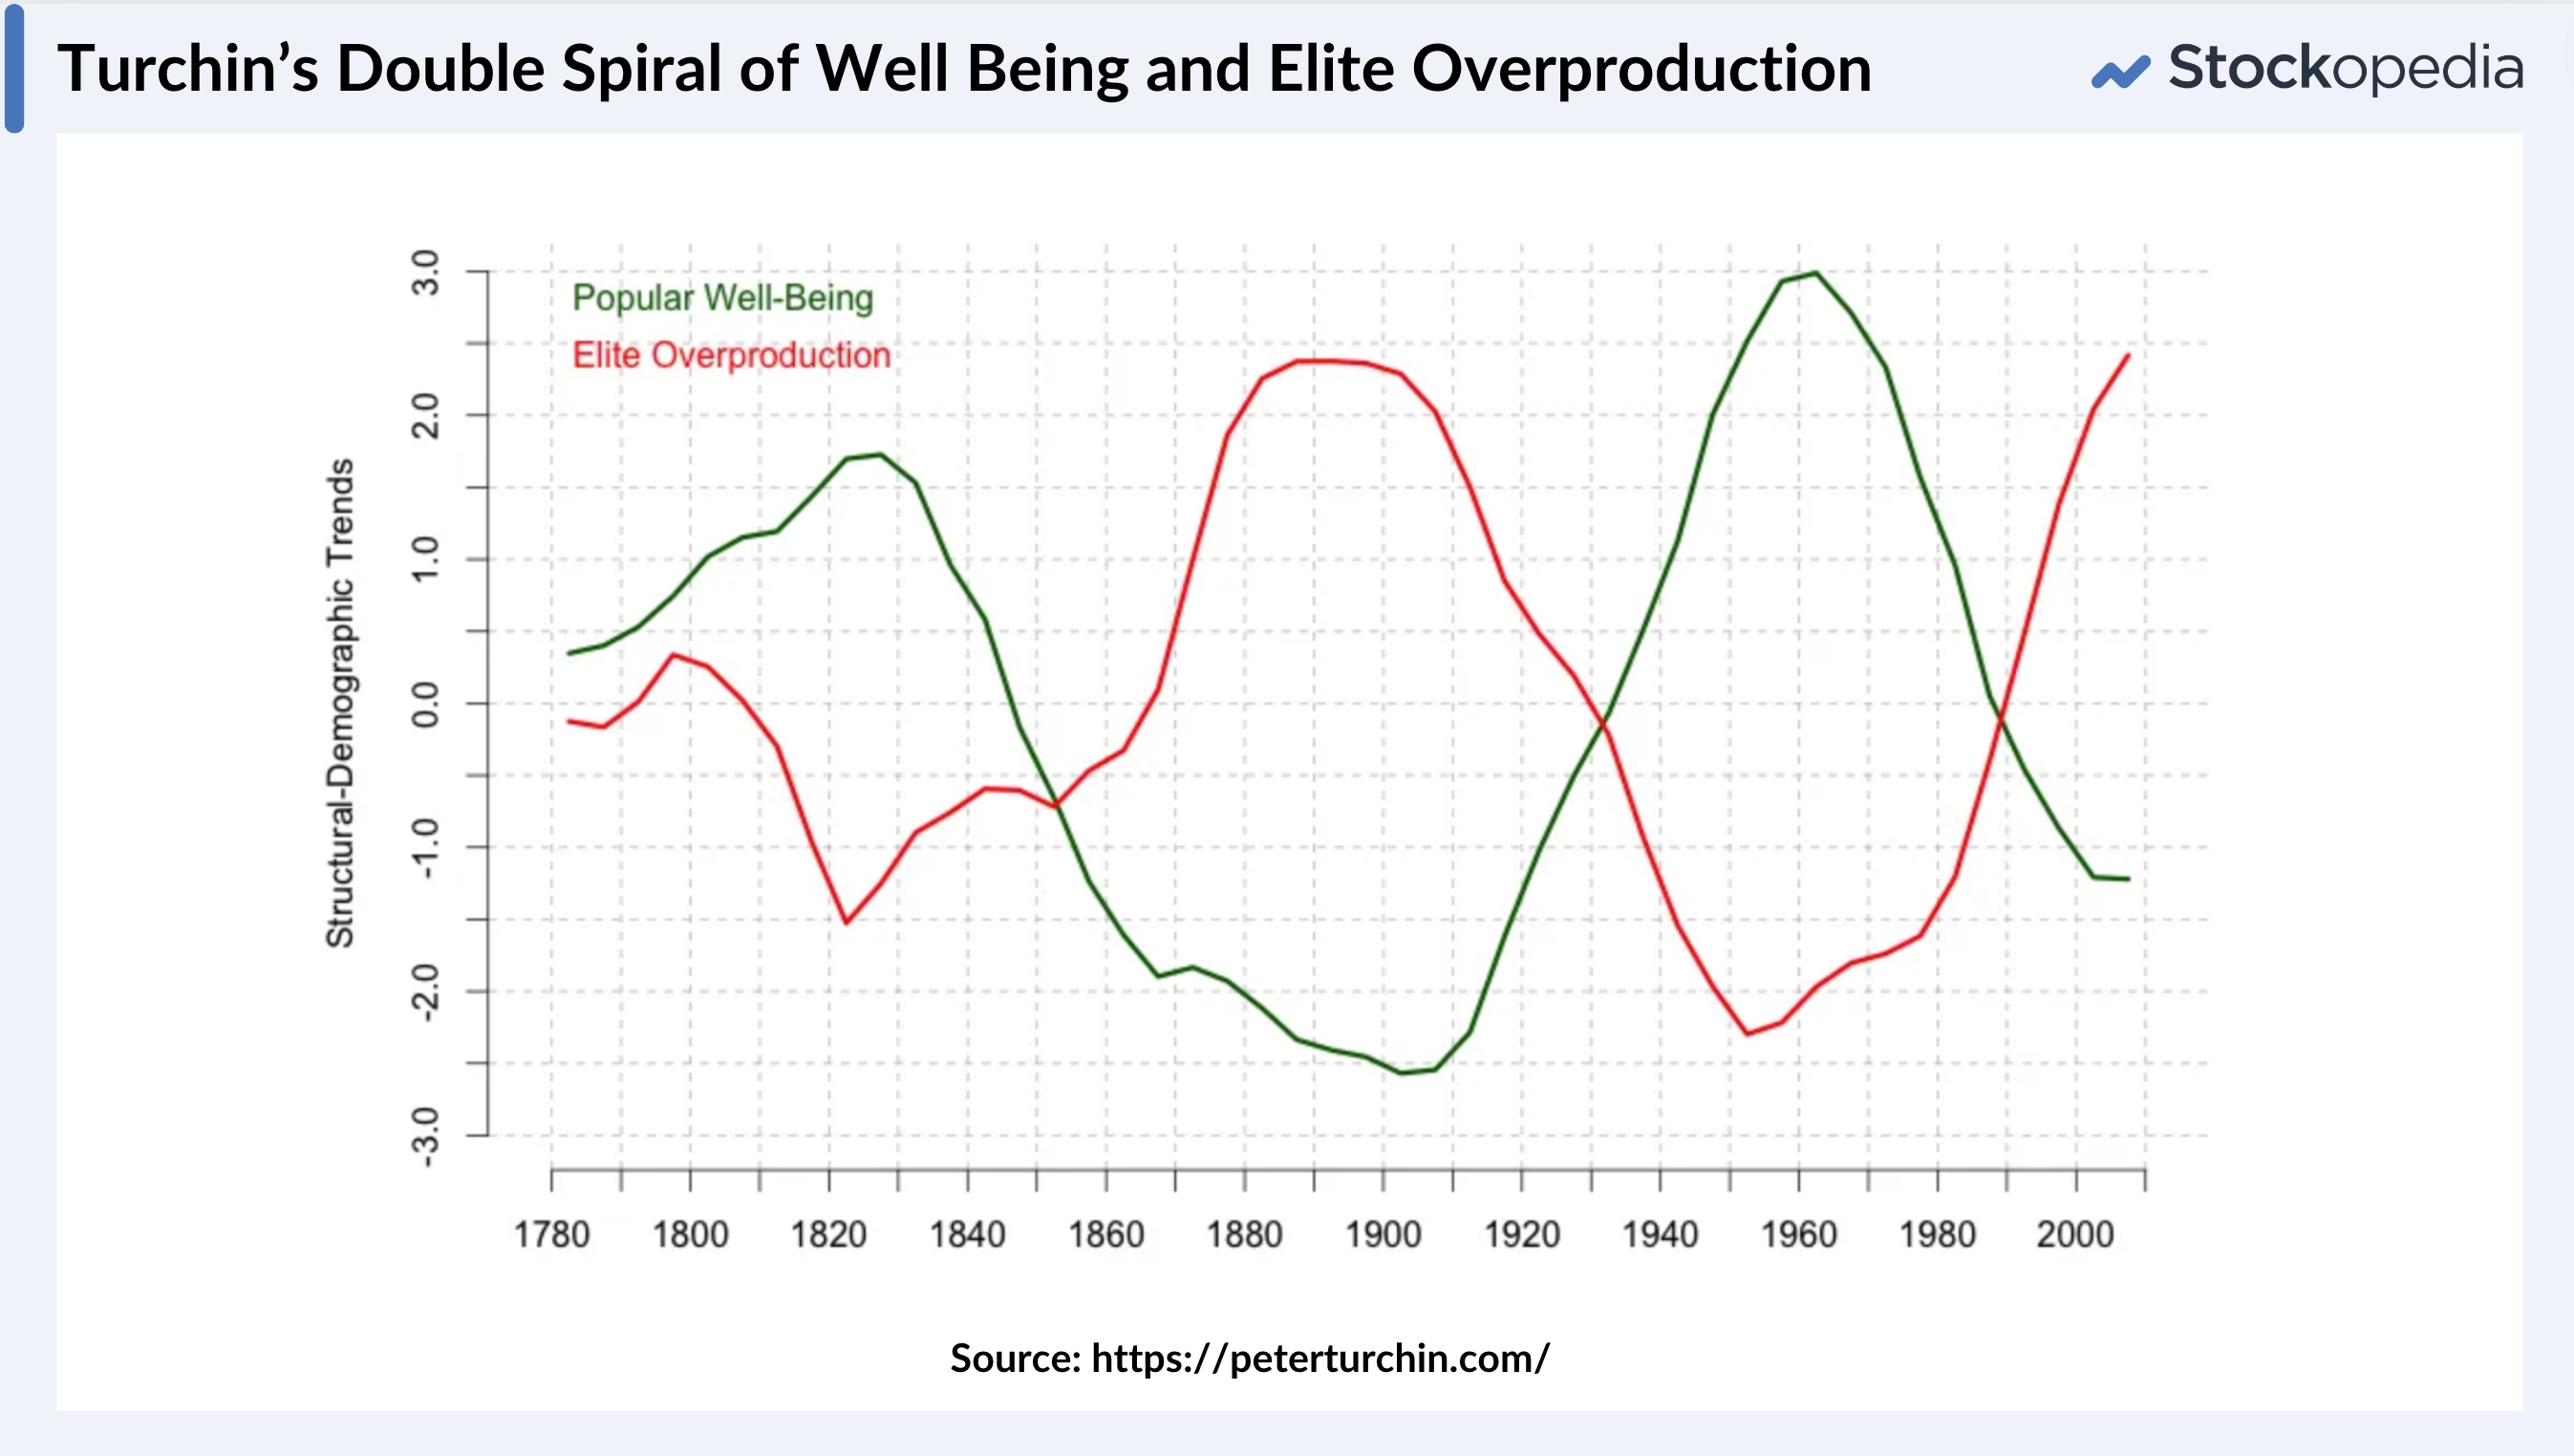
I don’t share the above to scare everyone out of their portfolios, but I do to reiterate that we’re in an age of uncertainty. While the macro environment still appears modestly bullish for the UK, there’s little doubt that investors are all at heightened risk of unknown political forces.
So what to do?
Well, to be frank, we’ve been in a very difficult UK equity environment ever since the Brexit vote in 2016, but intelligent UK investors have continued to prosper. At the end of the day, sane stock selection, sensible portfolio construction and good risk management should continue to benefit those that practice them.
I will continue to bang the drum for the benefits of factor investing for improving risk-adjusted returns. Ultimately, Black Swans and market panics do occur, so you can’t remove all the downside volatility from equity investments. But reducing your equity allocation in negatively trending markets can significantly reduce drawdowns, if not improving absolute returns. I’ll do my best to flag changes of trend as and when they do occur. Meanwhile, I stay fully invested.
The SNAPS Portfolio 2024
As has become the habit, I like to publish a half-year version of the NAPS Portfolio. I have to apologise for being late, as I’ve had a little time off to celebrate my father-in-law’s 80th birthday in Skye. The good news is that the portfolio that qualifies today, is identical to the portfolio that qualified on the 30th June.
The rules remain the same as those at the start of the year, when I decided to revert to basics. We used the core QVM StockRank, with the following rules:
- 20 stocks from all 10 sectors.
- No more than 1 utility and 1 telecom. Maximum of three in any other sector. (I select the top two in all other sectors, then fill the last 2 spots with the next two highest-ranked stocks in 2 sectors).
- Minimum £10m market cap. (Beware of 5%+ spread stocks).
- Ranked by StockRank descending.
It's easy to build the above using a stock screen, or on the sector pages, but the portfolio diversification is also key to the approach. Yes, you could just buy the top 20 highest-ranked stocks, but it can lead to significant sector skews and drawdowns. Often, great stocks in sectors that tend to have lower StockRanks (like Healthcare and Technology) are missed if you don’t diversify. This all weather approach has always made the portfolio more robust to Black Swans like the pandemic, where utilities, healthcare and defensive stocks provided spine. Given the political environment, I do think this continues to make sense.
This year’s NAPS are a case in point. Strong returns to Basic Materials and Energy stocks were perhaps unexpected, and easily missed by investors who favour industrials and cyclicals.
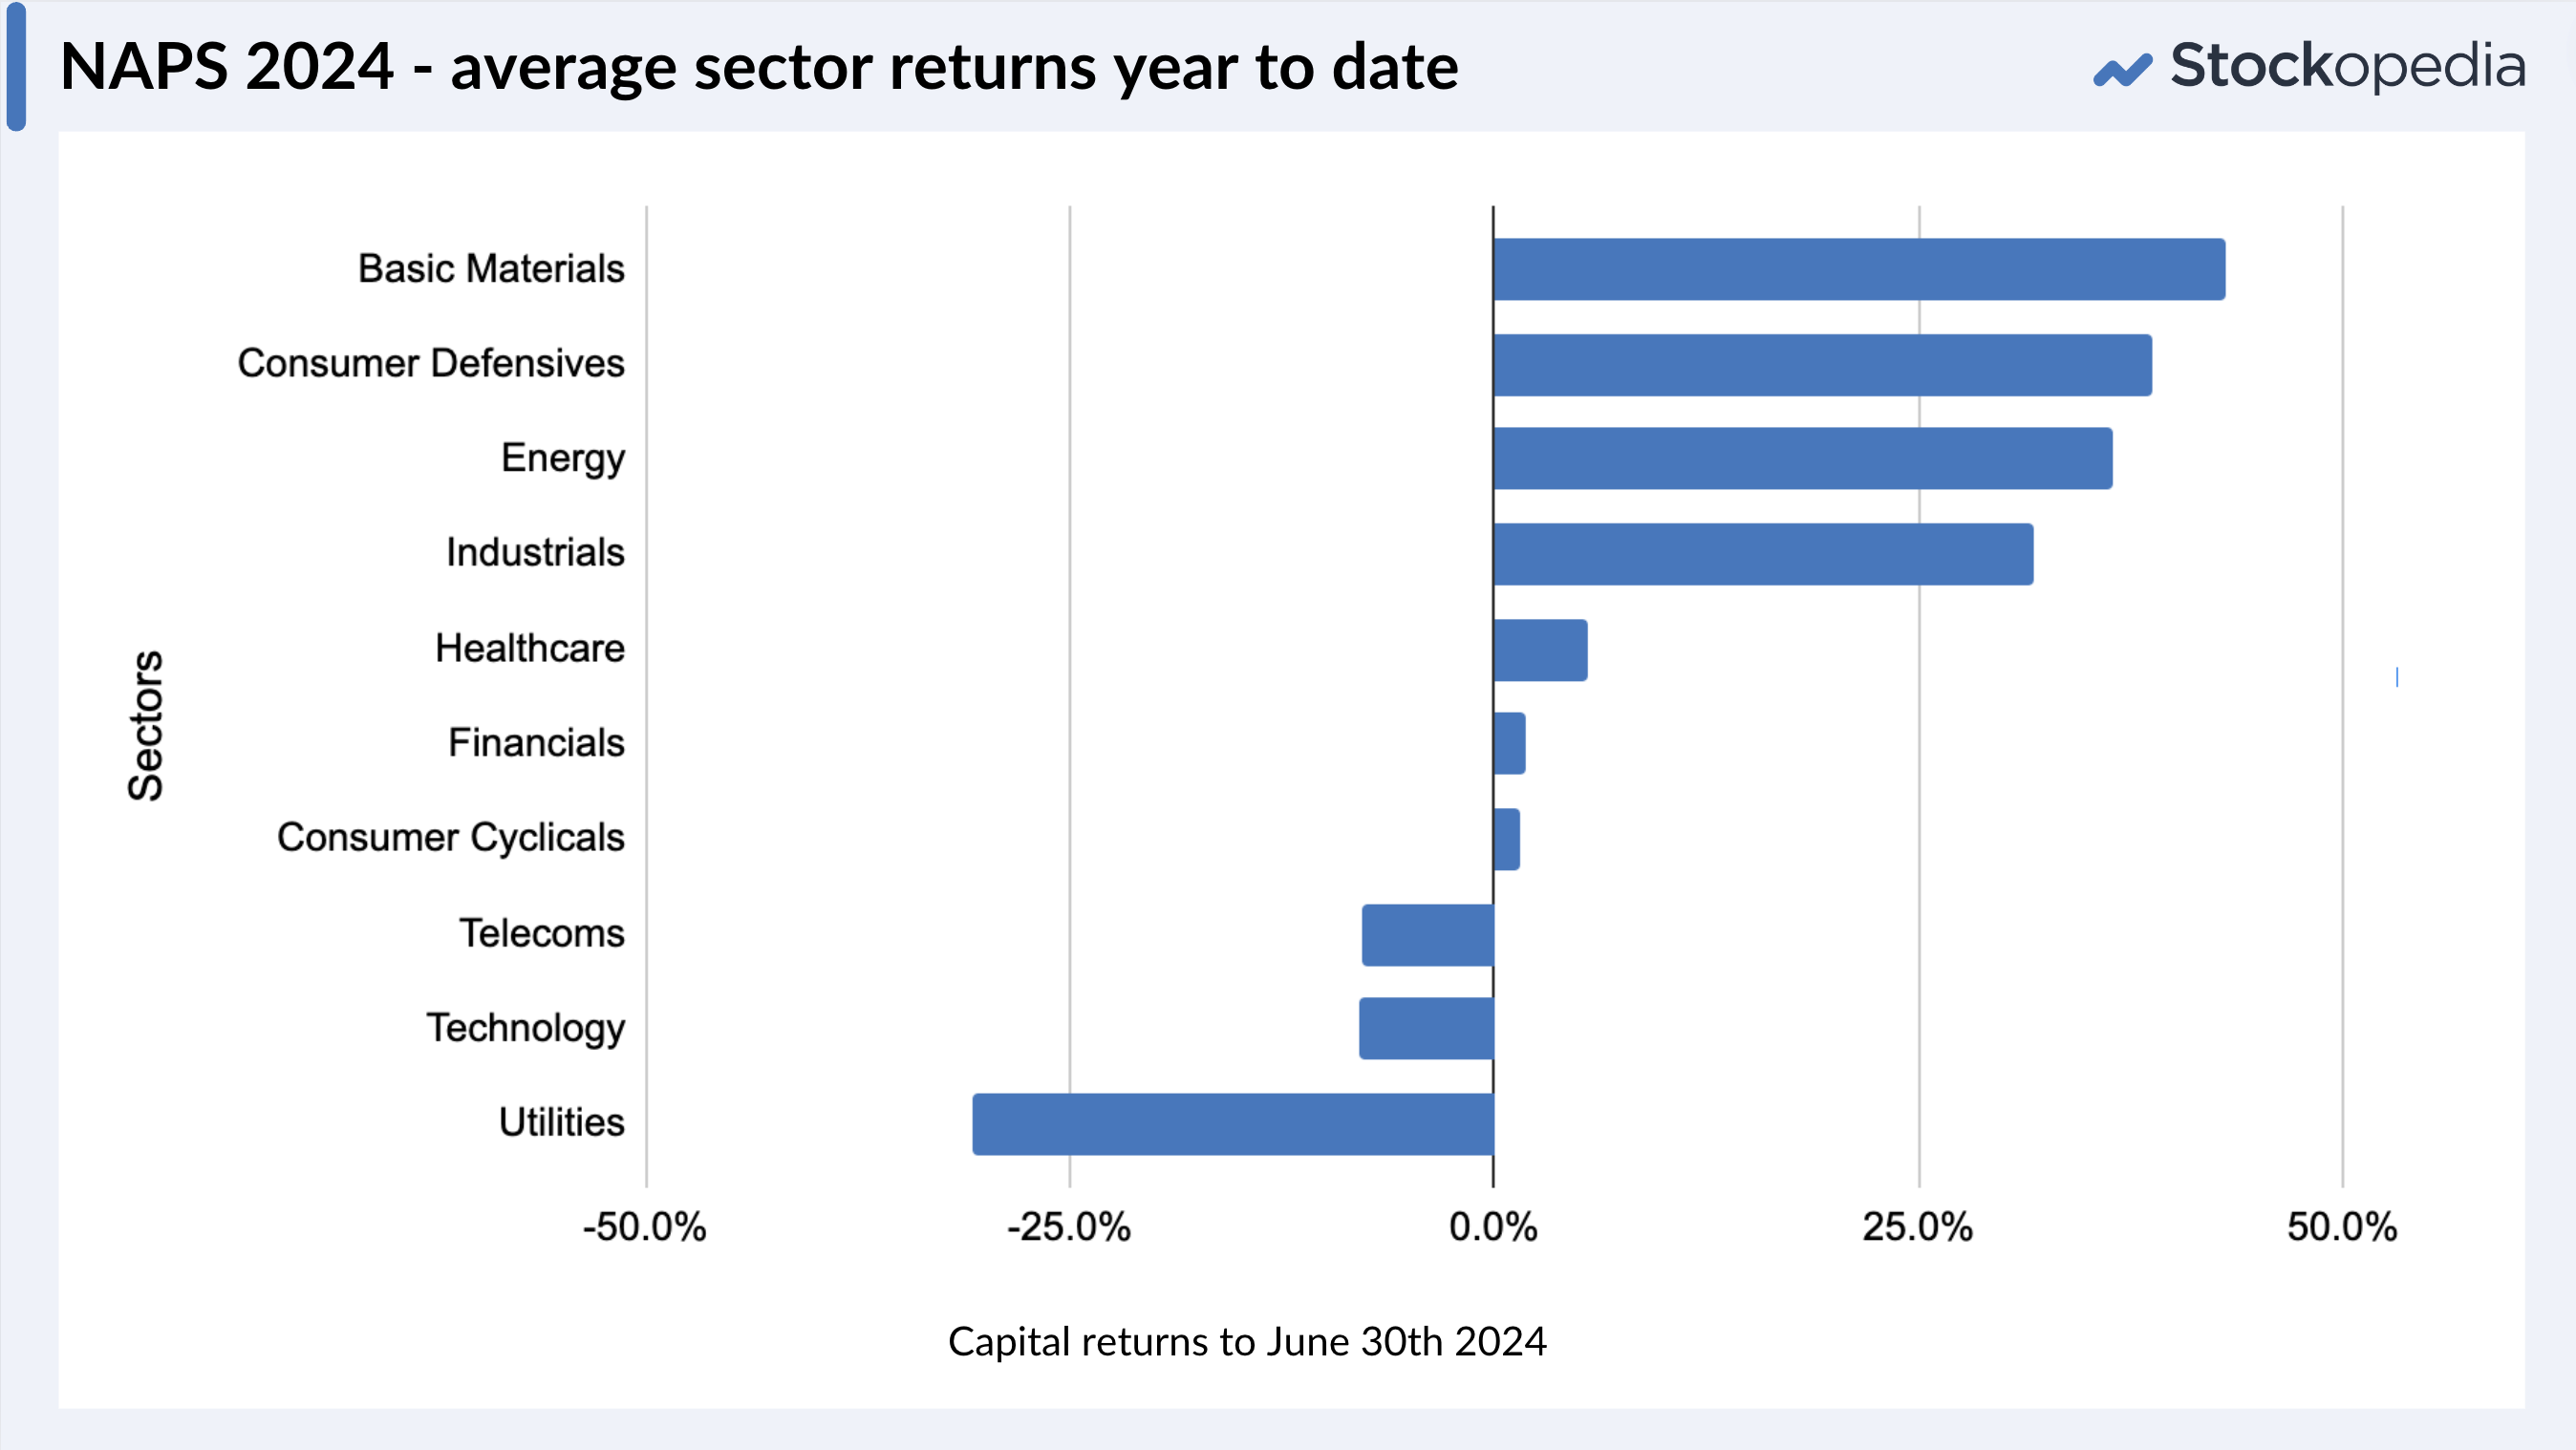
We’ll close with this year’s SNAPS portfolio (The Semi-Year NAPS) according to the above rules. There are a few observations about the list:
- There’s a stronger skew to small caps (11) in the below list. More cautious investors should adapt the rules to avoid this if implementing a similar process.
- The average yield is 2.3%, which does cover the average bid-ask spread at 0.85%. Serabi Gold (LON:SRB) and IG Design (LON:IGR) have the widest spreads at 3% and 4% accordingly. Always be mindful when investing in higher spread stocks that there is a cost of entry. Limit orders can help.
- These stocks are on average up about 75% over the last 12 months. As there’s a momentum component of the StockRank this will regularly be the case. I always need to remind myself that Value and Momentum are the two most powerful forces in investing. Do check out the webinar if you need a refresher.
Ticker |
Mkt Cap (m GBP) |
Stock Rank™ |
Sector |
GSK (LON:GSK) |
62880 |
85 |
Healthcare |
BT (LON:BT.A) |
14053 |
87 |
Telecoms |
Kingfisher (LON:KGF) |
5023 |
99 |
Consumer Cyclicals |
Greencore (LON:GNC) |
821 |
98 |
Consumer Defensives |
Computacenter (LON:CCC) |
3246 |
96 |
Technology |
Keller (LON:KLR) |
1020 |
99 |
Industrials |
Centrica (LON:CNA) |
7225 |
97 |
Utilities |
Morgan Sindall (LON:MGNS) |
1298 |
99 |
Industrials |
Gulf Marine Services (LON:GMS) |
186 |
98 |
Energy |
Bakkavor (LON:BAKK) |
897 |
98 |
Consumer Defensives |
Smiths News (LON:SNWS) |
151 |
99 |
Consumer Cyclicals |
McBride (LON:MCB) |
242 |
99 |
Consumer Defensives |
International Personal Finance (LON:IPF) |
299 |
98 |
Financials |
Renold (LON:RNO) |
142 |
99 |
Industrials |
Intercede (LON:IGP) |
87 |
92 |
Technology |
ECO Animal Health (LON:EAH) |
86 |
84 |
Healthcare |
B.P. Marsh & Partners (LON:BPM) |
193 |
98 |
Financials |
Enwell Energy (LON:ENW) |
65 |
95 |
Energy |
Serabi Gold (LON:SRB) |
50 |
100 |
Basic Materials |
IG Design (LON:IGR) |
198 |
99 |
Basic Materials |
Safe investing and do let me know your own thoughts in the comments below.
Disclaimer
This is not financial advice. Our content is intended to be used and must be used for information and education purposes only. Please read our disclaimer and terms and conditions to understand our obligations.

24 comments
Hi if a stock has been in your naps/snaps portfolio for a year and still seems highly rated (firmly in naps/snaps territory) do you sell out and swap it for something else or just sit on it.
CMC Markets (LON:CMCX) is a classic in my portfolio, a reminder that to make capital gains one must choose very wisely and buy low to make a start to begin with. I bought firstly in October 2020 at 336 pence from whence the price went downhill until I doubled-down BIG TIME at 108 pence in August 2023 having bought small amouts along the way, then CMC Markets turned around and now the share price is back to where it all began for me. Looking for an exit now, the S/R of 94 and Mom of 95 are what is keeping me in. I have set Stop Loss at 254 pence and feel safe with my cost-of-share being 178 pence. What could possibly go wrong?
The rebound on Friday was unexpected after a few days of declines. The question is whether it continues to rise on Monday morning. It may be time to top slice, after a spectacular rise this year. Would welcome any thoughts.
I wouldn't think so at all, no. The small cap rise has only just begun after three years in the wilderness. Top slice what and put the money where?
Lest one needs a reminder that the course of true love and stock picking success is largely a statistical thing mcb proved it this morning!!! The volatility in the price is truly awesome
Edd,
Maybe I am missing something in the diagram for "Turchin's double spiral of well being and elite overproduction" but it shows 'popular wellbeing' rising steadily through the 1940's. I can think one particular thing that happened in the early half of that decade that most definitely did not lead to an increase in, what I would consider, 'popular wellbeing'.
I may have the wrong end of the stick here, but at a cursory glance, the diagram seems to fail the basic logic test.
Jeremy
I may have the wrong end of the stick here, but at a cursory glance, the diagram seems to fail the basic logic test.
A glance at Turchin's criteria shows why popular wellbeing is likely to have risen through the 1940's, particularly after the end of WW2. The four criteria it uses to measure "popular wellbeing"are:
Basically the data fits the definition, which is all Turchin's model is saying.
What the model also predicts is that periods such as today's, where popular wellbeing is reducing and elite overproduction is increasing, ultimately lead to political instability, often resolved by revolution or war driven by demagogues adopting increasingly extreme positions in order to generate a mass following. To be fair to Turchin he predicted this in 2010.
The solution is basically to raise living standards, which in the UK's case probably means restricting immigration and broadening the availability of the living wage. To make that work we need investment in automation to drive increases in productivity, and given the short-termist nature of our investment institutions that probably needs pump priming by the government.
timarr
Interesting, thanks Timarr.
I get the basic logic in the point Turchin is trying to make, I can argue with a few of the assumptions above, but possibly my arguments aren't enough to derail the overall upward movement in wellbeing.
I never put too much faith in models like this, having studied Economics for six years you soon realise that the assumptions that underpin most models are unrealistic or too simplistic, granted that is often due to the sheer complexity of the issue. I suspect this may well be one of those issues that is too intricate to allow for modelling. There are simply too many variables, immigration, pandemics, wars, dictators, natural disasters etc. to allow a detailed prediction.
On a superficial level his predictions may be accurate. I would need to study it more to assess whether they hold true on a deeper level, and more broadly than just the UK.
Interesting nonetheless. Thanks for replying.
Hi Jeremy
There are simply too many variables, immigration, pandemics, wars, dictators, natural disasters etc. to allow a detailed prediction.
Turchin did actually predict a pandemic ... :-/
But I agree, there's a definite whiff of fitting the model to the data here.
timarr
Thanks Ed. I’ve operated the Naps portfolio for four years now with a large part of my SIPP - so real money! It starts and ends mid August, therefore approaching the end of the fourth portfolio. Year 1 +28%; Year 2 -25%; Year 3 0%; Year 4 (to date) +20%. For the past few years I stuck to the QM/VM model but will revert this year to QVM, as you have done. I have wondered whether the time of year the process begins has any bearing, but although it throws up different stocks (largely) to the ones you pick it doesn’t seem to make any difference to the overall outcome. The process does also highlight stocks I wouldn’t necessarily come across otherwise and I do keep some on after the portfolio ends. Recent examples would be ME International (LON:MEGP) and Georgia Capital (LON:CGEO) . I was also stuck with Ros Agro (LON:AGRO) for reasons you so eloquently describe above! I’ve also found it a good way to educate myself about sectors and companies I would otherwise know nothing about. In the past I have, on occasion, banked some profit but i now let everything run the course of the year. Thanks for the system - a great way to diversify and learn while growing, well most of the time, anyway!
I agree that it’s all about good risk management at the end of the day.
A couple of ex holdings of mine in there McBride (LON:MCB) and IG Design (LON:IGR) and a couple that I am looking at the moment but not quite convinced yet Enwell Energy (LON:ENW) and Intercede (LON:IGP).
Protectionism and deglobalisation are unpredictable and the consequences could be devastating. What will happen if China retaliate and decide to sell their US and European bond holdings?
Thanks for the article very interesting indeed.
All the best
Could Stocko IPO an investment trust based on this NAPS portfolio? Maybe subscribers here could become investors. I can. It will help stocko grow a bit as a company.
@prem14 - "Could Stocko IPO an investment trust based on this NAPS portfolio? Maybe subscribers here could become investors. I can. It will help stocko grow a bit as a company."
Quite possibly. It's not something planned currently, but I have assessed this a few times over the years, and moreso this year. There are more options now (ETFs, UCITs, AMCs etc), but the regulatory burden is much higher post Woodford, and so are the costs.
Thanks Ed, I bought Turchin's book.
Many thanks for the update, Ed.
Have you given any further thought on whether the NAPS portfolio will continue in 2025 and beyond?
Daniel - yes it's the ten year anniversary in 6 months. We will be reviewing the next steps for the NAPS. I'm sure it will continue, but we may morph the approach in some way. I'm keen to see us mature into delivering a few model portfolios in a more visible way for subscribers.
Ed, I'm very impressed with your Trended Momentum Stocks portfolio which I'm following. Thank you for this, I have renamed it Ever-rising Risers.
Hi SM, after digging around the Stocko website I can't find any reference to an article on Ed's trended momentum screen. Please could you point me in the right direction. Thanks.
Ed's trended momentum article is here. https://www.stockopedia.com/content/didnt-buy-warpaint-why-clear-uptrends-are-the-best-uptrends-and-20-stocks-to-consider-now-998505?order=createdAt&sort=desc&mode=unthreaded
Pleased that 'stehuk' picked the answer out for you Acorn, I've been trimming our hedge, an annual event. Good luck with what ever you do.
SilverMoon - it does seem that the Trended Momentum portfolio has continued to trend northwards.
It's up +6.5% since the date of publishing (30th May) versus a flat FTSE All Share and AIM down almost 2%.
Where do I go to find how the NAPS portfolio is currently performing ytd?
Thanks
I track the New Year NAPS in a portfolio here - it's up 21% YTD.
How is SNAPs performing this year? Not got this set up my folios, there have been quite a few fallers recently.