The winning traits of the StockRanks

As a financial journalist covering hundreds of FTSE companies’ financial results every earnings season, I listened in to a lot of investor earnings calls. The larger companies sometimes hosted a separate call for journalists, but I always liked to attend the investor briefings - juicier questions were asked.
But those questions tended to follow a similar pattern:
Host: “The first question comes from Mr X at Morgan Stanley.”
Mr X, Morgan Stanley: “Thank you for your presentation Mr CEO, I’d like a few more details about your cash flow in the coming year. What projects can you see absorbing significant capital?”
-
Host: “Thank you Mr X, we’ll now go to Mr Y at Barclays”
Mr Y, Barclays: “Thank you, I would like to address my question to Mr CFO. Do you anticipate positive operating cash outflows in the coming year?”
-
Host: Thank you Mr Y, we’ll now go to Mr Z at JP Morgan
Mr Z, JP Morgan: “I appreciate you taking the time Messrs CEO and CFO, is there any more detail you can provide us about your capital expenditure plans in the coming year and when the investment will begin to generate operating cash flows”
-
And so on. Down through HSBC, Goldman Sachs, Merrill Lynch and Credit Suisse. Big investment banks get to ask their questions first, they get the most exposure to management and consequently, they have the highest potential to gain an understanding of the way the companies they report on work.
It’s a deal which works just as well for the companies as it does for the banks. When the time comes for a company to raise money, the bankers who have had their questions answered and have gained an understanding of the company’s plans and outlook are more likely to help sponsor the fundraising.
Meanwhile, the research notes that these banks produce are a much sought-after source of knowledge, sentiment and truth in the markets. Encouraged by disclaimers and regulation, which insist that institutional research is independent, private investors can’t be blamed for believing that the analysts at the big banks know how to pick stocks best.
The following chart might therefore come as something of a surprise:
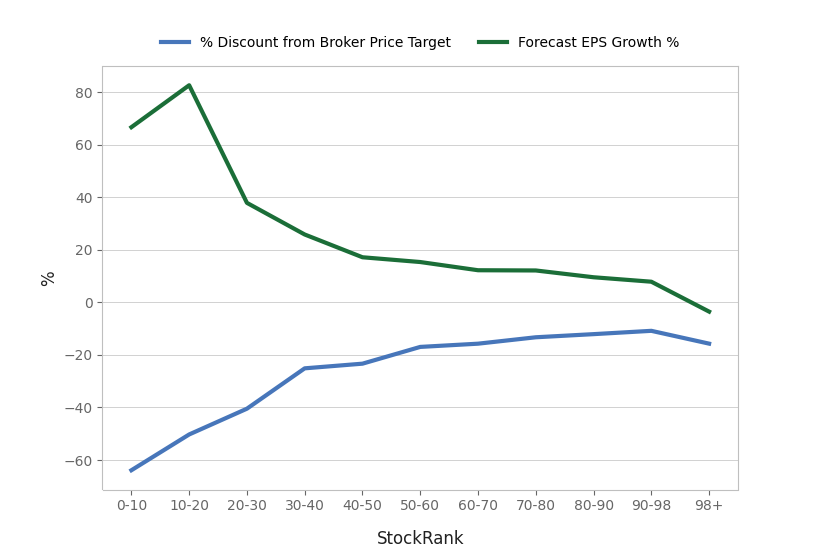
It shows that stocks with the highest forecast EPS growth and most ambitious price targets set by brokers have the lowest StockRanks. By contrast, Stockopedia’s highest ranked stocks are less highly regarded by the brokers and analysts. These companies typically have very narrow discounts to their price targets and uninspiring earnings forecasts. Indeed, the highest ranked stocks with a StockRank of over 98 have negative average earnings growth forecasts.
And so, you may ask, does this mean the StockRanks are faulty?
StockRanks: A valid source of truth
To assess this, let’s back up a bit and assess the traits of highly ranked stocks.
The chart below shows the StockRanks split into deciles on the horizontal axis and three measures of profitability on the vertical axis:
- Return on assets - the percent of profits generated by each £1 owned by the company
- Return on equity - the percent of profits generated by each £1 of assets and liabilities (a company’s total equity)
- Return on capital employed (ROCE) - the percent of profits generated by each £1 invested by the business
Higher percentage figures are illustrative of a more efficient and profitable company. Experienced investors use these measures to identify stocks to add to their portfolios. Warren Buffett for example, uses a ROCE of over 20% as a key trait of the stocks he picks.

The chart shows that higher ranked stocks have higher ROCE, ROA and ROE figures than their lower ranked counterparts. The highest ranked companies display a ROCE higher than 20% - the sweet spot for investors hunting for high quality companies. For companies with StockRanks lower than 40, these metrics are negative, meaning the stocks aren’t profitable.
It’s also important to assess whether these metrics persist overtime - a one-off year of high profits isn’t much good if it can’t be sustained, while a blip in a single year isn’t necessarily something to be concerned about.
The chart below shows that higher ranked stocks display higher ROCE, ROA and ROE metrics over a five year average.

Put plainly, higher ranked stocks are better at squeezing profits out of the money they invest in the company.
They are also better at squeezing profits from sales, as demonstrated by the below chart which shows the StockRanks on the horizontal axis and two different profit margins on the vertical axis:
- Operating Margins - the percentage of profits generated from sales after all expenditures on the day-to-day running of the business
- Net Margins - the percentage of profits generated from sales after all costs (including tax and financing) have been accounted for.

Lower ranked stocks once again show negative figures, meaning they are loss making at both the operating level and the bottom line. Higher ranked stocks are profitable and margins are slightly higher for the highest rankings. This upward trend is, however, less pronounced than it is for ROCE, which suggests that the highest ranked stocks are even more efficient at squeezing profits out of their assets.
Are the analysts wrong?
So if high ranking stocks are the most profitable - ticking the boxes for the quality metrics that the top fund managers look for, why aren’t analysts more enthusiastic about the outlook?
To answer this we need to assess the primary purpose of the sell-side analyst industry and the highly-revered research notes that they produce. Although analysts are independent of the companies they write on, they are often affiliated with the investment banks that help those companies raise capital. Research notes are especially valuable when a company is required to raise funds - analysts set higher forecasts and price targets to help generate hype for a company prior to a fundraising.
This is reflected in the fact that lower ranked stocks are far more likely to raise money than higher ranked stocks. The chart below shows that share dilution (caused when a company lists new shares) is substantially higher for lower ranked companies and virtually non-existent for the higher ranked ones.

How you can take advantage of that
And so, while it’s best not to put too much faith in price targets and earnings estimates, private investors can use these notes to their advantage: higher ranking stocks (which generally have lower price targets) are more likely to deliver a pleasant surprise on results day.

And when they beat their earnings forecasts, analysts tend to upgrade their earnings forecast.

Which, in turn, leads to share price appreciation.
Surely companies this good are really expensive?
Thus, the highest ranked stocks exhibit the highest profitability metrics, they are the least likely to raise new money and most likely to beat their earnings estimates as laid out by brokers and analysts.
And yet, they’re not ridiculously expensive.
The chart below shows StockRanks on the horizontal axis, plotted against three measures of value on the vertical axis:
- Price to sales - the value investors place on the company compared to revenue generated
- Price to earnings - the value investors place on the company compared to earnings generated per share
- Price to free cash flow - the value investors place on the company compared to free cash inflows

It shows that the highest ranked shares offer generally better value than the lowest ranked shares.
It is worth noting that many of the lower ranked companies are unprofitable, which skews the P/E and P/FCF ratios. But even for the StockRanks higher than 50 (which the profitability charts higher up show are generally associated with profitable companies), valuation multiples decrease as StockRank increases - the lower the ratios, the more cashflow or profits you can buy for the share price. The companies with a StockRank of over 90 have a PE ratio of less than 10 - a major discount to the FTSE.
Too good to be true
Thus, highly ranked stocks are profitable, growing, and undervalued by the market - traits that successful investors spend years hunting for.
But don’t get too excited - the StockRanks aren’t a one-stop solution that will help you identify the perfect stocks. Indeed, if we screen for the traits identified by highest ranking stocks in the charts above, we end up with zero results:
- 5yr average ROCE > 20%
- 5yr average ROE > 20%
- 5yr average ROA > 15%
- Operating margin > 22%
- Net margin > 15%
- Earnings surprise > 8%
- 3 month change in earnings forecasts > 15%
- P/E < 10x
- P/FCF < 10x
- P/S < 5x
So what’s going on here? Stockopedia’s founder Ed Croft explains the StockRanks in the quote below:
“There is no high StockRank stock that individually displays all of these traits. Each displays only some of them, but also has a few nasty individual warts that ward off purchasers. The top-ranked list often includes ugly issues like pawnbrokers, spinoffs, foreign listings & recovery stocks.
As most investors buy their stocks individually, they just can't swallow the warts. And herein lies the great mistake. They forget that it's the averages that pay off in a portfolio. The warts smooth out when we swallow the frog whole.”
In other words, a portfolio of highly ranked stocks exhibits the traits that investors crave and are almost impossible to find if you hunt for them on a stock-by-stock basis.
Disclaimer
This is not financial advice. Our content is intended to be used and must be used for information and education purposes only. Please read our disclaimer and terms and conditions to understand our obligations.
11 comments
Hi there,
Would like to ask whether you can screen for
I've looked for the metric but cannot find it. The only on I can see is Change In Broker Consensus which I can set to 3m but this seems to be the change in the 1 to 5 scoring for the Broker Recommendations rather than Earnings Forecasts and doesn't look to be a %.
Any help would be appreciated.
Add Rule/Analysts/EPS Upgrade FY1(2)
then select 1m or 3month
Thanks for that. Much appreciated.
Hi Megan, Good article. I'm have a question about the graph & statement showing "higher ranking stocks are more likely to deliver a pleasant surprise on results day". Maybe I'm being stupid (most likely) but if the stock ranking reflects the positive surprise then the graph will describe what has happened rather than forecasting positive results due to it's ranking. Is the data sequential so that the positive surprise data point is post the calculation of the stock rank data point in this graph?
Very interesting article.
In the past Stockranks predictive power for USA stocks not as good as for FTSE. So is there any work being done to improve the algorithm for USA stocks? Perhaps there is a sector that is problematic that is skewing the results like Energy Partnerships or REITs for example (I have no idea, just uninhibited speculation).
"In the past Stockranks predictive power for USA stocks not as good as for FTSE"
Depends on what timeframe. If you look at the results of the US StockRanks since the pandemic low... the decile sequence is almost perfect. 90-100 ranked stocks have returned almost 140% in the USA since then. Value investing is back, and the V in QVM has driven results. A regime change has come.. In the UK, the 90-100 ranked set has only returned 89%. So there's a massive US outperformance.
Yes I have found i have Analysis Paralysis many times........and then sit and don't act- which is a mistake in itself.
Although there are a few analysts I understand and trust I am sceptical about many. I was a lending risk analyst for a foreign bank in London and a friend was an investment analyst elsewhere in London producing those documents on her specific worldwide industries. Sorry but many of those draft analyses that I saw for comment were poor. Fluent in a few languages she had mistranslated some facts, her knowledge of some national characteristics affecting foreign assets sometimes left much to be desired. IMHO one needs to know the individual analyst well.
Very useful. Management briefings are a double edged sword. They cannot disclose inside information but they are able to spin a story of how bright the future will be. It is well known that story stocks usually disappoint. Mature profitable firms tend to be boring, their glory days are behind them. But they continue to throw off cash and give few nasty surprises. I know which type of firm i would prefer to invest in.
Great article, thanks Megan. After some 5 years of investing, my experience is that statistic stock selection is best for my 'core' investmnet strategy and I have been testing out selection using the StockRank as a core criteria, with good results.