Go-Ahead (LON:GOG) has just completed a Bullish Gartley pattern from the 2010 lows on the monthly charts
Could it be a good time to buy!
Any thoughts?
Go-Ahead (LON:GOG) has just completed a Bullish Gartley pattern from the 2010 lows on the monthly charts
Could it be a good time to buy!
Any thoughts?


Moving away from the charts, it might be worth looking at Go-Ahead's core bus market. The Bus Services Act 2017 devolves powers to local authorities to create partnership schemes to improve local transport. Amongst other things, it allows them to re-franchise bus routes in their areas. Bearing in mind that the £6 billion bus market is dominated by Arriva, Stagecoach, Go-Ahead and National Express collectively controlling around 70% of the market, there is a lot at stake. However, the powers are only devolved in areas that have opted for an elected mayor. Outside of London, Go-Ahead has about 7% of the UK bus market. This appears to be an industry ripe for a shake-up and the markets may be anticipating it.
Hi TangoDoc
I look at charts in daily, weekly and monthly time frames and the Gartley pattern appeared visible on monthly chart, no other reason
Regards J
Hi LongValue
So, I guess what your saying is that the act opens up competition from smaller local companies, and maybe several operators competing for a smaller slice of the cake, or even franchises being split and shared to more than one operator! You seem to be in the know. I’m also interested if anyone has an opinion on fully automated trains as I believe this may be the future! Obviously this would be a major boost to train operators in respect of profitability due to labour costs and disruption to services caused by industrial action. Go-Ahead (LON:GOG) also quote that they intend to expand their offering abroad as they feel more profitable opportunities may be available. Your thoughts and views would be most welcome. I guess there will be some big winners and losers emerging when the dust settles.
Regards J
What an unholy piece of unmentionable excretion is that Gartly chart. Gartly fartly more like! There's nothing bullish up there at all.
Dump that Gartley nonsense and promise to never let it see the light of day for as long as you shall live. It's a piece of [insert smelly rude word].
Don't recognise those highlighted ratios and as soon as I looked up that Gartley rubbish online it says it's based on the Fibonacci ratios. Online I could instantlly recognise the Fibbo ratios - but that's not them up there. By the way is that the (non-offensive) Bollinger Bands in the light blue background by any chance you have there?
Right, better make a start.
First what's not showing above is a fuller picture. What's the long term trend?
Well let's see.
The SP hit it's highest point at the end of 2015 and from that point to this day it's been on a (now established) long-term down-trend. Lower highs, year after year. Best way to describe the price action is, imagine standing at the top of some stairs, now drop a very bouncy ball from the top. You'd see it bounce down off each step, bouncing up quite high before falling back to bounce off the next descending step and so on until, well the bottom of the stairs? The bottom? Don't think so.
But it is still bouncing down those stair steps. With the ball bouncing back up high after each descending step catching out all and sundry who thought "Ooh here we go, here we go." Only to be hopelessly dissapointed months later as the SP came back down to land on the next step down.
2700p-odd down to Friday's 1398p over the past 2 full years! And about to carry on the same for a third? Ouch or what?
So let's look at some numbers because you have to ask what on earth has caused that much loss in the SP?
And there it is! Thought so before I even looked!
- 2018 estimated revenue is forecast to come in lower than 2017
- and worse 2019 is forecast to come in lower than 2018!
Profit is the same sorry bouncing ball down the stairs story.
!!Need to stop here. Sorry. - I'll carry this on tomorrow as got to be up early tomorrow. PS. If you're intent on buying this hold back a while. If that 1398p doesn't close down further by Monday's close I'll be a monkey's uncle (candlesticks) if it doesn't, get some blackened bananas ready to throw at me :)
PS. Look at the "stupid" Yield in relation to the P/E ratio - the market is using a loud hailer to tell you something there. And it's not good.
Don't even know what Gog is or what they do.. Is it a bunch of train drivers or something?
While perhaps I wouldn't phrase it like Velo, I agree with the sentiment. Go-Ahead (LON:GOG) has reported some weak, declining results as of late and the forward looking estimates show serious declines in estimated profits and EPS. To me, the market is showing pretty clearly its view of this company; it is currently in decline and there is likely more bad news ahead. The dividend yield creeping up to the P/E is a big red flag.
Owning franchises is a fairly fickle business and, as we have seen historically with Go-Ahead (LON:GOG), can be easily lost to other operators. I suspect the risk of this, as well as the potential prospect of a Corbyn government (not a political statement on my part, purely a reference to a plan to potentially nationalize these industries) will also weigh heavily.
Final obvious statement but don't be drawn into something that has lost 50%; it can quite easily lose a further 50% on your investment (catching falling knives etc). If you are minded to buy in, I would wait for the sentiment re this stock to improve.
I do like to keep my word, but it's gone 1:00am after a very long day, as I type. So sorry won't be able to finish the second half of my post above (and I do have quite a bit to add).
The overnight futures are up and belting away as I type, so that jibe of mine that Monday will see a fall in GOG's price may not occur. (I'll still take the bananas though :)
Intend completing the 2nd part of my post by Monday evening latest. Nothing worse than promising something and failing to deliver.
I can’t enforce highly enough how I agree with Velo and willhampson in respect of using chart patterns in isolation.
I look at charts to try n identify areas of interest where other potential investors/traders may be looking at or considering entering a trade, It’s that simple.
I’ll consider views on the Gartley pattern and long term trend later. I do like the analogy of reading the sp as a ball on some stairs though, I’ll put that one in my strategy check list.
When it comes to analysing statistics I have a preference for working with fact. Revenue rising from 2,424, to 2,572, 2,702, 3,215, 3,361, 3,481 CAGR of +7.5% with revenue estimated to fall by 7% in 2018 and a further 15% in 2019. My view is that this information is well known to investors and already priced in. Industrial action and issues with the Southeastern rail franchise are predominately causing this weakness. One point I will make in respect of analyst forecasts is that it's a difficult task, how often do analysts have a consensus view? And historically how accurate are they! It’s like looking into a crystal ball, hence the adoption of screens to profit from earnings surprises.
So the low PE high dividend yield conundrum. I guess were referring to a value trap here, a quick look at the Stockopedia algorithms don’t seem to concur. Typically a value trap will have a good value rank and poor quality rank. Go-Ahead (LON:GOG) has a quality rank of 80, Value rank of 94, QV of 96 and sits at the top of its industry group.
Stockopedia quantitative research algorithms classify Go-Ahead (LON:GOG) as contrarian stock one of the winning styles.
That’s the beauty of Stockopedia it concentrates on quantitative research, what is known (fact) as opposed to Qualitative Research, what we think we know (fiction).
More on contrarian style shares here
https://www.stockopedia.com/co...
More on winning styles here
https://www.stockopedia.com/co...
However let’s not forget that estimates aren’t accounted for, so yes Go-Ahead (LON:GOG) may one day become a value trap!
Dividend yield
It’s always difficult to buy high yielding share as they are cheap due to poor market sentiment, and of course things can get a lot worse. However, also difficult to ignore, as historically dividends have accounted for a considerable percentage of historical returns in the UK stock market! Proving sentiment does change with time. Some savvy investors are collecting a 10% + dividend yield from Go-Ahead (LON:GOG) currently.
Other red flags, the low Z-Score
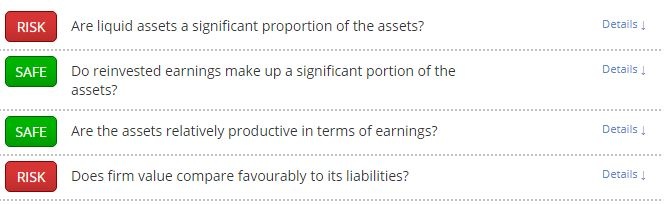
With Go-Ahead (LON:GOG) one can’t expect liquid assets to be a significant part of assets due to capital tied up in fleet
Does the firm’s value compare favourably to its liabilities? It is evident that Go-Ahead (LON:GOG) has an undesirable EV compared to Market cap, however compares favourably with industry group rivals and has a very low EV to EBITDA. More on EV/EBITDA in link below. (This may of interest to investors using stockranks with the S&P 500) would interested on your views here!
https://www.wallstreetdaily.co...
Go-Ahead (LON:GOG) has also delivered on debt reduction with debt of 87.5M being transformed to cash 231M. If that can be repeated the cash will be almost equivalent to Market cap
Other quantitative research algorithms that consistently beat the market suggest that Go-Ahead (LON:GOG) is favourably valued. Go-Ahead (LON:GOG) qualifies for Richard Beddard’s Nifty Thrifty screen. The screen sorts shares by magic formula rank and limits results to the top 30 after eliminating poor Piotroski F-Score shares. Go-Ahead (LON:GOG) qualifies in 13th place. I'm not promoting the screen here only the quantitative research.
Thanks to willhampson and LongValue for highlighting the risk associated with Go-Ahead (LON:GOG), namely the regulatory, franchise and political risk. All of which I acknowledge and need to be considered. The risk is there for sure, the devils advocate may ask has the risk to public transport changed that much since the first services ran in the UK and what does the future hold? Who knows, but what is evident is the need for transport infrastructure to be improved and it’s a big priority to politicians. Motorways are being modified and reclassified as smart motorways. (Loss of the hard shoulder to establish additional lanes) Once the hard shoulder goes what next? New roads, improving the rail network (HS2) or both. We’re nearly at the stage where motorways will need to be reclassified as car parks. The associated cost of owning cars is also becoming prohibitive for young drivers. The need for public transport due to road congestion and the ever increasing population has probably never been greater and will be with us for a while yet. It’s also good to see Go-Ahead (LON:GOG) recognising this regulatory and political risk by shifting its focus abroad.
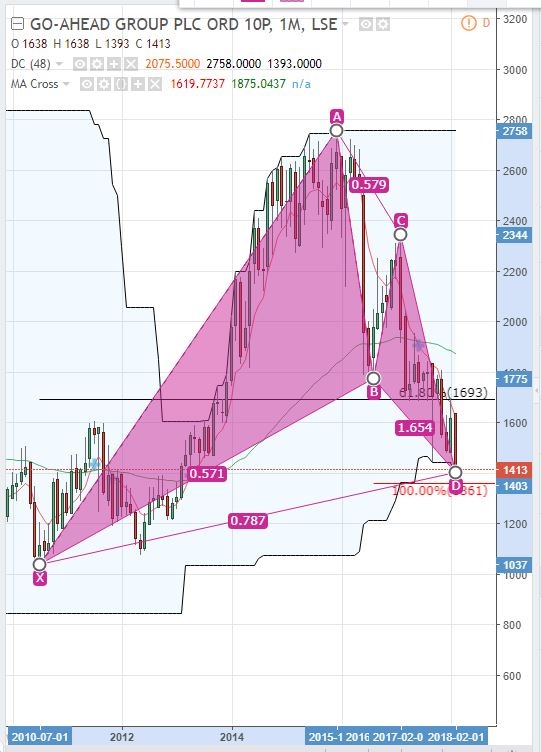
Also mentioned was the long term trend so let’s have a look with trend line inserted! Note an additional Gartley pattern is also visible on the long term charts.
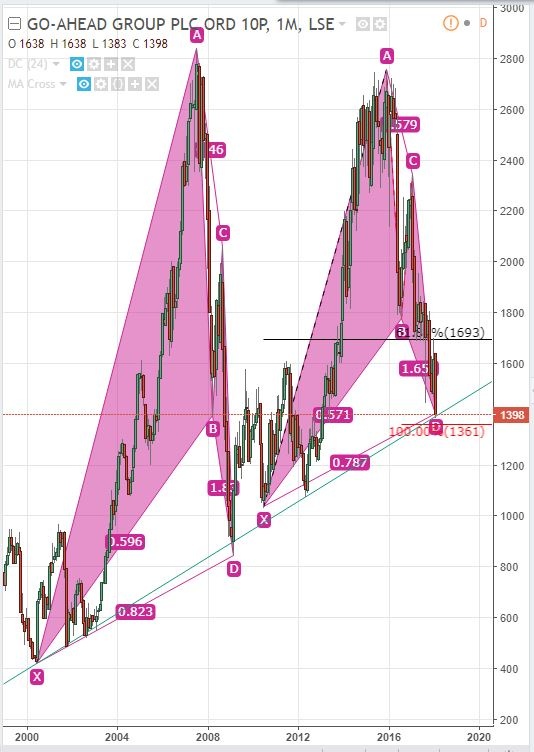
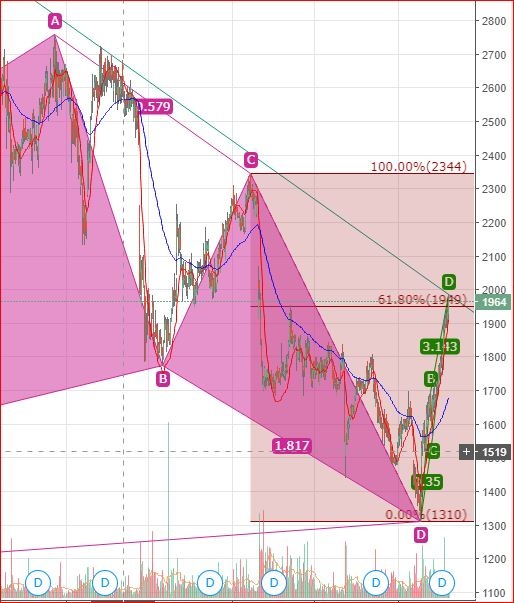
What about the validity of the Gartley pattern, yes it is quite correct to challenge the validity of the Gartley as point B did not retrace to exactly the .618. It reaches the .571, so the .618 is the closest recognisable fib ratio. The fib ratios I have on the chart are nothing to do with the Gartley pattern. The .618 is there to gauge the validly of the fib ratios as it didn’t quite touch it at point B. The red 100% fib designates an area where the pattern will have a reduced chance of success based on trend line, potential reversal zone (PRZ) and relates to the AB=CD pattern however establishes a fib confluence in the PRZ.
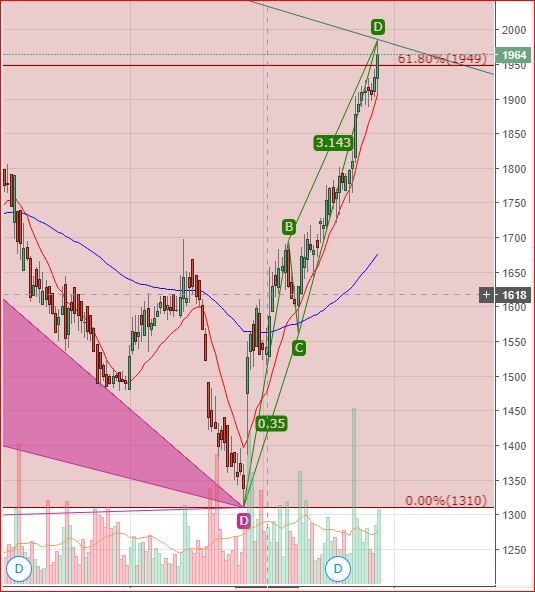
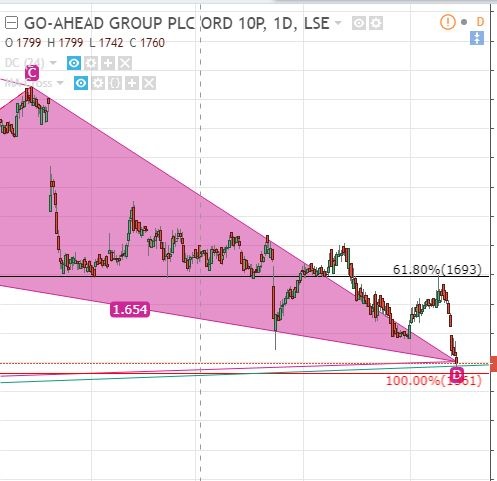
This is how price reacted at the .618 fib
Anyone interested in chart patterns should visit this site.
http://thepatternsite.com/Gart...
This link takes you to the Gartley pattern and gives precise ratios and acceptable ranges and potential outcomes including success rates as a percentage. However take these with a large pinch of salt as the pattern will have reversed at point D. There will have been many more where the share price fails in the PRZ at the .786 fib ratio. Anyone interested in harmonic patterns specifically should read Scott Carney works, his interpretation of the fib ratios are slightly different to Thomas Bulkowski’s e.g. acceptable ration for BC retrace .382 to .886 with the BC projection not exceeding 1.618.
A look at charts proves that the fib ration don’t have to be exact another Gartley pattern was evident on the long term chart of Go-Ahead (LON:GOG) as seen above (first image)
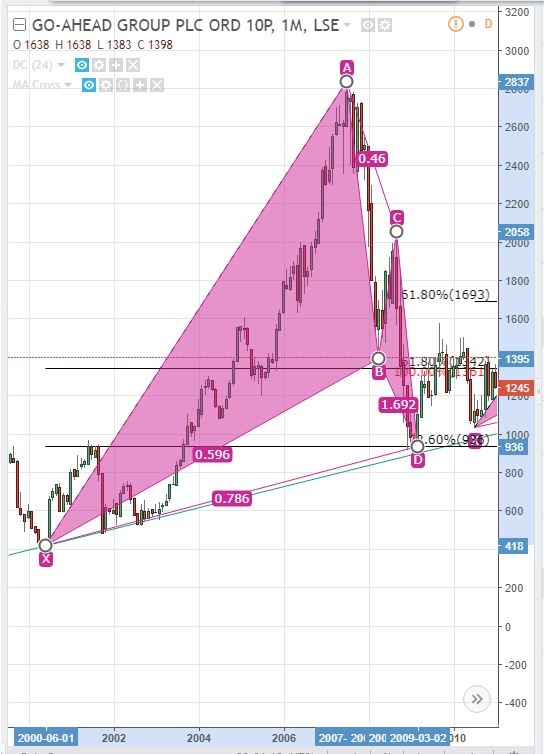
This Gartley pattern formed between June 200 and March 2009, the fib ratios are very close to that in play today! Just shy of the .618 at point B and completes just below the .786 at D. These patterns are evident far too frequently in the markets to be random, one sure thing, history is the only guide we have to the future! The savvy investors who traded this Gartley are now collecting a 10% + divided yield on their investment. Compound 10% annually and you double your money every 7 years. That’s a lot of interest going back to 2000 and I’m guessing they may be looking at accumulating more shares at the moment.
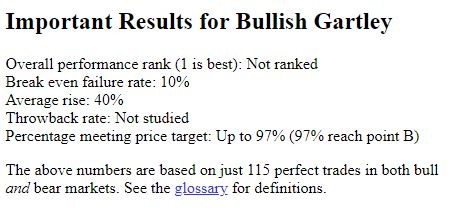
This is Thomas Bulkowski’s conclusions on the Gartley pattern, take a look at the percentage meeting price target evaluated in both bull and bear market.
At this point I want to reiterate that charts should only be used to identify areas of interest and used in concurrence with fundamentals and trend changes. One should absolutely wait for a reversal signal and confirmation.
In conclusion I don’t do crystal balls and have no idea what the share price is going to do Mon, but I do know what the risk to the downside is. I also know what the chance of a retrace to point B is, should the price react and change direction at the trend line and fib .786. I also know that Go-Ahead (LON:GOG) has an attraction to and tendency to react at fib ratios, look at the price at the .618 fib! Also anticipate the possibility that trend may accelerate to the downside should price fail in the PRZ
Thanks to all for contributing in a decorous manner and willhampson for highlighting the exception. At the end of the day discussion boards should be places where subscribers promote conversation and enhance knowledge also a place for debate and disagreement, however ranting and raving discourages people from contributing and suppresses collegiality which should be one of Stockopedia greatest benefits. Here’s a great video on collegiality. Nothing to do with stock markets
regards J
Quick visit, as never finished my post. So, to tie up loose ends and in essence to answer the question of this blog - Yes it may soon, be time to buy - from a strictly trading-only standpoint, but not as a long term investment.
SP-wise, it's just in the process of landing back down on one of those staircase steps and is ready to bounce up, and off from it. Based on it's previous crimesheet, the bounce will be impressive and induce opinions of something akin to bullish confirmation bias, as it steadily rises, perhaps for a month or more; but it will IMO be a false rally insomuch it remains to be seen if "anything different this time" is in the mix. If it's a case of the same old-same old, then I won't be surprised to see the coming bullish SP 'bounce' eventually fail spectacularily and bring the SP back down, way, way, much further below than where it resides at present - IMO.
Hence my opinion yes, it is looking to rise - but should be regarded as useful for a swing trade only. It's been deep in oversold territory since early Feb, after the latest retrace got underway in late January (and hence it's recent continual retracing downtrend to date). However, I believe when most indicators are all in agreement, it's time in purgatory will be over and the SP will recover dramatrically.
As I said, it's deep in oversold, so it may be another week or so before it lifts out of it. But, pursing lips, I'd hazard a guess that I would be most surprised indeed if the SP was not out of oversold condition by the end of this month - For swing traders looking to ride the imminent uptrend only, that is.
Still don't like that Gartly thing - why not use the real deal, the original - the Fibbonacci retracement tool itself?
Also, relying on just one indicator/oscillator/tool is asking for trouble. Where are the other indicators to back-up any opinion that Gartley monstrosity gives off? All TA tools can only ever hope for is a reliable, consistent level of accuracy - but they will ALL amaze you at times when they decide it's time to show you it's their time for a bit of "inaccuracy". Using additional tools to cross reference confirmation, helps negate any idiosyncrasies, as they all have idiosyncrasies.
Yes, one person's cheeky, tongue-in-cheek sense of humour may be another person's ranting and raving. It was ever thus :)
PS. If I'm available at the time, will return and post of, in my opinion, when the SP has crossed over and out of oversold, and thus, free to rise. It's going nowhere meaninful until the SP does that first.
Let us compare bananas with bananas:
https://www.stockopedia.com/compare/?tickers=LON:GOG,%20LON:NEX,%20LON:FGP,%20LON:SGC,%20LON:ROL
Hope the link works.
My previous post here, back in February, promised to return and finish the projections and progress of GOG, but I did say 'if available' so here I am at last, but at least anyone following the "story" of this paticular thread can check out the projections and dates and see by the actual trajectory of the SP and dates of the posts that we have been most fortunate on here on this occasion as everything appears fated to have followed a script based on the conclusions within the posts on here. Question is, did any of us back up our "theories" with actual cash on the table?
Taff6 - You originally asked in the header of your blog here - Is this a good time to buy GOG? on the 9th February, and after several posters and opinions I was wondering (and sincerely hoping) that you did go ahead (is that a pun?) and buy, as you should be circa almost 40% up in profit by now mid/late April.
In my last post of the 17th Feb I agreed it would be a good time to buy ONCE the SP had stopped retracing and moved out of oversold - and postulated that might be likely perhaps within "the next week" but definitely before the end of the month (February).
Hindsight now reveals that the SP did move out of oversold condition a week later and was rising steeply in the final days of February (and hasn't stopped rising ever since). So from approx the low 1300's it rose nearly 600p and tonight resides on the right side of 1900p
Taff6 - Did you go long, did you buy? Be great if you did and made some nice profit to date.
Although I ran out of time to come back here and post, I watchlisted it and monitored the SP continually. Based on previous momentum/history of the SP I "expected" a big bounce from somewhere just after the date of my last post (which was in the low 1300's) which it did; but by well into 1600+ I was convinced it was now all over and would now be entering the opposite condition (overbought) and be ready to complete the previous pattern history and fall back down again.
By 1700's it was IMO clearly entering overbought without any doubt whatsoever, and now due to retrace.
By 1800 I was shifting uneasily as the retrace was well overdue.
Then overnight it opened up virtually 100p up!!!
At 1900 every sign was of extreme overbought condition and apart from the last few days of levelling-out shows no sign of retracing.
- In fact I have to admit that sitting on 1900 it's virtually looking more like a break-out from my previous posts of the SP resembling a bouncing ball falling down a staircase. If it doesn't retrace soon (days - week or so at most) I'm prepared to yield and say the long term pattern of the SP resembling a descending "bouncy ball" is no more, pattern broken, and admit it is now in break-out territory, and thus making a new journey/future.
If, however on the other hand, it retraces steeply (which I see definite signs of, but trendlines are refusing to support me in that view) then I'll probably buy myself (99 Stockrank etc., Good divis, momentum like a run-away train) when/ if it goes back down to find a new low floor.
Impressed with GOG - and Taff6 please tell us you bought when you were thinking out loud of doing so. It would be nice to hear that at least someone made some money out of this near 40% rise in the past month or so.
Hi Velo, I think that some of the recent share price movement of Go-Ahead (LON:GOG) can probably be attributed to the recent takeover approach to First Group by Apollo (private equity).
Yes, ISA - fundamentalists always find a way to explain away technical successes - even though it was all laid out beforehand of what might likely occur to the SP in the previous historic posts. It's all there. In advance of it happening. Just read the previous posts :) :) :)
Just jesting with you there, ISA :)
- But this is one for the TA textbooks IMO - absolute perfection. How I wish it would be like that on every occasion. But if it happened like that on every occasion it would be the end of investing wouldn't it?
- Yes, that takeover approach appears to be the instigator of the unexpected break-out appearance the SP now resembles. (That wasn't in the "previous posts" was it? :)
That 100p overnight rise due to that approach was definitely, definitely, a shock to the system.
You write well.
When it is clear on paper it is clear in your head. Step 1 for successful investors.
Step 2 is taking action. I bought and now have sold. Already had a position so cannot claim 40%

Charts are fascinating but who knew that, given the national obsession with London and the South east, it could be possible to get away with high fares for hordes of commuters to central London once the roads became gridlocked?