Trend following the UK stock market - a timing signal update

With stock markets wobbly, it's a good moment to review the trend following model I've published occasionally over the last year. There is a well-known premise that asset prices have had a tendency to trend, and stock markets are no exception.
Brief primer on trend following
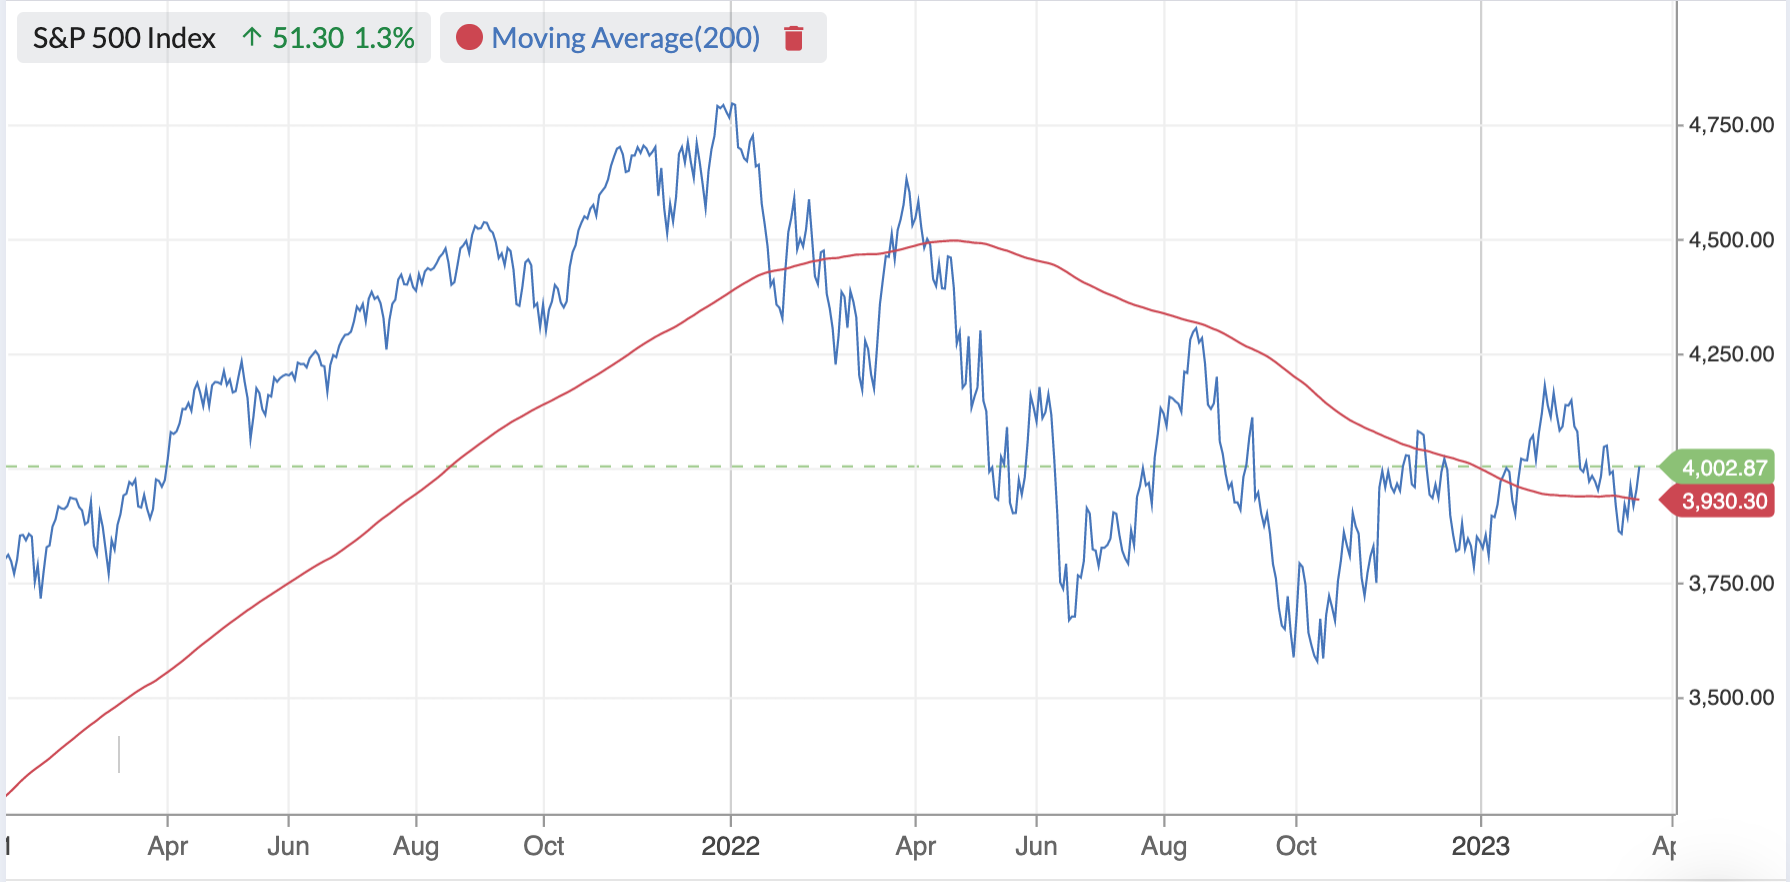
One of the simplest approaches to trend following is to compare the price of an asset (like the S&P 500) against its average price over a certain look back period. You buy the asset when the price moves above the average, and sell when it moves below. As prices change over time, the average is known as the moving average and can be plotted against the price in most chart packages, including ours.
Below shows the S&P 500 versus the 200-day moving average (200d MA).
There's been a great deal of research performed on the profitability of such an approach, with a particularly readable study by Meb Faber in "A Quantitative Approach to Tactical Asset Management".
He showed that in US markets between 1901 and 2012, buying the S&P 500 when it's above the 200d MA, and staying in cash when below both increases annualised returns (from 9.3% to 10.2%, and reduces downside volatility considerably (from 17.9% to 12.0%. Aside from these benefits, trend following reduces the maximum drawdown considerably (from 83% to 50%.
One great insight from Faber in a follow-up paper is that stock markets get far more volatile when they are below the 200-day moving average than when above. Not only this, but returns are lower too.
"On average, returns are 60% lower and the volatility 30% higher when the market is below 10-month simple moving average."
He reasons that humans use different parts of their brain when markets are downtrending than uptrending, which drives volatility in bear markets. Apparently, we use the same part of the brain that's stimulated by cocaine or morphine when markets are rising, but we use the flight response part of the brain when downtrending.
Applying trend following to individual shares
Of course, the above study was performed in the US and on a benchmark index - the S&P 500. Dealing in an index product like an S&P 500 ETF is pretty cheap, but if you are an investor directly investing in individual shares, then implementing a trend following system is trickier. The transaction costs of buying and selling individual shares based on the market index trend can eat you up. So what's the solution?
A good model is outlined in Andreas Clenow's excellent "Stocks on the Move". Clenow is a well-known investor, writer and pythonista. His book is a great read and recommended for any serious momentum investor's bookshelf.
He outlines an easily implemented approach that only deals on Wednesdays.
- He buys a portfolio of his highest-ranked momentum shares only when the overall market index is above its moving average.
- He uses some simple sell rules on the individual shares (if the share's rank falls below a cut-off, if the share falls below its own moving average, or if it has a 15% gap, he sells).
- If the overall market index drops below the moving average, he stops buying new positions. Cash is gradually raised when individual position sell rules are triggered.
- Cash is reinvested fully in new high ranked positions only when the index is above its moving average again.
Even without the market trend filter, the approach beats the S&P 500 handsomely 9.1% annualised return versus 5.2% return from 1999 to 2015 at lower risk), but with the market trend filter the strategy returns 12.4% annualised, with a maximum drawdown of only 24% versus 55% for the index.
A trend following rule of thumb
One of the great insights from Clenow's approach is that it provides a great rule of thumb for successfully navigating difficult stock markets.
Only buy new positions when the market is in an uptrend.
I know many on this site are bargain hunters, and downtrending markets serve up many bargains - so the above rule of thumb may not be popular. However, the maxim "don't try to catch a falling knife" is wise and worth remembering. Indeed, Meb Faber has shown that all stock market returns can be captured during uptrends, with lower volatility.
Discipline is everything.
Insights on the trend state of the UK stock market
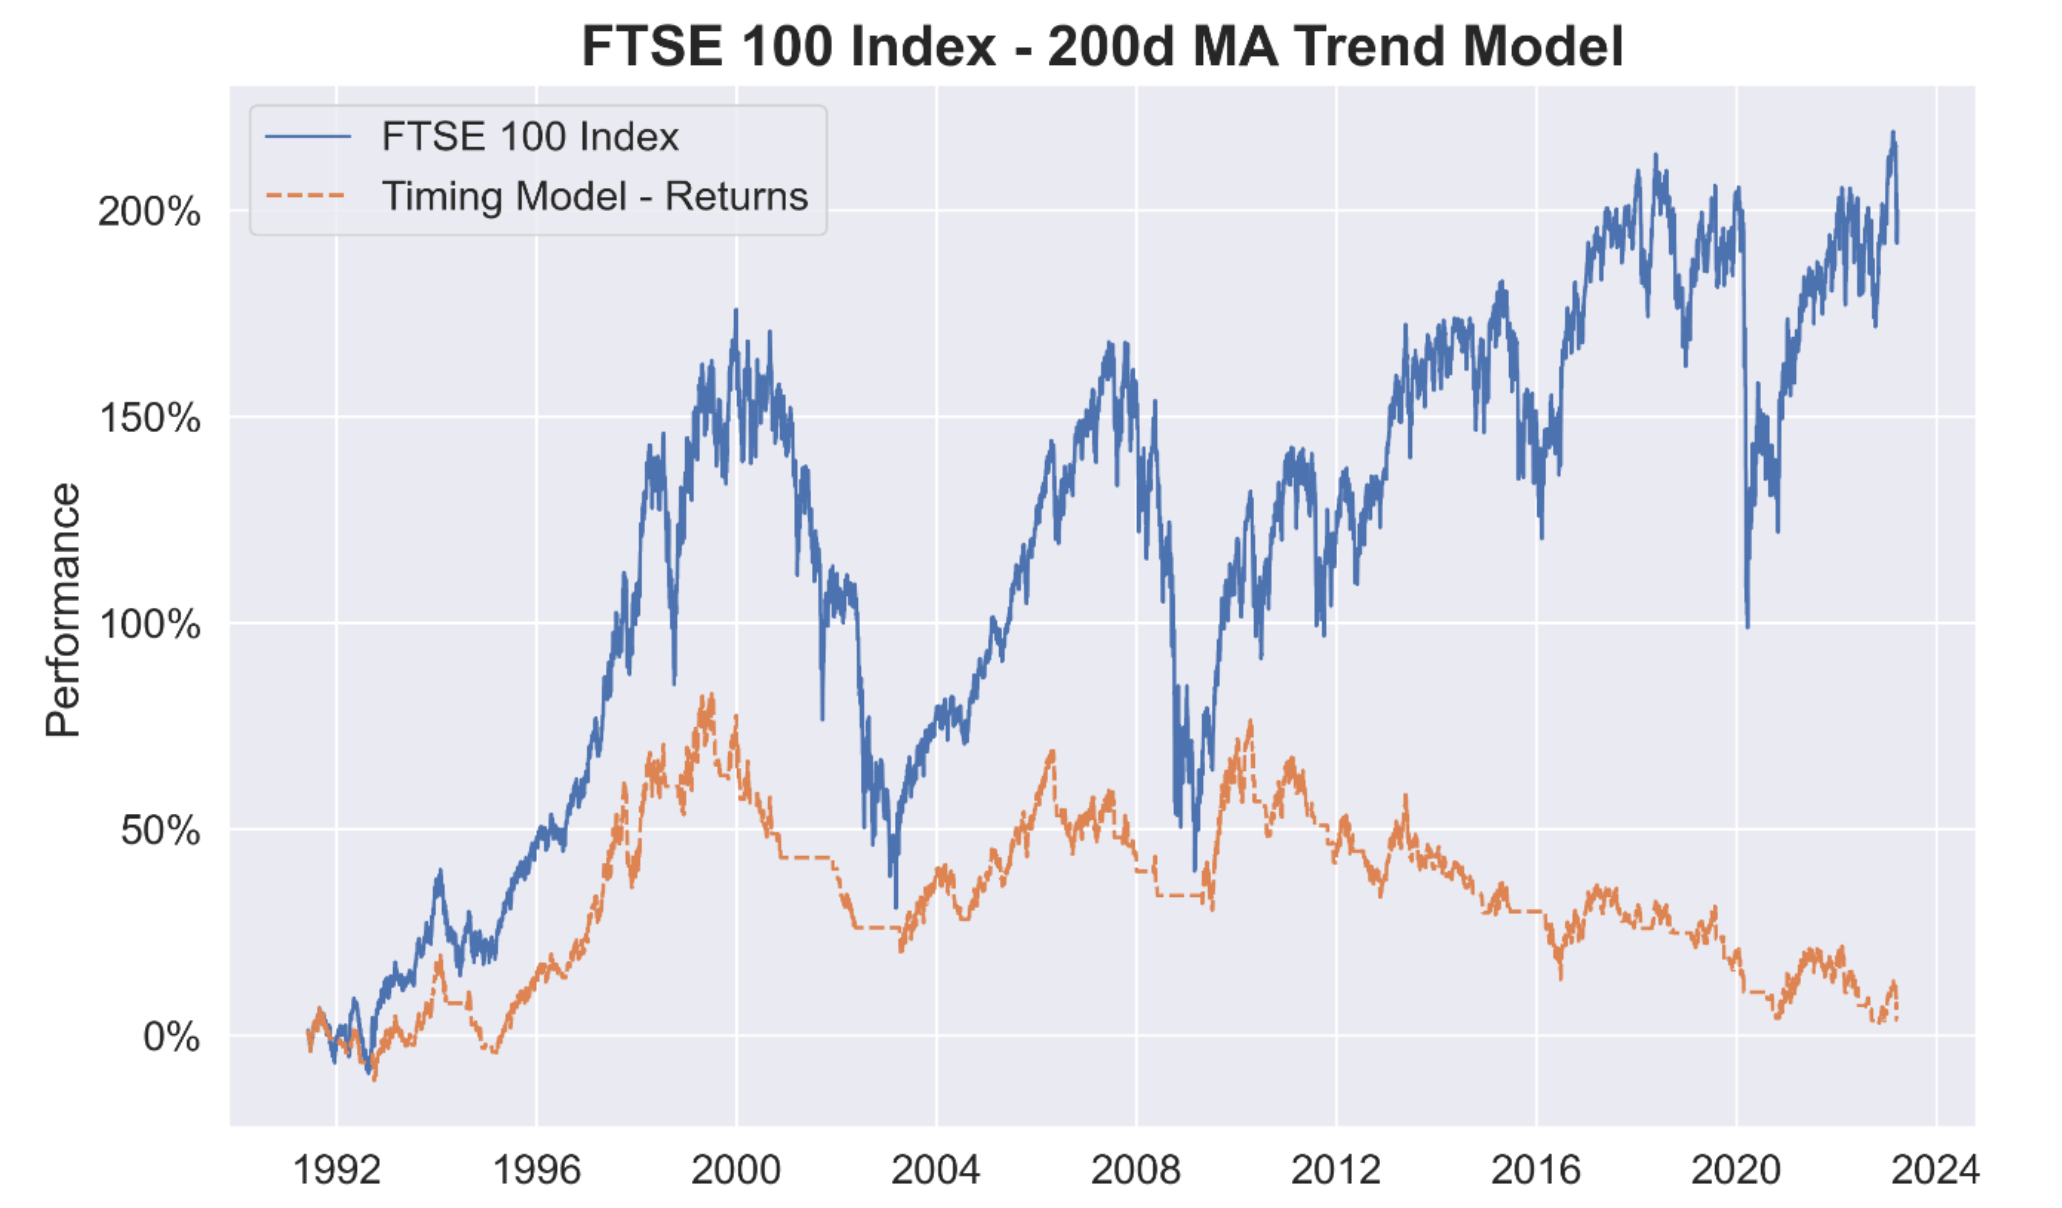
One of the curious traits of the FTSE 100 is that it hasn't given good trend signals for decades. Trend following the FTSE 100 has been a fools errand - or at least has been for more than 30 years. The UK bellwether index is really a dividend machine, and trend followers should give it a wide berth - see my backtest below in orange.
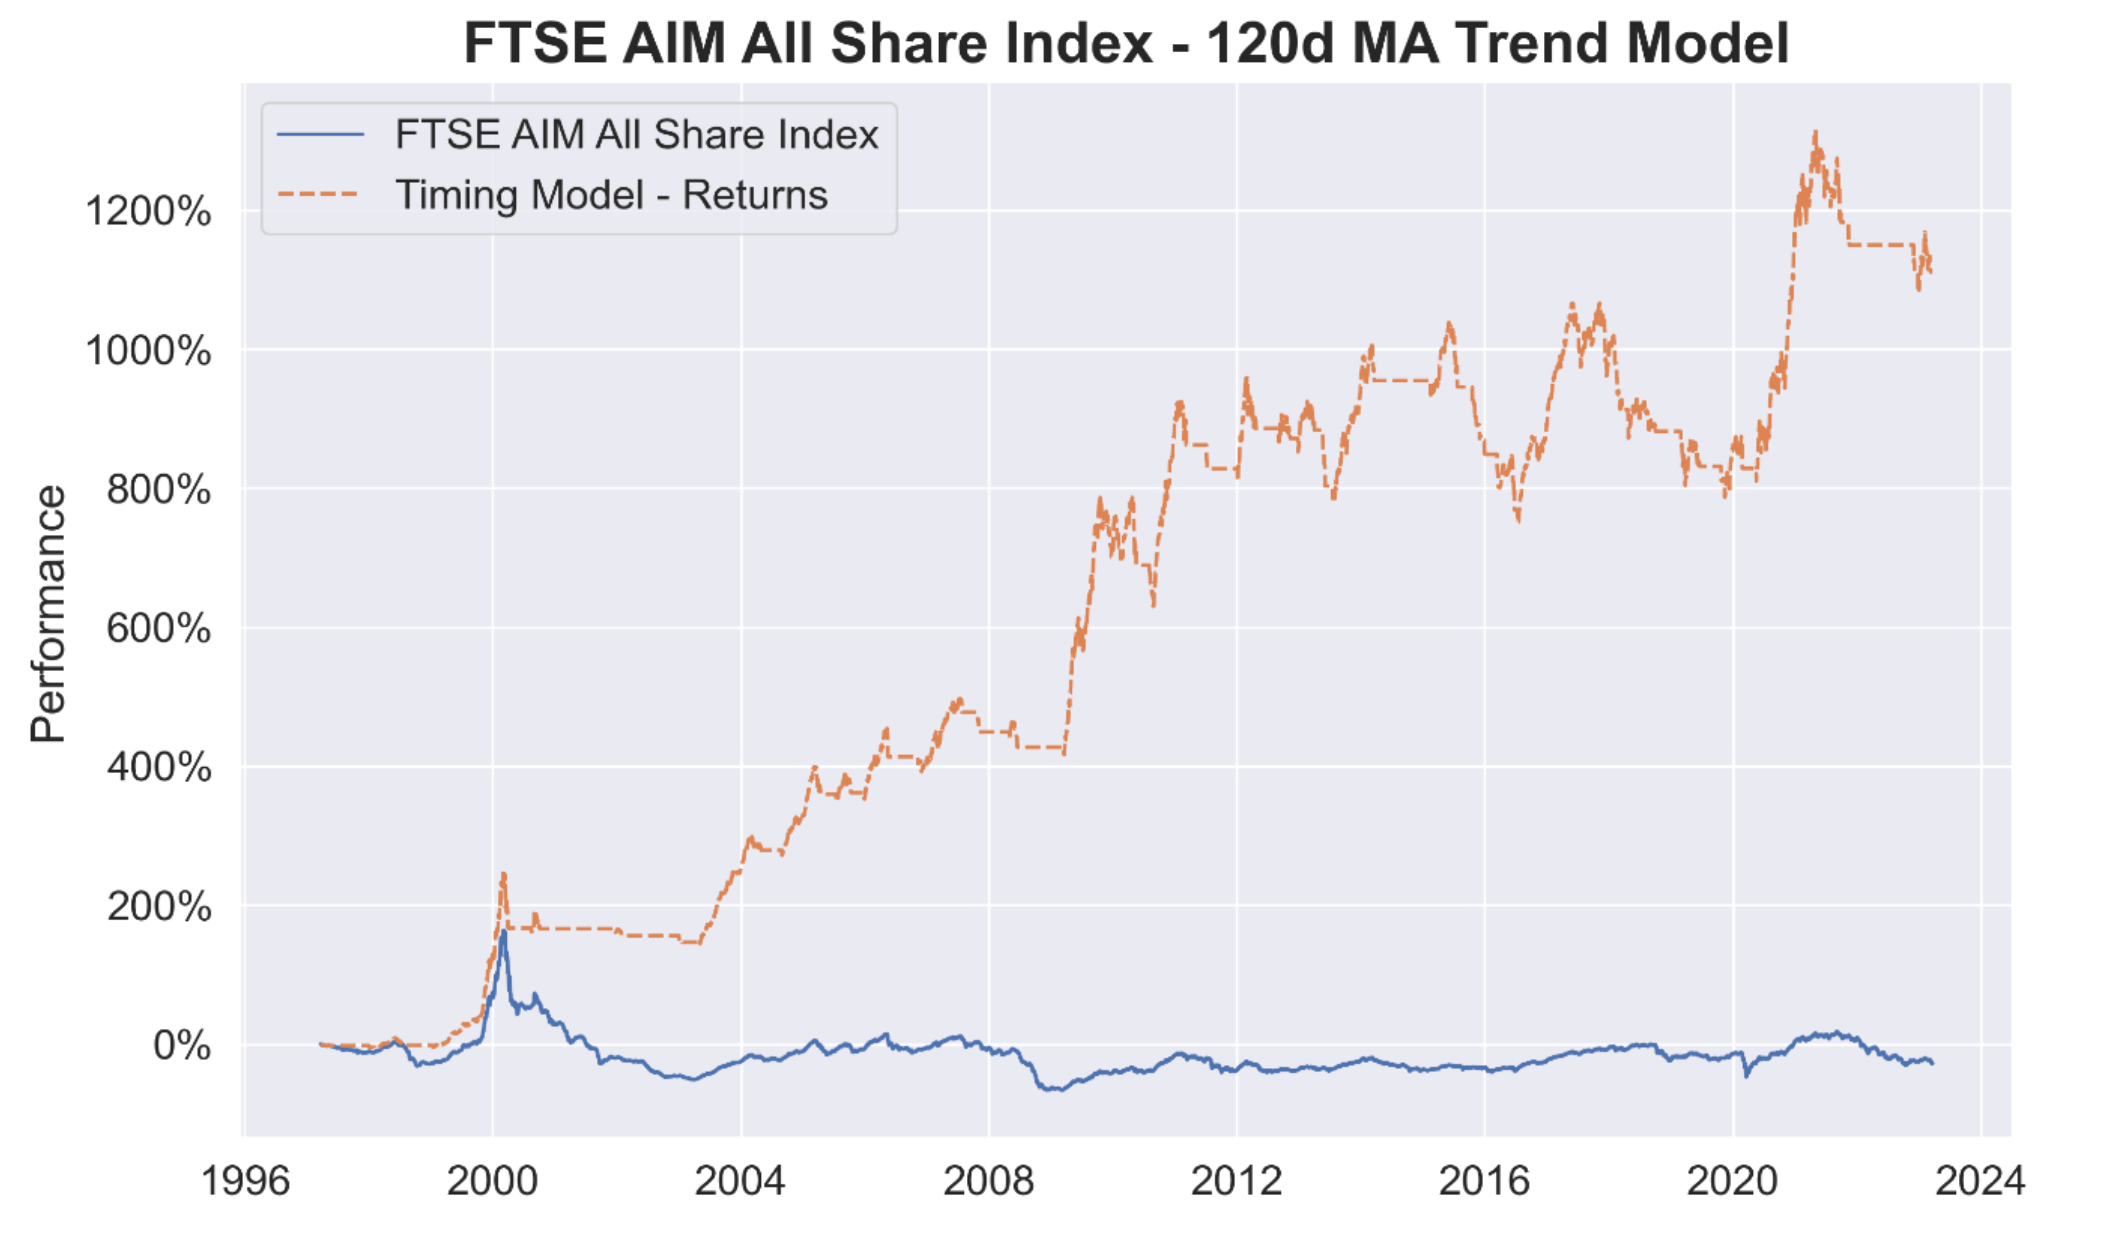
But as mentioned on January 13th, the FTSE AIM All Share - which is the aggregate of the LSE's junior market stocks - is highly sentiment-driven and trends rather beautifully at times. As explained in the article, I prefer to use the 120-day moving average on this index. While the overall index has lost money over more than 25 years of history, the trend following model returned 50x over that time period, which drops to 12x when adding a 2% transaction cost drag.
Of course, in downtrending markets, the trend signals can get a bit choppy at times. After a bullish signal on January 12th, we've seen a bearish signal on March 13th.
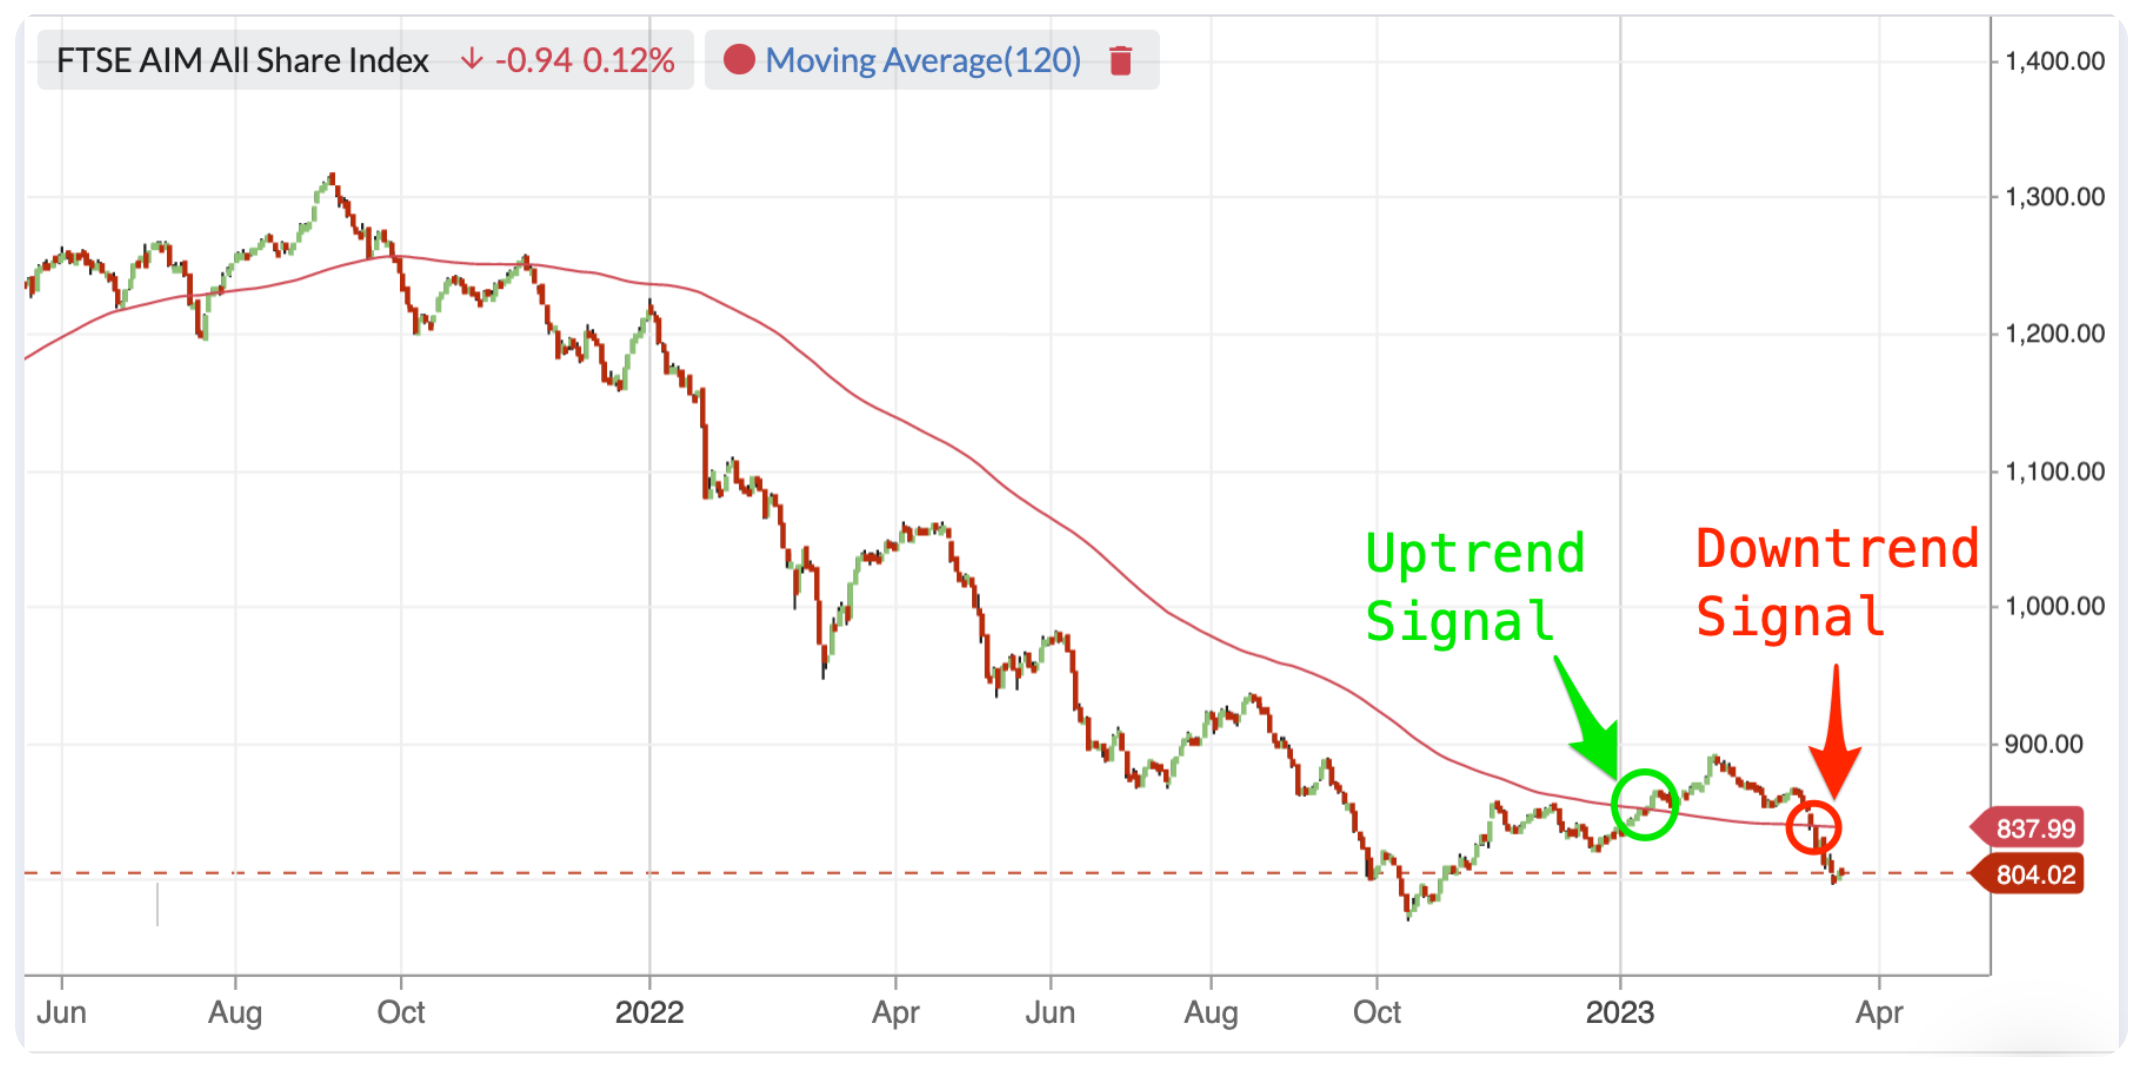
Previous periods like this have seen choppiness in both directions, and of course, with all the banking shenanigans, there's downside volatility risk. The US Federal Reserve tends to increase and decrease rates until it breaks things, and rarely pivots dramatically until something goes horribly wrong. Yes, SVB, Signature Bank, First Republic and Credit Suisse are signs of things breaking, but deposits have been generally guaranteed. How long this approach holds out I don't know.
So, what am I doing? Well, I initiated a new family portfolio on January 16th, just after the uptrend signal, investing 1/3 of the capital in a set of 6 value/momentum names. They did rather well, increasing 12% by March 6th - mostly due to Yu (LON:YU.) and Kitwave (LON:KITW) . But those gains have now been given up, with the portfolio now flat. My pre-intention has been to invest another third after 3 months, but only if the market trend filter is in an uptrend. As per Clenow, Faber and my rule of thumb, I won't be initiating any new positions until it does so.
Disclaimer
This is not financial advice. Our content is intended to be used and must be used for information and education purposes only. Please read our disclaimer and terms and conditions to understand our obligations.
35 comments
Trade the trend, I did it with both these and gone back into Yu. But top sliced in the current climate. No such thing as profit until realised and money in the bank!
Another great article. Love the Psychology Venn Diagram. Where can I find the AIM 120 day moving average most easily please? Thanks.
I'm very much in sympathy with most of this -- I also like Meb Faber and Andreas Clenow, and I'm also running a VM portfolio.
I just wonder if a simpler approach wouldn't be to run the VM portfolio without regard to market conditions, but to partially hedge market exposure by shorting relevant indices or ETFs in a spread-betting account when market conditions are inauspicious from a trend-following point of view. I don't do this myself, but I'm thinking maybe I should.
I know in theory it's less streamlined as an approach (why go long and short simultaneously when you can just be flat?), but I suspect in practice it's a more flexible approach, and probably easier psychologically.
If you can sit there & wait for 6 months for a signal to enter the market,then it goes againt you,you then sell to find good news as arrived ,market bounces strongly,you then find yourself on the sidelines deflated wishing you had stayed in the market.you then after a couple of weeks of beating yourself up & fomo kicks in you decide to enter the market.Your feeling part of the action now, then bad news arrives ,market falls heavily you are now feeling a bit of a fool & a waste of space, you then panic & sell out, repeat & rince.This is a perfect market for those type of actions,volatile , poor liquidity, etc.Good luck to any one who can master timing.
You can buy shares when they break above a certain point, say 150 Day Moving Average, then hold unless they drop below it. If you had done that on Yu (LON:YU.) and various others even last year, you would have done quite well, plus you would have got some dividends. Sitting on cash with next to no interest and inflation at over 10% is difficult.
Hi ed, Thank you for the absolutely amazing website Stockopedia. Would it be possible to have a UK Mid Cap value report like Paul's small cap one? A lot of reader wish to see this addition to stockopedia. Imagine how much this can attract people to stockopedia having a better liquidity in the mid cap with less risk like small cap and potential for multi bagging. Paul has kindly offered to cover some companies that are flagged by readers but, he barely can keep up with the small cap. If you can please have someone assigned to write about mid cap stocks, that will be amazing. Kind regards
Please Ed. Can you please consider this. Appreciated.
Yes please.
More and more of my stocks are FTSE250
Thank you Edward for an interesting read, I especially enjoyed the Match Style to Psychology diagram but I couldn't see Over Optimistic on it. I've caught so many falling knives it's a wonder I've any fingers left and I've risked two more fingers today by investing in Anpario and Eurocell. My ex-stockbroker friend said I was his reverse barometer on what he should be doing but I'm still hanging on in there, currently approx 50/50 cash/equities. Good luck with your family portfolio.
With the S&P 200MA model is there mileage in placing a short until it rises above the 200MA. For example if you had a £200k pot, buy the S&P etf with pot, and if below short the S&P at £50 per point in a spread bet account (assuming S&P around 4000) or use other shorting vehicle. Funding costs may be high, but if in cash for 18 months waiting for rise there is an opportunity cost.
Greyster
Timing articles like this one do generate some "but Warren Buffett does X - trend following isn't proper investing" comments. So perhaps I can more generally comment on this.
One thing I go over a lot in webinars, is that there are a variety of investment styles that are successful in markets. Strategy selection is very much a personal choice, and it's important to match your psychology and goals to your "factor choices".
Buffett is a Quality investor - as is Terry Smith. These investors do a lot of industry and moat analysis on high ROCE businesses and try to buy when prices are reasonable. Buffett bought Apple when it was on a PE of 10x and extremely cheap for the quality. The ideal holding period for these kinds of stocks is forever - if you have correctly assessed quality, moat, management etc. Quality investing, when done right, benefits from the reinvestment of company profits at high returns on capital - compounding at the company level.
But there are other factors that are just as powerful as Quality, but rely more on active portfolio management rather than buy and hold.
Value investing and Momentum investing benefit from compounding at the portfolio level rather than at the individual company level. Generally, holding periods are shorter for value or momentum investing (than quality investing) as they benefit either from valuation mean reversion, or from trend continuation.
My approach in the portfolio mentioned is to use Value & Momentum as return drivers. It's not a Buffett-esque Quality portfolio. There are no quality factors screened on.
Often, investors can be quite critical of each other's styles. But it's worth remembering that there are multiple routes to the top of the same mountain.
Ed, I have not seen the "Match Style to Pyschology" diagram before. Very interesting! Who created it? How was this derived? Is there any commentary or explanation to go with it?
That's one of my creations from the recent screening webinar - I am going to write up a blog on this soon.
Further to this - I actually got the frame of "Patience vs Bravery" from one of Andrew Lapthorne's classic pieces - he's Head of Quant at Soc Gen.
You may be able to access the PDF at this link
I talk the diagram through in the Screening Webinar - the overall webinar is quite introductory but you can probably skip forwards to 30:39 when I talk through this slide.
https://event.webinarjam.com/r...
Ed, Thanks. I caught up on the webinar to see the link to psychology part. Very good!
commenting so I remember to come back and view the webinar looks interesting !
Authors Richard Koch and Leo Gough discuss matching investing styles to personality quite extensively in their Financial Times guide Selecting Shares That Perform (10 ways to beat the stock market).
They write that investors can be divided into three personality types based on Professor Harold Leavitt’s study of human behaviour: the visionary, the analyst and the doer.
The book includes a personality test which determines which group you fall into and therefore which of the 10 investing styles best suit your personality.
.
Hi Ed, great to see these market timing articles. Interesting that the FTSE 100 is so bad at giving signals and that the AIM signals are more reliable. But I wonder if it follows that the AIM signals are only useful if you are buying AIM shares? If you use the AIM based trigger to trade bigger shares it'll probably be duff? Are you limiting your purchases to shares that are in the AIM index? I would be interested to see a calculation of returns using the AIM index as the trigger - but on share purchases and sales outside of AIM - perhaps mid-caps. It's possible that the trigger is good for the general market sentiment - rather than just shares within the index itself. Any thoughts?
@dfs12 - yes I am personally using the FTSE AIM All Share Timing Model more as a sentiment indicator than anything else. Given AIM is significantly traded by private investors, it's a great barometer of rising or falling "animal spirits".
Bull markets do depend on two primary factors - earnings growth and PE multiple expansion. Multiple expansion is driven by growing confidence - so the AIM sentiment/timing model is useful in this regard.
The family portfolio I mention is a new capital deployment. I waited more than 8 months from taking it over until first investment as the index remained below its MA and ground lower. It's preferable to have some kind of rule-based system when entering the market.
It's not an AIM only portfolio, so I'm using the AIM signal only for deciding investment entry point - but the selection pool is all UK equities. Selection is based on the VM Rank with diversification across sectors. (NAPS-esque)
Many thanks for the reply Ed. Very interesting.
The time to be buying UK shares, was October 2022 and then selling end of January, early February. As I said in January I did not have much confidence in the buy signal.
Buffett divides the economic world into two unequal parts: a small group of great businesses, which he terms franchises,and a much larger group of bad businesses, of which most are not worth purchasing.He buys stocks that are 1,needed or desired,2,has no close substitute,and3,is not regulated. These traits allow the company to hold it's prices, and occasionally raise them, without the fear of losing market share or unit volume. The pricing flexibility is one of the defining characteristics of a great business; it allows the company to earn above average return on capital, which is then re invested back into the business, or if not adequate roe, shares are bought back.He bought Apple around 100p,which have had a 4 for 1 share spit, plus buy backs,he's probably five or six bagged since then.why wouldn't you want to own outstanding businesses in this horrible environment. How many Aim stocks would you wan't to hold for long periods. '
Great article - thanks Ed.
Jason Needham (@stealthsurf on Twitter) is a big advocate of O'Neil style trend following, definitely worth checking him out.
I me a big fan of Warren Buffett & believe any investment you ever make should be compared to the best over long term periods.
You won't outperform every year or even 3yr & 5yr periods,what you will get though is an outstanding business that very likely will beat most stuff over the long term .
There is a caveat with sterling/dollar at the moment for uk investors.
I personally don't buy into trying to beat the market every year..
Ed, I'm surprised that Yu (LON:YU.) was a value share.
This is similar to Stan Weinstein strategy, although he used 30 week MA, market in uptrend and a few other rules.
But Warren Buffett, buys when shares fall such as Apple (NSQ:AAPL) .
How does Buffett's performance compare?
Buffett bought Apple on a PE ratio of 10x in Q1 2016. Back then it was on a StockRank of 96. Quality, Value and Momentum. It's now on a PE of 25x, StockRank 65. Say no more.
Jan 2016 Apple below:
He has been buying a lot in January, when it was a Falling Star and SR of around 51.
Trend following with a generous stop loss is the right strategy if one believes one is in a bull market however if one is in bear market then one needs to gamble that there will be big bear market rallies and follow ones instinct when to enter and get out.If in bear markets one is waiting for uptrends to enter the danger is in a bear market rally one will be entering near the top of the rally.
They did rather well, increasing 12% by March 6th ........ but those gains have now been given up, with the portfolio now flat.
So When to Sell needs attention.
Short term Moving average(s) crossing longer term ones is the Trend-follower's method.
Volumes have been written on this. Now and again an article is succinct enough for me to save it and this is one of them.
So what can I add in return?
Vector-Vest is a trend following competitor that I use, without getting too involved. They insist on Confirmed signals in both directions with minimal Confirmation being the earliest entry or exit.
What I have found is that you need a foundation portfolio based on Stockopedia fundamentals because if you try and swing between Cash and Full Investment, you miss out on the early move from the base.
Trading with the Trend is fun. To make substantial profits, however you need some bargains. The whole market can get oversold as in March 2020 or 2009 and Trend followers stay on the side lines when Relative Strength is lowest. Buy and hold bargains at those times, however, can really make a difference to your wealth.
This is not how you make money in a market , and this article is misleading.
And yet people do make money, I use a similar method based mainly on the MACD indicator, easy to implement and follow... following a rigid rule based system takes a lot of the psychological issues out of trading/investing... you just follow the rules, no second guessing. Such methods can take you out of the market when it's trading sideways (which markets can for long periods) this frees up money to invest elsewhere and can get you out of markets before a crash reducing draw down considerably, it can even give you an indication to short. It might not be pure "investing" and more like trading I suppose but you can do both (or have a hybrid) and profit from it. I've been thinking of adding in Stockopedia ranking values for a while, I've just got to figure out how to back test it.
Nothing wrong with MACD or trading.
Tell us more please Linney. My psychological issues are getting in the way of my returns but I can't shake old (bad) habits. I need some rules!
Best MACD strategy here