UK IPO Performance Analysis : 12 months to Oct 2015 - Update 4/5/2016

Recent UK IPOs have proved to be a rich seam for canny investors. The following three tables analyse UK IPOs over the previous 12 months to 30/10/2015. The data excludes investment trusts and REITS.
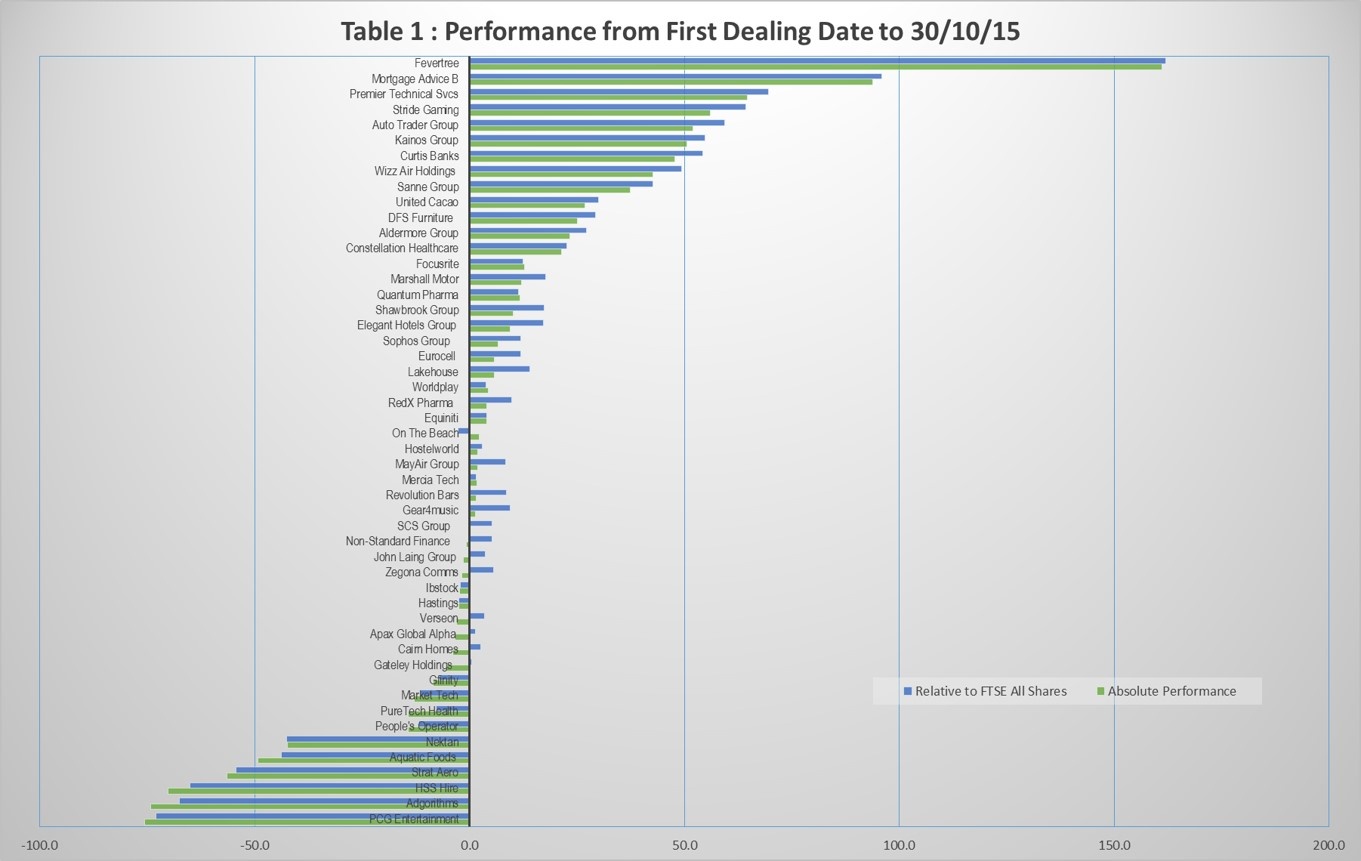
The first table shows performance from first dealing dates to 30/10/15, both for absolute gains/losses and relative to the FTSE All Shares Index.
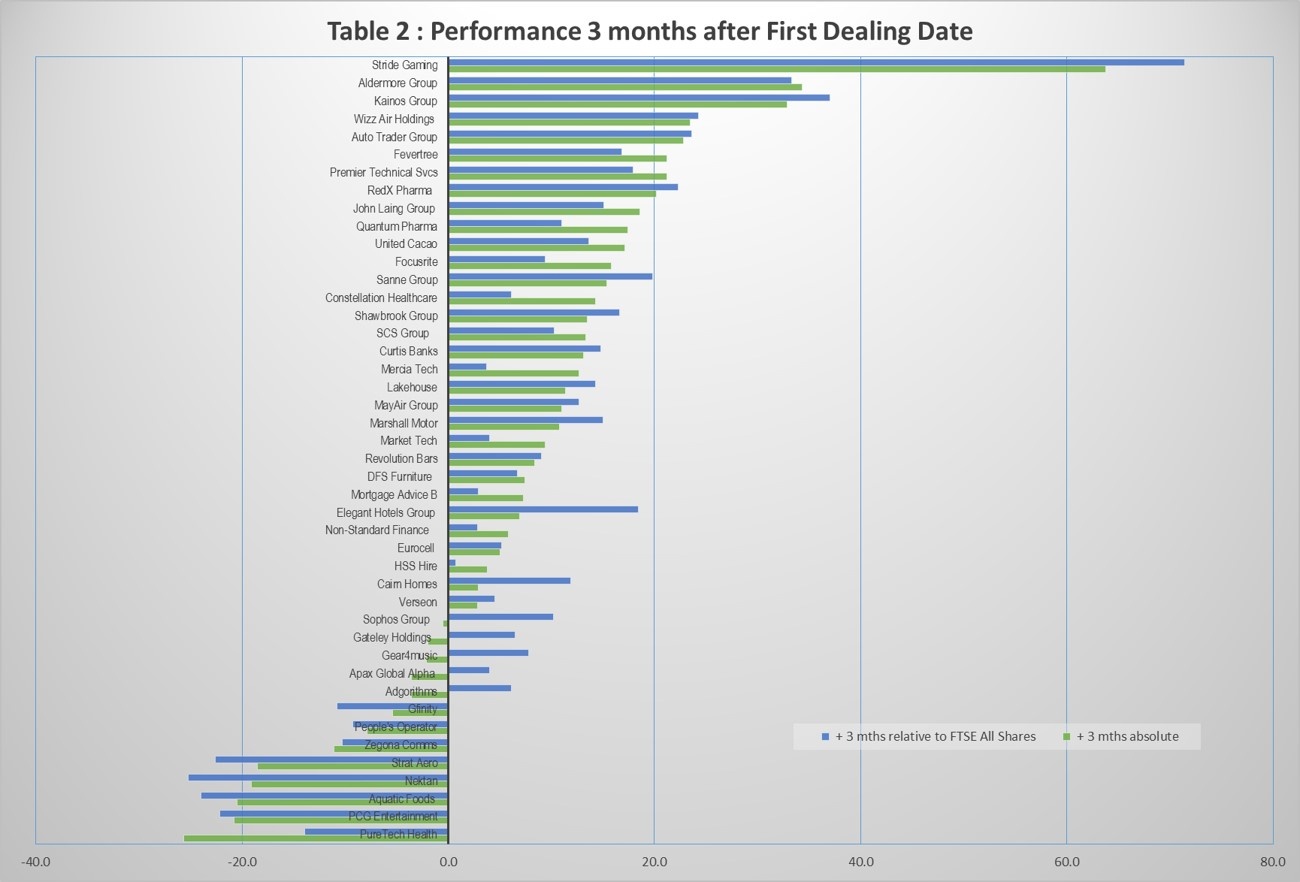
The second table measures performance 3 months following the first dealing dates.
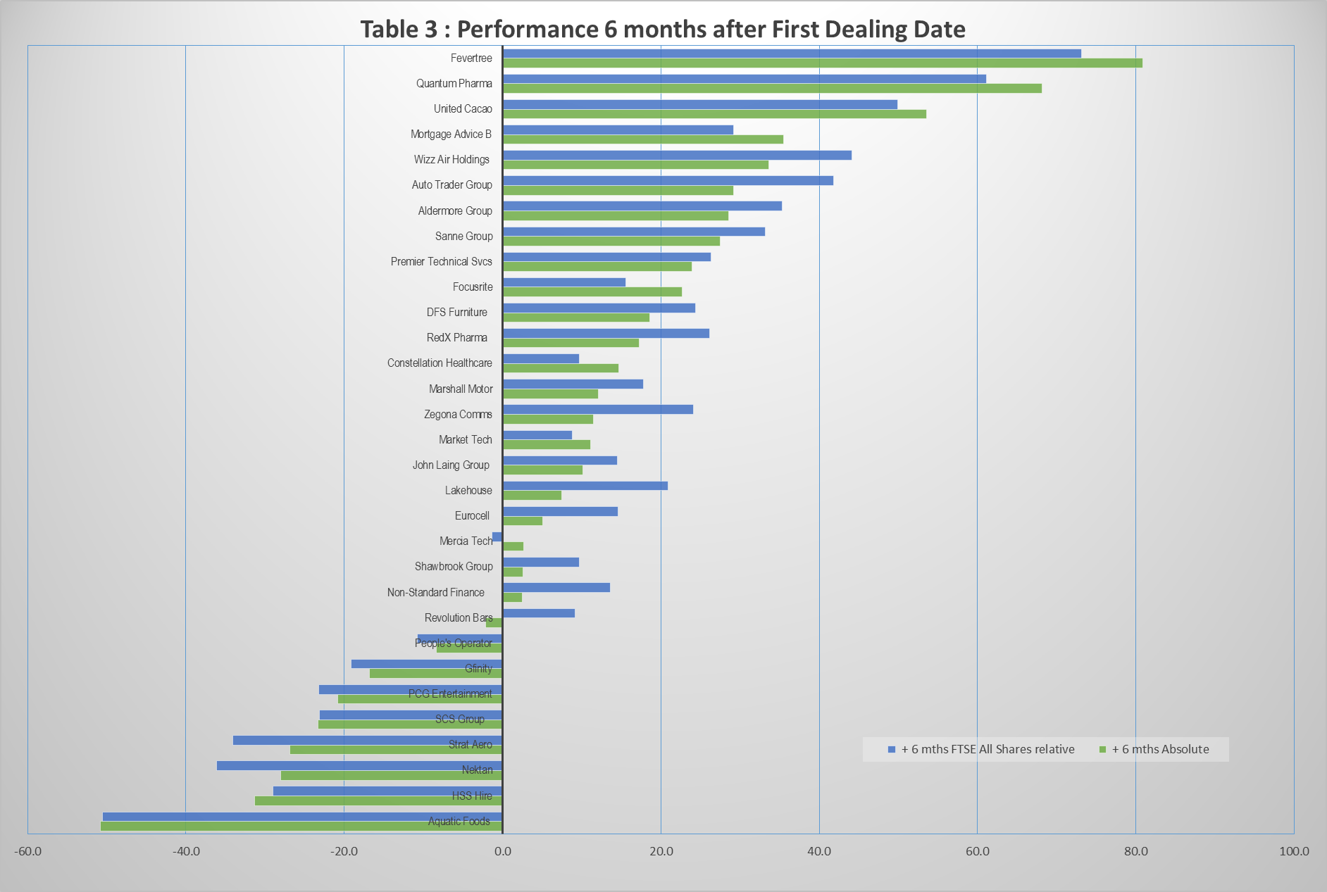
The final table measures performance 6 months following the first dealing dates.
Conclusions
- The average absolute gain was 7.2% based on table 1 assumptions.
- An interesting finding was that the Private Equity IPOs were more profitable than the others; 8.2% vs 4.9% on table 1 basis. This finding questions the general belief that Private Equity IPOs work against the interests of retail and institutional buyers.
The interesting question is, are there factors or characteristics common to the winners and similarly for the losers. This is the question I will addressing next. Of course it may well be that any correlation doesn't actually exist.
[ Note 25/11/15 the tables below have been revised as some data was missing from the previous charts ]
Update on 4/5/2016
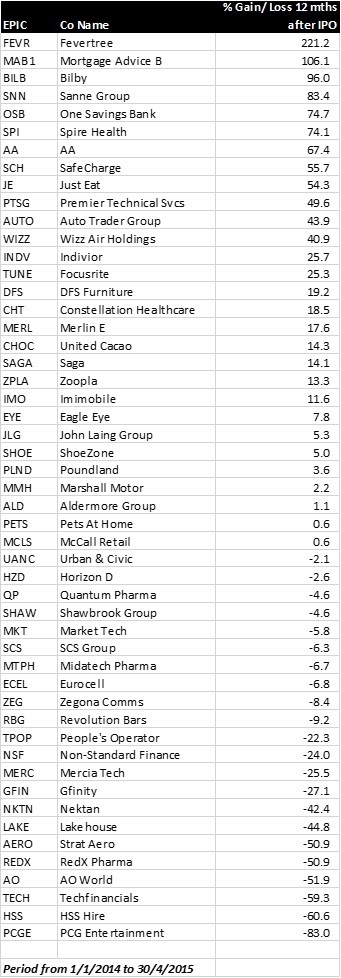
As I now have more data since my original note, below is a tabulation of all IPOs in the period 1/1/2014 to 30/4/2015, showing their performance precisely 12 months after the first dealing date (closing price).
This analysis again goes against the generally accepted belief that IPOs are bad. The simple average is +10.8% over all stocks, and even if one excludes Fevertree as an outlier, the average comes to +6.6%
Investors can do a lot better than the average by judiciously avoiding IPOs of companies which are not making a profit, or heavily burdened with debt, or have little or no financial history.
Disclaimer
This is not financial advice. Our content is intended to be used and must be used for information and education purposes only. Please read our disclaimer and terms and conditions to understand our obligations.
9 comments
The other strategy is to wait for a profit warning and then buy, many seem to be over priced at IPO then fall and then may recover, finding the bottom not always easy. For example Boohoo.Com (LON:BOO) and HSS Hire (LON:HSS). Even with profit and without debt they can come unstuck for example Entu (UK) (LON:ENTU), Lakehouse (LON:LAKE) and Boohoo.Com (LON:BOO) again.
Interesting analysis - I also assumed IPO generally performed badly. I agree maybe over the next 12 - 18 months the figures may undergo a correction and thus bring the average down from what the current research shows. Having said that, it still indicates an opportunity for potential short-mid term gains for the prudent stock picker!
I have added an update to my original note showing a 12 months analysis of all IPOs in the period 1/1/14 to 30/4/15.
Great post but its far too early to really assess performance. I predict a rerun of these results will show they underpeform by the time another 12 months have passed.
Closing price on first day of dealing.
Interesting! Which price do you use for "first dealing"? The open or close on the day, or the IPO price? (The latter would show how IPO participants are doing.)
Hi herbie -
I have re-checked my data. Entu's and Epwin's first dealing dates were 30/10/14 and 24/7/14 respectively. I checked this again at Investegate.
But you are right I seemed to have missed out the month of Nov 2014: NKTN, FEVR, MAB1 and AERO.
If the revised analysis & charts make a major difference to the general conclusions, I will issue an update.
OK thanks.
Thanks for posting this. Yes I was under the impression that many IPOs do not do well. I'm having trouble reading the bar charts but there do seem a few missing like Entu (UK) (LON:ENTU) and Epwin (LON:EPWN) which were in November 2014.