Using fundamentals to identify value opportunities – asset-based investing

In the introduction to this article series, I explained that value investing is about identifying differences between a business’s fundamental value and the market price offered to own shares in it. The simplest way to view that fundamental value is by analysing the balance sheet, particularly a business’s Net Asset Value.
Asset-based investing
Net Asset Value (NAV) is also known as Book Value. For example, on the Stockopedia StockReport:

Or Total Equity in a set of accounts:

NAV is calculated by taking the total assets on a company’s balance sheet and subtracting the total liabilities. It can be thought of as what the company believes it would receive if it sold off all its assets and paid off its liabilities.
Net Asset Value (or Book Value or Total Equity) = Total Assets – Total Liabilities
Unfortunately, it is doubtful that shareholders would receive such value in a liquidation situation. Book value also includes the value of intangible assets, such as goodwill (which arises when a company acquires another company for more than its book value) or capitalised development expenditure. Although sometimes very valuable to the company, these intangible assets may not be worth anything to someone else. For this reason, many value investors choose to look at Tangible Book Value instead, also known as Net Tangible Asset Value, which excludes those intangible assets in the calculation.
Net Tangible Asset Value (or Tangible Book Value) = Total Assets – Intangibles – Total Liabilities
Even companies trading at a discount to Net Tangible Asset Value may not always be profitably liquidated. The value of inventories will vary depending on whether they are raw materials or finished goods and the demand for those goods. The value of receivables will depend on whether they are billed or unbilled and if customers have a habit of paying on time. In general, it is better to find a company with significant cash balances and freehold property with alternative use value. Even then, the costs of liquidating a company can also be high enough to erode any profits that would be made.
However, there is another reason to invest in companies trading below tangible book value: it implies that these assets are currently unproductive. In such cases, managements face pressures to improve their efficiency, reduce their working capital, invest in better products, or shut down unprofitable business lines. Suppose those assets can be made productive or sold off to someone else who can use them productively. In that case, a company will likely return to trading at a premium to its book value, generating a profit for investors. This is the power of mean reversion that tends to happen in both earnings and return on capital, which I mentioned in the first article.
Evidence for focusing on assets
That’s the theory, but does it work? The good news is that price-to-book value has been one of the most widely studied factors by finance academics. Book value has been a preferred metric partly because it is easy to find in the accounts, and accounting standards on this measure haven’t changed much over time. Hence, data on this factor goes back a long time, giving academics a lot to analyse. Their methodologies don’t exactly match what a stock-picking investor might do. Instead, they sort the market into buckets (usually deciles or quintiles) based on the Book-to-Price and compare the performance of those buckets. (One quirk of history is that academic papers tend to reverse the equation and refer to Book-to-Price instead of Price-to-Book.)
In 1992, Gene Fama and Ken French published a paper that showed that high book-to-price stocks outperformed low book-to-price stocks (and small cap stocks beat large caps) in a way that other risk factors couldn’t explain. Although the data is a bit old now, this graph from David Dremen’s Contrarian Investment Strategies shows how this data typically looks, with cheap stocks trouncing the expensive ones on this metric over the long term:
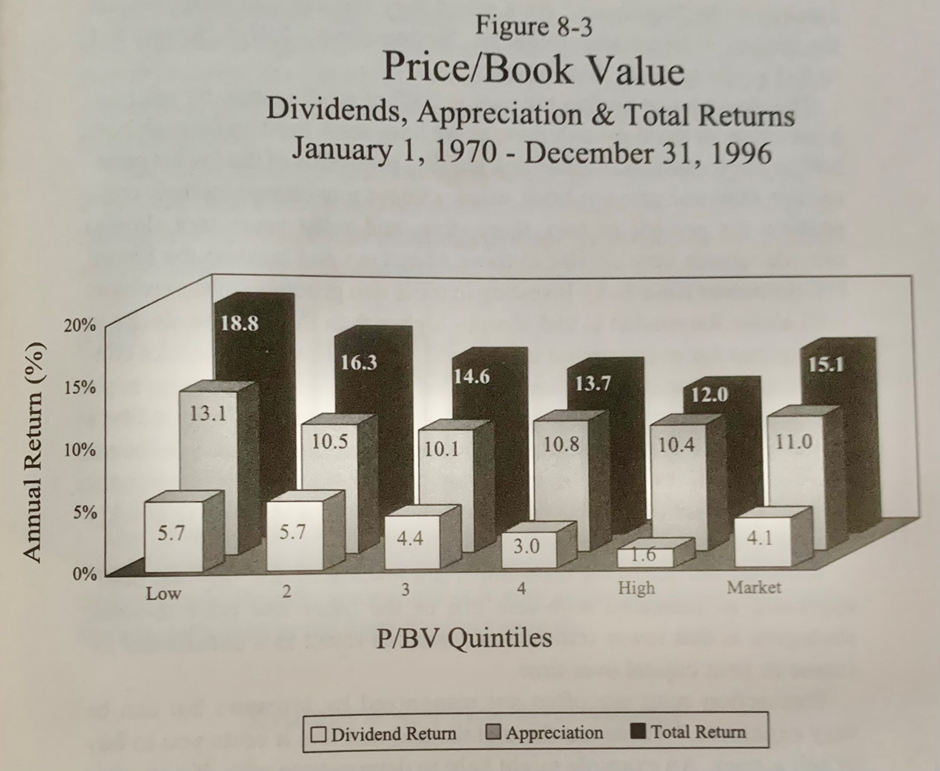
This metric has become the bedrock of the academic treatment of growth vs value stocks. However, it doesn’t actually ensure that the Value bucket trades at a discount to book value. In some markets, it is possible that the Value decile contains stocks that trade at a premium to book value. However, if I check the current UK market, the Price-to-Book-Value of the lowest decile has a maximum of 0.41. The other challenge is that the academic methodology doesn’t use Tangible Book Value, which is often more attractive to the value investor. Although around two-thirds of the current lowest price-to-book decile in the UK trade is trading below tangible book value. So, there is certainly some correlation between the two.
The academic treatment isn’t particularly useful as a stock picker. However, it is useful to know that asset-based investors are swimming with the tide by choosing stocks from a set of investments that have outperformed the market over the long term. A value investor who has skill as a stockpicker can further enhance these returns.
When I last wrote about this topic, I created a screen that could be the starting point for an asset-based value investor. As well as Price-to-tangible-book, this excludes fund-like investments that almost always trade below book value, and includes a measure of financial strength: the current ratio:

With these screen results as a starting point, value investors will then look at each of the assets on the balance sheet and apply their own sense check as to what they would be worth in a firesale or to others. They will also want to consider if management are making an effort to turn things around and make the assets more productive since this is the usual source of profit for the value investor. Some companies have controlling shareholders who don’t seem particularly motivated to make the necessary changes. Such companies are best avoided, in my experience.
With asset-based investing, it is also worth checking that there has been no material change since the last balance sheet date. Balance sheets are, by nature, out of date as soon as they are published. Trading statements won’t include full balance sheet data, but they may include the latest cash balances or details of any losses that may be eroding NAV. It is always worth checking these and adjusting the balance sheet figures accordingly, even if these are mainly estimated values.
Extreme Value Investing – net nets
Benjamin Graham also came up with a form of asset-based investing that was even more extreme. They are known as net nets - companies trading at a discount to their net working capital after netting off all non-current liabilities. His idea was to buy a stock so cheaply that it traded at a discount to the liquid assets it held on its balance sheet, such as cash, inventories or receivables, even after you netted off all the current and non-current liabilities. In making this assessment, no value is given to non-current assets, such as property or equipment. Graham gave various formulations in his writings of how to apply the discounts for this strategy. The one I prefer applies specific discounts to current assets depending on how likely they are to be able to be rapidly turned into cash. Existing cash holdings are included at face value. However, inventories are discounted to 50% of their value in the accounts and receivables are discounted to 75% of the accounting figure. This reflects that, in extremis, not all customers are likely to pay, and a company may not receive full value for their inventory if they had to sell it rapidly.
Net Net Value = Cash + (50% x Inventories) + (75% x Receivables) - Current Labilities - Non-Current Liabilities
The evidence for net nets
Ben Graham kept detailed records of the various investment strategies he developed. In the end, he found that the returns of the net net strategy beat all the others and solely focused on this for the latter part of his career.
In 1986, Henry Oppenheimer published a paper looking at the performance of the net net strategy in the US for the 13 years from 1970 to 82. He found a compound annual growth rate of 28.5% vs. the S&P 500 Total Return at 9.3%, an absolute outperformance of 19.2%.
A 2010 study by Carlisle, Mohanty, and Oxman updated this by examining the performance of net net stocks in the US market between 1984 and 2010. The net net portfolio outperformed the NYSE-AMEX Index by a phenomenal 22.4% per annum and the Small-Firm Index by 16.9% per annum.
Some critics have pointed out that being such small companies means that the quoted returns of this study may be optimistic due to large bid-offer spreads and may not be available to all investors. Still, the size of the outperformance is such that the returns to individual investors should still be great despite these challenges.
I created a screen that looks for net nets here. Because net nets are pretty rare, I also created a near net net screen. The values here don’t apply specific discounts to each balance sheet entry but may certainly help value investors generate ideas.
It may seem unlikely that the market would allow such opportunities. After all, balance sheet values are well-known and easily screened for. Such opportunities indeed tend to be thin on the ground. However, after extended bear markets or during market panics, it is surprising how often the market throws the baby out with the bath water. Redemptions amongst funds or margin calls amongst leveraged investors can often lead to forced selling that makes such bargains available. The hard part is having the strength of mind to take advantage during periods of extreme market distress.
Although still a great way to take advantage of market gyrations, asset-based investing has some challenges. In an increasingly digital world, tangible assets are arguably becoming less important. Investors who only focus here may be missing out on great returns elsewhere or have to spend long periods in cash due to the lack of tangible asset opportunities. In the next article in this series, I will look at earnings and cash flow-based value investing, where opportunities may be less tied to old-world assets.
Disclaimer
This is not financial advice. Our content is intended to be used and must be used for information and education purposes only. Please read our disclaimer and terms and conditions to understand our obligations.

5 comments
Mark,
In my spare time I am looking to gain a greater understanding of balance sheet analysis so this article is of immense help thank you.
The general consensus for NTAV is Net Tangible Asset Value (or Tangible Book Value) = Total Assets – Intangibles – Total Liabilities.
A bit of a nerdy question - on Stocko, goodwill is shown as a separate line on the balance sheet alongside net intangibles so would you also deduct net goodwill in these calculations?
Many thanks.
net-nets worked then, they still work now, and they will always work
they are also what gave ben graham, walter schloss, early buffett, joel greenblatt, michael burry etc. their best returns.
as you pointed out - which so many often miss - ben graham tried multiple strategies! quite literally ALL of them i.e out of favour large-caps, dividend yield hunting, low book-value/low earnings multiples, merger-arbitrages, and net-nets STILL worked the best.
schloss' monster 40+ year record (~21% for, IIRC, 43 years) declined when he moved away from net-nets towards more 'normal' cheap stocks vs earnings, book value etc. his opportunity set in the US dried up, and he did not look outside the US for opportunities. if buffett didn't have the longevity and record he has had, more people would know about walter schloss (buffett even promoted him repeatedly, as being faithful to the original teaching of ben graham).
speaking of buffett: his returns (~30% for 13 years in his partnerships, including a few years of triple figure returns) also dropped when he was forced to abandon his net-net hunting grounds i.e when he had £250m+ (adjusted to today's value) to deploy. although he did still continue to achieve outsized returns w/berkshire in the 70s, 80s and part of the 90s (IIRC ~26% for 40 years from 1956-1996)
this was almost exclusively due to the washington post + coca cola investments. washington post being essentially a gigantic discount to book value vs the assets on the balance sheet although not steep enough to quality as a net-net, and coke being a case of paying a high price (18x earnings), but w/a runway of 18-20%+ growth for a decade or so the multiple paid for itself multiple (lol) times over
greenblatt is an interesting case. he started with net-nets but moved onto spin-offs and distressed/over in-debeted securities that no-one wanted. he also continually returned money (again, keeping it lean and manoeuvrable), eventually returning ALL outside money. this allowed him to continue to achieve exceptional returns - 40% for 20 years - the best in history over that duration since he started his gotham S&P500/SPY strategy (essentially under/over weighting the holdings as preferred), the returns have been extremely poor
burry closed scion after only 6 years of monster returns (~28% a year) then went into the big short, a bet which he was actually losing on for a year or so, as the movie illustrates quite well. he has since resumed scion as of 2018, and his approach has been wildly unpredictable. lot of momentum & quarterly trading + shorting. difficult to understand, impossible to implement if trying to copy-cat/coat tail ride.
back to net-nets: the main drawback is primarily their illiquidity. which is great news if you're investing £1,000 or £10,000 or £100,000 or even £1m, £10m. but is a gigantic hinderance if you're having to deploy £250m, £500m, £1B, £10B etc.
you cannot buy or sell easily, they make a tiny % of the portfolio, clients and managers reaction to them is 'ew, get this out my sight', and thus they are not touched. leaving them free to be analysed and invested in by the private/smaller investor and scoop up ALL the gains
apologies for the very long comment, but i felt it was appropriate!
A great summary, thank you for sharing.
Thanks for the article as always Mark, the educational aspect of these are certainly well received from myself
The net/net and near net/net screens provided, currently are full of tiny and i guess very ill liquid stocks with poor or abysmal stock ranks
For a very, very experienced stockpicker this may be fertile hunting ground but for mere mortals like myself I feel this would be a road to ruin
That being said i have learned something from the article so it is appreciated
Hopefully this post will bump the article up the thread for other subscribers as i think its gotten lost within todays activity (nearly missed it myself)
Callum
Thanks Callum.
I totally agree; it is a strategy that requires some skill in separating the dross from a reasonable business that has been unduly sold off, and hence, less-experienced investors probably need to beware. Although, interestingly, not too much skill - Toby Carlisle looked at whether you could improve the net net strategy by adding quality filters, such as only investing in the profitable companies. It turned out that these detracted from the returns of the strategy! It seems that being comfortable in investing is rarely correlated with good results.
Personally, I use the net net metric as a signal that something already on my watchlist has become simply too cheap rather than investing in all net nets. This can often happen during market crashes when the fear is greatest. So, having something tangible as an indication of extreme cheapness helps me be willing to pull the trigger when the time comes. This happened with £XAR in March 2020, for example.
While the net nets tend to be the smallest and most illiquid stocks for obvious reasons, it is not exclusively so. For example, I invested in both Hunting (LON:HTG) and Crest Nicholson Holdings (LON:CRST) when they met the net net criteria. Hunting has more than trebled since it was a net net, and Crest Nicholson is attracting takeover interest at the moment.
So I think it can be a useful metric for all value investors, even if, like me, they use it sparingly.
Cheers,
Mark