Webinar Discussion - How Phil Hoffer achieved 17% annualised for 13 years

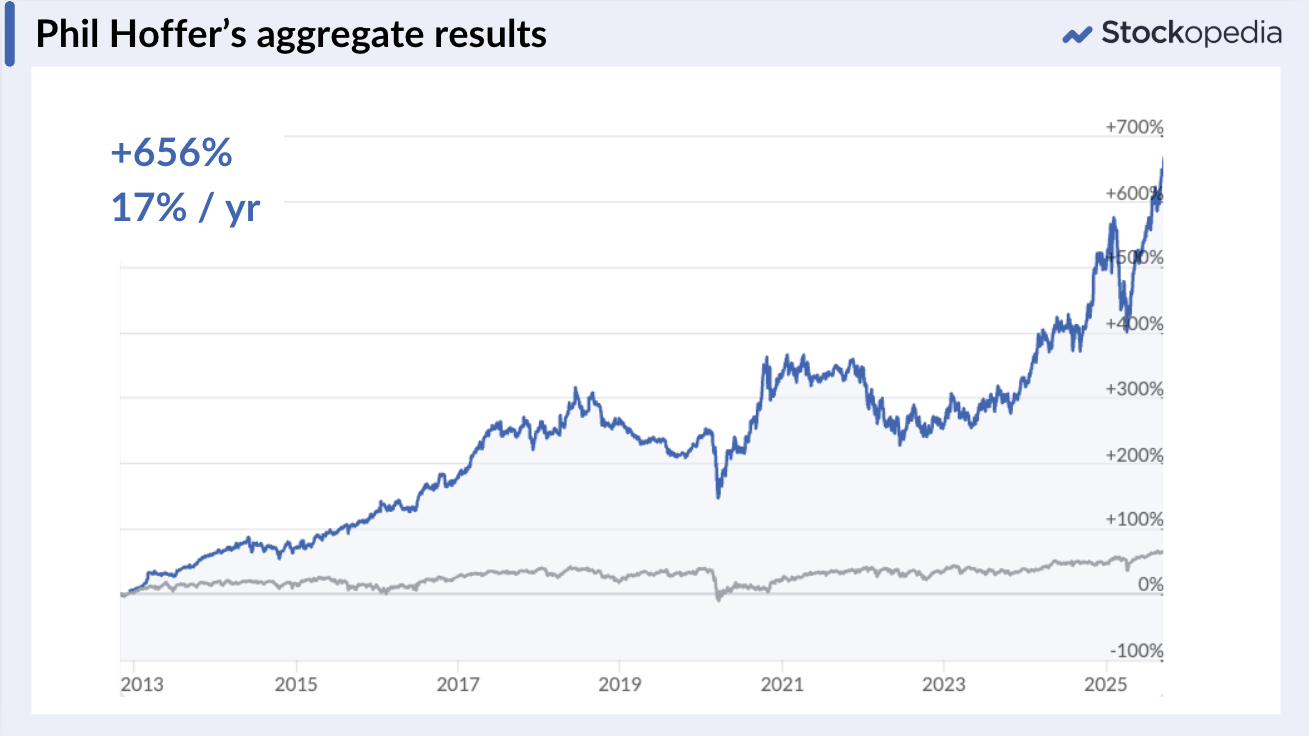
Last night, we hosted our first-ever “subscriber special” webinar with Phil Hoffer - one of Stockopedia’s earliest members - who has compounded his investment portfolios to a 656% gain over 13 years.
Phil’s story mirrors the journey many investors go through. He started out buying share tips in hot sectors, but over time discovered that crafting his own consistent, repeatable process was more reliable.
Once he started letting quality, earnings revisions, and price momentum do their work - his results improved dramatically.
I thought I'd start a thread to let subscribers share their comments, and perhaps Phil will contribute.
You can watch the webinar replay here.
Phil's track record
Phil was kind enough to share his historic records with us, so we pulled out his performance history and portfolio statistics. We will put the slides on the event page soon, but here are a few of the highlights.
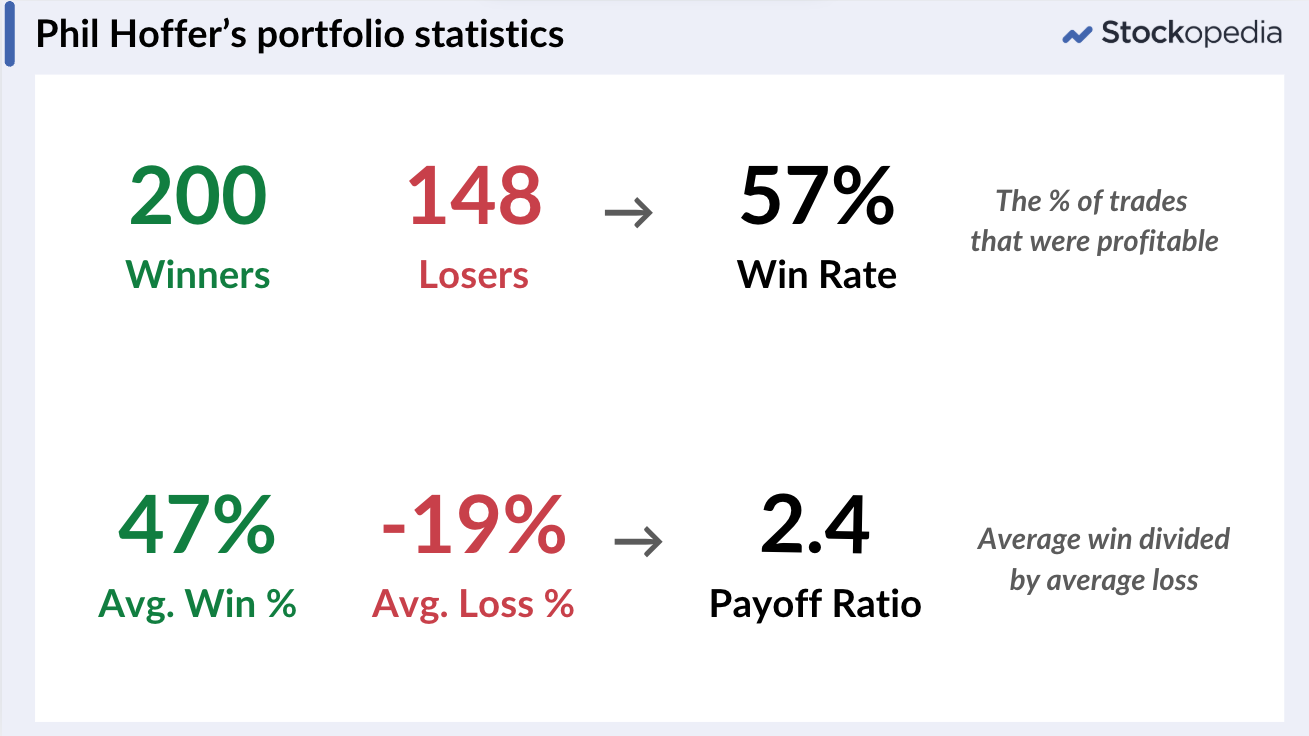
A few of Phil's portfolio statistics tell the story - a consistently high win rate at 57% and far higher returns from his winners than his losers. As Peter Lynch once said "if you get six out of ten correct in this game you are good".
What Phil buys
Phil’s sweet spot is high-quality companies with strong price and earnings trends - what we’d call high QM stocks, or High Flyers at Stockopedia. He's quite value agnostic - usually he pays a premium P/E for great companies, while occasionally he finds bargains.
In practice, that means (in brief!):
-
QM Rank ≥ 90, Quality > 80
-
Profitable, cash-generative, with ok balance sheets.
-
Price near 52-week highs
-
Positive recent broker upgrades for the next 1–2 years
-
Recent results beating expectations
“The market and the data tell me what’s working. I don’t need to be a sector expert to ride it.”
He has very strict criteria and so has ventured internationally to find more stocks. He buys shares across the UK, Europe, US, Canada, and Asia and Australia - wherever the opportunities line up. He currently has 52% in US stocks.
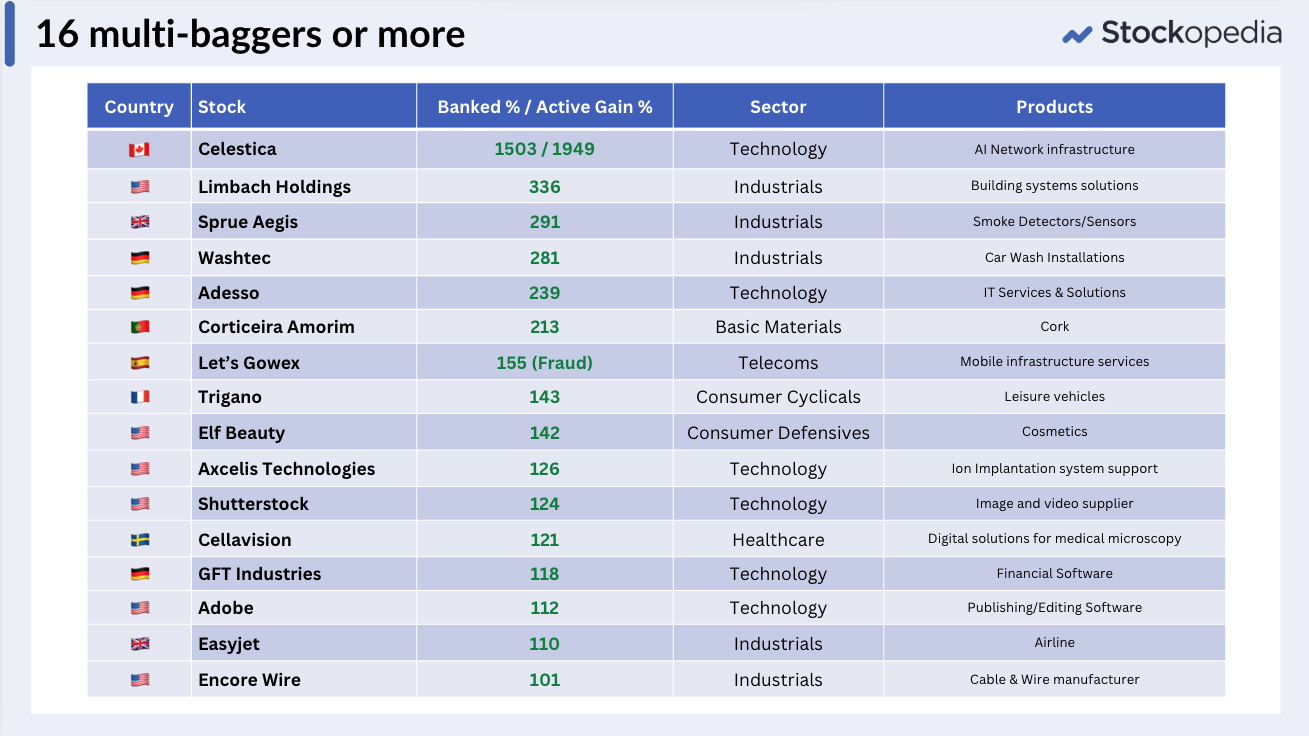
Phil has had 16 multibaggers over the years:
Phil's selling and portfolio rules
Selling is where many investors come unstuck. Phil has clear sell rules.
-
Stop loss on trend break: Phil uses stop losses when trends break - and uses Ichimoku clouds to guide where he sets them. He raises his stops as the cloud rises.
-
Downgrades: if analysts cut numbers or if there's a drop in Quality Rank - these are red flags that often lead to a sell. He wants a Quality Rank > 80 at all times.
-
Profit warnings: He's out immediately - having read our research on profit warnings he added this to his rules.
-
Market context: If the whole market’s wobbling, he can be patient — but the share must reassert itself
Phil may trim his big winners when the position sizes start creating too much risk for his portfolio.
Across his ISAs and SIPPs, Phil usually holds 10 stocks in each, roughly equal-weighted at purchase (normally up to 30 in total). He doesn’t impose sector targets - he lets his stock screen guide him into shares that may perform so can often have significant sector loadings. At the moment he's quite overweight in technology and industrials.
Case Studies: The Rules in Motion
We went over a few case studies - but a notable pair includes:
-
Celestica (NYQ:CLS) - which was a forgotten supply chain company that became an AI infrastructure winner. Phil had no idea what the company did when he bought it. The earnings upgrades and strong trend told the story. He managed to only sell his first tranche after it had ten-bagged.
-
elf Beauty (NYQ:ELF) - this screened as very expensive on a P/E of 45 or so, but upgrades and momentum kept it rising.
Please do check out the webinar as you'll learn a lot about how he managed his risk on this journey and what triggered him to sell in each case.
There is a lot more I could write here... but I thought it would be great to get a conversation going... so if you joined, please do chat below.
And thanks to you Phil - you were a great sport, and it's a testament to how much the community appreciated hearing from you that we had one of our highest ever record webinar attendances!
Disclaimer
This is not financial advice. Our content is intended to be used and must be used for information and education purposes only. Please read our disclaimer and terms and conditions to understand our obligations.
240 comments
Despite the carnage today, Five Below (NSQ:FIVE) finished up 10% after beating EPS estimates by 7.6%. I've held in my public QM Growth Blueprint since 20/1/26 and it's currently up 18%.
Micron beat EPS estimates by 32% but finished down 3.7% after opening down about 8%. Despite beating estimates one broker down graded it from a Buy to a Hold. I'm currently sat on a 23% gain since mid Jan.
On the flip side Atalaya Mining Copper SA (LON:ATYM) missed its earnings estimates. I'll be selling tomorrow. It closed down 12.5% and I'll be looking at a 25% loss. Not great but sadly conflated with Iran debacle.
You are right about the carnage Phil! I started a portfolio using the QM Growth Blueprint 5/1/26 and have purchased 6 stocks all in the USA. My only real success is Micron Technology (NSQ:MU) which is up about 33% though Vertiv Holdings Co (NYQ:VRT) is doing OK at 13% since 13/2/26. Those are the highlights with my other holdings Lam Research (NSQ:LRCX, Woodward (NSQ:WWD) and Comfort Systems Usa (NYQ:FIX) all down between 4 and 8% since purchase. Like yourself mining is turning into a bit of a problem area. I bought Alamos Gold (NYQ:AGI) on 2/3/2026 which was terrible timing even though all the QM Growth Blueprint signals looked good. I guess I hadn't allowed for the gold price falling significantly and worries about high inflation and the consequent high interest rates taking hold. Now have to decide if there will be a gold revival or is it time to sell as the price action is well below the ichimoku cloud and showing no signs of recovering as yet. There is an EPS downgrade, the price action is below both moving averages and there is a strong bearish signal shown on the portfolio tool. Like yourself with Atalaya Mining Copper SA (LON:ATYM) I think it will have to go!
Yup it's tough times at the moment
Hi,
I've just fixed a bug in my Google Sheets Portfolio tool affecting Bad Regime detection. It was failing to spot a decline in the index's five day MA when the underlying index was above its 50 day MA. This has been most evident on the Toronto exchange
Please upgrade to v2.5 if you're using the Market Regime logic during these difficult times.
You can find all of the resources on the QM Growth Blueprint page.
I hope to produce a video today which details how I'm handling the turmoil and how the Market Regime filter is going to help me.
Best of luck
Phil
Lots of strong earnings out at the moment:
Comfort Systems Usa (NYQ:FIX) up 6% today on the back of an earnings beat
I've held since late October '25
But the highlight today was Lundin Mining (TSE:LUN) with a whopping Q4 41% EPS beat https://www.stockopedia.com/ne...
It closed up over 10% today.
I've held since early November '25
Hi,
I've being trying to setup a public portfolio to show the track records of the QM Bluieprint approach. In my latest video I ...
Enjoy!
Re the EPS graphs. Does anyone have a system to turn it into a value? For trade recording into a table.
Right now I'm thinking (and don't laugh too much) record it by splitting it into 4 parts and simply recording if it's Up, Down, or Flat. So it would be something like, Up/Up/ Flat/ Down... Down/Down/Up/Up. Which gives a rough recording for looking back with the rest of the data. but obviously you can't do any statistical analysis with this.
I could eye ball it and giving it a rating out of 5 or 10 etc. I'd guess the latest portion would need to be higher weighted. But I think a simple score would miss out on the latest portion.
Perhaps I'm thinking too much into it.
The most important part is the last 6 months as this (and the price action) is what is driving the Momentum Rank
Thanks for replying Phil.
So would you discount a previous weak period if the most recent 6 months are strong?
Yes I tend to eyeball it. #veryscientific
Excellent. Thanks for your reply.
Guess it's a good thing there is something left that needs a human eye.
Advanced Energy Industries (NSQ:AEIS) reported Q4 earnings today :
Currently up ~10%
I bought in late January '26
Vertiv Holdings Co (NYQ:VRT) reported Q4 earnings today:
It's currently up ~20%
I've held since late October '25
Morning!
Viewers have been requesting help to setup Trading View so here's a How To video to help with that ...
I hope it helps
Interesting to see that Made Tech (LON:MTEC) has recently popped up on the Hoffer screen. I actually purchased a small amount of these recently off the back of the "ahead of expectations drift" article and strategy outlined by Ed so it's encouraging to see that this stock now meets both Ed's criteria and Phil's screener.
The question is, do I now double up with the knowledge that I can blame both Ed and Phil if things don't work out?
Joking of course Ed/Phil, but will be interesting to see how this share performs :)
TU due imminently
Just prior to the big market wobble last week I recorded a review of the portfolios I use for my QM approach
Enjoy!
Currently Celestica (TSE:CLS) is 15% down on the day after yesterdays results. There has been quite a lot of strong buying at 375 C$ so it'll be interesting to see what happens at that level.
Quite a few US tech. large caps are down heavily today, Microsoft (NSQ:MSFT) and ServiceNow (NYQ:NOW) both down 12%, disappointing update from the former.
So one of my holdings Nihon Dengi Co (TYO:1723) reported overnight for Q3 for 2026.
Here's the published financial results ... https://ssl4.eir-parts.net/doc...
On first glance from the Reuters reporting it is very hard to ascertain what is going on.
Helplfully TradingView pops a little window on the chart for quarterly reporting (please add this Stocko team) ...
which shows they missed their revenue estimates for Q3 but it is still not clear where they are in terms of their profits.
Digging a little deeper the statement indicates they are significantly ahead in terms of EPS for Q3 2026 compared to Q3 2025 but that still doesn't help in terms of where they are in relation to the forecast estimates for year end 2026.
Stockopedia is reporting YE estimates of 502 Yen.
At the end of the financial statement the company gives a YE EPS estmate of 506 Yen.
And crunching the figures in the statement I can see that their net margin (operating profit / revenue) for Q3 is 26.5% which is an improvement on the current trailing 12 months value reported on the StockReport of 23%
So in summary they missed their sales target (not sure why?), the company reports that for YE '26 they expect :
1) Revenue to be 46,000m Yen which is less than than the reported 48,000m Yen on the StockReport
2) EPS to be 506 Yen compared to current estimates of 502 Yen
3) Their margin is increasing which explains why they can beat profit expectations in spite of less sales
The price was down over 6% in response and it'll be interesting to see what happens overnight when the Tokyo exchange opens. At the moment I'm sat on my hands.
I don't normally keep track of a stock once I've sold it but it will be interesting to see Celestica (NYQ:CLS) results on Wednesday especially given this reporting ...
https://www.gurufocus.com/news...
Well it's up 0.69% at present pre-market (which is just as well as I've still got a few despite substantial top-slicing over the last twelve months!)
It is up 8% now, not sure why, results leak?
Hi Phil.
I've taken the plunge and subscribed to worldwide stockopedia coverage (or as wide as they go), and ran your filter. It's thrown up a lot (13 out of 26) in basic materials sector (primarily miners) . I'm not surprised due to the current performance of gold/silver/etc and think it's a quirk of the current market and time that I've started this system. I guess you're likely to find "in favour" sectors whenever you start out.
A quick question for you if you have the time.
I've yet to run the various checks to see what gets filtered out later but generally would you worry about that concentration of stocks in one sector and limit selections? I guess once it's up and running for a while and you're just replacing the odd stock here and there it's not so much of a problem ads you'd build up diversity over time.
My gut feel, and fits with your "I don't know/care what they do" principle, is that I just go with whatever the system throws out and ride the current momentum. But I can equally see the benefit of taking time to build up a portfolio that's a little more balanced.
Hi DaveR,
I would ideally like more balance but I also recognise that this system will pull me more towards individual stocks and industry groups that are running hot.
Let me give you some figures based on the current state of play of the three portfolios I referenced in the webinar with Ed.
I currently hold 30 stocks across three accounts. I have about 2 positions worth of cash in of the three portfolios.
Countries
I'm finding that Japanese stocks are offering good variety of sectors and industries and they are cheaper in terms of PEGR than say the US. Not much in the way of European stocks at the moment, though European indexes have been hitting new highs so perhaps that'll start feeding through into the screen.
Sectors
I'm prepared to lean into sectors as you can see. Industrials has quite a selection of industry groups so that doesn't concern me however 7 of the 8 Basic Materials are Miners, mostly gold but I also have exposure to Copper which is also hot at present. I want the best of the miners so I'll be more fussy with the EPS graphs.
Industries
I am also exposed to Construction & Engineering but it is spread across different countries.
YTD I'm up currently up ~9%
I'm not sure if that helps?
I hope it goes well!
Hi Phil, I've been looking and through your article, tools and videos. Firstly thanks so much for all the effort it must have taken to pull it all together - it is appreciated! Do you have a public copy of your screeners on stocko? Sorry if i missed it but couldn't see it anywhere. Thanks
It's in the earlier comments but here it is https://www.stockopedia.com/sc...
Perfect thank you
Thanks Phil.
I've decided to go with whatever the process chucks out rather than try to second guess trying a more balanced start. Logic being that the process should catch anything where sector momentum starts to fail.
Very impressive start to the year, well done.
Hi Phil,
Looks like we were both wrong about Fresnillo (LON:FRES) back on November 26th. Since then share price up 53.5%!! Expect other silver & gold miners seen a similar stratospheric rise. Fresnillo (LON:FRES) was already the top riser in FTSE 100 in 2025. At this rate could be the same in 2026 until the precious metal bubble bursts. The Ichimoku charts still look bullish but the stock is already up 6x since start of 2025 with a very low value ranking (8) and a highish PE (for a miner) of 23. I can't bring myself to buy it at these levels but then I said much the same back in November! However rationality with regard to precious metal miners seems to have gone out of the window at the moment.
I bought in on 2nd Jan. I'm sat on a 16% gain. I can't see the world settling down anytime soon with big countries being given carte blanche to lean on smaller nations. If anything it gives permission to China to lean on Taiwan. I'll follow the trend. I currently own 6 gold miners and 1 copper miner over three portfolio's.
As promised I've released two TradingView Indicators and an complemtary strategy for Trading View...
1️⃣ Market Regime Monitor (GYD)
This monitor shows the current market environment and highlights the components contributing to Good or Bad Regimes.
- Works with any momentum, trend, or rules-based strategy
- Ideal as a standalone market assessment tool or alongside Blueprint strategies
- Helps filter trades, assess risk, and identify favorable conditions
2️⃣ Blueprint – Ichimoku Regime Indicator (GYD)
This visual indicator shows the Ichimoku structure on your chart and optionally signals whether the current regime is Good or Bad.
- Helps you quickly interpret Ichimoku setups and overall momentum
- Helps to time Buys so that stock momentum is combined with momentum in the underlying index
- Helps to identify if the weakness is the share price is related to the stock or wider market weakness
- Can be used alongside the strategy or independently for analysis
3️⃣ Blueprint – Ichimoku Regime Strategy (GYD)
This strategy identifies ideal Ichimoku setups for momentum trading.
- Buys when optimal Ichimoku structures appear
- Sells when price drops below the Kumo, except during a Bad Regime
- Optional Good Regime filters for more selective entries
It’s designed to support QM Blueprint, VM Blueprint, or other rules-based approaches, giving you a systematic way to trade with regime awareness.
Together, these scripts form a complete toolkit for systematic investing:
Market context → Market Regime Monitor
Visual analysis → Ichimoku Regime Indicator
Strategy execution → Ichimoku Regime Strategy
In this video, I also show how the GYD Blueprint Suite integrates with the Portfolio Tool, helping you select stocks, monitor risk, and optimize your holdings efficiently.
Hi Phil, your contributions here are fantastic and go above and beyond. Thank you and please keep up the great work!
Join me live at Midday as Ireview my portfolios ... https://youtube.com/live/M5waY...
If you miss me live you can catch up later
Warm regards
Phil
Join me live today or catch the video later as I explore whether I can automate the QM Blueprint ...
https://youtube.com/live/9_AO6...
Thank you for your hard work in the updated version
Thanks Caph
New Enhancements to the GrowYourDough Portfolio Tool
I’ve just released a major update to the GrowYourDough Portfolio Tool — now featuring automatic Ichimoku chart analysis to support smarter and more confident investing decisions.
Based on community feedback, the tool has been upgraded to provide:
Automatic Ichimoku Analysis
Helping you to:
- Identify stock candidates that are clearly trending
- Maintain existing positions with greater clarity and automation
- Make more effective sell decisions using real market structure
Automated Market & Price-Sensitive Calculations
Including:
- 50-day moving average (%)
- 1-month relative strength (RS)
Expanded Coverage
Now includes Indian markets, unlocking more global opportunities
In the video, I walk through each improvement step-by-step — showing the tool in action and explaining how these enhancements support buying, managing, and selling positions with greater confidence.
I also break down the logic behind the selling rules, so you can fully understand the motivation and evidence driving each decision.
Ran through Phil’s screen over the weekend. 3 stocks seemed to fit the selection criteriAlphabet (NSQ:GOOGL) , Barrick Mining (NYQ:B) and Argan (NYQ:AGX) . The ichikomu chart on the latter looked good:
Sadly the price fell 8% today! Suspect the high rating (PE of 42) and some leaks ahead of Thursday’s 3rd quarter results might have something to do with it (not that I’m cynical or anything). Will watch with interest. Not tempted re Barrick Mining (NYQ:B) as already have gold/gold miners exposure. As for Alphabet (NSQ:GOOGL) not sure I’m brave enough given all the hype around the AI bubble bursting!
I think it's more likely to be the fallout from Bitcoin's decline as a result of the risk to the popular Bitcoin trading strategy called the Japenese Yen Carry Trade . When Bitcoin drops some individuals get margin calls which means they have to find funds and so the sell their other investments which drags the market down.
For disclosure I hold Barrick Mining (TSE:ABX) & Argan (NYQ:AGX)
Argan (NYQ:AGX) did in fact miss its earnings ...
https://www.stockopedia.com/share-prices/argan-NYQ:AGX/news/urn:newsml:reuters.com:20251204:nL1N3XA155
Actually on further analysis they missed their revenue target by ~5% and beat their EPS estimate by ~6%.
The after hours market has them down by about 11% at time of writing.
If that continues on open tomorrow I'll sell.
I guess you must have sold?
Indeed!
Cheeky sneaky peek of the updates I've been making to The Portfolio Tool to be released soon.
New features:
I was looking at Berkshire Hathaway's latest 13-F yesterday which showed they had added 17.8m shares (or about $4.3b) in Alphabet (NSQ:GOOGL) . Looking at Phil's screen this morning I notice Alphabet (NSQ:GOOGL) has appeared albeit right at the bottom with a PEGR of 5.6.
After a very cursory glance at the Stock Report and Ichimoku I'm popping into the shortlist Folio for a closer look.
Interesting, I bought Alphabet (NSQ:GOOGL) about 4 weeks ago when it had a mini break out (on the weekly chart). Looks like the ideal time to buy would have been at the start of September.
But it's another interesting facet of Phil's strategy that I've been using the Ichimoku chart as a reference on other momentum trades that I had in place before Phil publicised his strategy, and I am now using it on other trades I'm considering from other screens.
Hi Phil. I've watched the video and it's a very comprehensive run through, it must have taken you ages so a big thanks from me (and for sharing your spreadsheet). I was going to try to automate some of the manual aspects for the spreadsheet (Ichimoku Notes and Stop Loss price) but thought I'd ask you if there's a good reason you've kept them as a manual entry before I waste my time doing something that wasn't really a good idea?
Hi Dave,
Breaking news ... over the last few days I've been working on automatic Ichimoku calculation for each item in the portfolio.
The only downside is I can't get free historical data for Japanese stocks. It's work in progress at the moment and requires some more polish.
It can work out the trend, latest signal and the strength of that signal. If you have no existing stop loss and it suggests Kumo it will populate that too.
but like i said work in progress...
Hi Phil,
Your work ethic in spreading your ethos of RULES based investing is wonderful. I am slowly working thru your material including rhe google sheet - most impressed
Automatic ichimoku calculations is vintage champagne level dedication on top!
Don’t do too much or we are likely to keep asking for more
Your intention to spread the word is admirable
Thanks Phil. great work yet again. Glad I asked rather than jumping in. Just wish I could get ahead of you and help a little bit :)
Hi Phil, Thanks for all your hard work, checking yesterday without stop losses everything work great but today my stop losses were formatted in $s not £. C50 and C53 in the sheet were correctly shown in £, LSE was shown for each share in column D so I'm stumped. i've run it a several times from scratch, I'm using a macbook.
Hi Trebor,
Apologies to be clear at the moment (i might have to look into some scripting to achieve this) the formatting of the currency fields is manua.l
Ok, thanks Phil. All fine now
Phil: that now works perfectly for me (Macbook Air)! This is also my first ackhowledgement of the wonderful contribution you have made. Many thanks!
One small further observation: in the custom criteria you have "Price Change 1m". In my version of Stockopedia (US Subscription only), I can only find "Change (1week)", with no option to change to 1 month. I don't know whether this slight difference has any significance for the scripts you run.
If you go back to the Customisation of the table view panel and type "absolute price change" into the search bar you should a field marked "Absolute Price Change"
This is the field you need but I have to say the field name isn't very descriptive in comparison to other fields.
Thanks for providing this feedback as it'll help others
I've fixed the issue and released v1.1 of The Portfolio Tool Template.
You can access it here -> https://docs.google.com/spread...
Phil, it’s been a month since I began steadily buying stocks from your screen and following your method, and I wanted to share a quick update. The portfolio built from those picks is now up over 5%. The recent move in Japanese stocks helped, as did Barrick Mining (NYQ:B).
Still early days, but a very encouraging first month — I’m enjoying the process immensely. Thank you.
Now to dive into your spreadsheet and start tracking things properly — previously a real area of weakness for me.
Some gotcha's associated with the process:
Most likely you exported the wrong table view when you downloaded the CSV from Stocko
Please go back to Stockopedia select the modifed table view and re-export the CSV
Ensure that your portfolio currency (cell C50 on the portfolio page) matches the base currency of your portfolio on Stockpedia
If you have two files named in a similar manner, e.g. Abc.csv and ABC.csv then the import process can get confused. Please just have one CSV per portfolio
Has anyone managed to get this process to work on a Mac? I'd be grateful if anyone can comment. Were there any gotchas?
Thanks
Phil
Phil, I am having the issue you note in Item 1 i.e. Column B is not being populated and the Stock name is going into the Ticker column, Column C. I am downloading the Custom file view (the one starting with Exchange and ending in Cost) Will keep trying.
so delete all csv files in the GYD folder in Google Drive and try again
Done that three times but will keep going.
can you cut and paste the headers from the csv file in a comment here?
Better still place it as a comment over on YouTube soi we don't clutter up Stocokpedia threads
"Flag" "Ticker" "Name" "Exchange" "Quality Rank" "Value Rank" "Momentum Rank" "P / E Rolling 1y" "PEG Rolling" "PEGR Rolling" "EPS Growth Streak" "EPS Growth Forecast 1y (%)" "EPS Surprise Latest (%)" "EPS Upgrade Streak" "No of Downgrades 1m" "Price vs MA 50d (%)" "Price Chg 1m (%)" "EPS Upgrade FY1 1m (%)" "EPS Upgrade FY1 3m (%)" "EPS Upgrade FY2 1m (%)" "EPS Upgrade FY2 3m (%)" "Country" "Sector" "Industry Grp" "StockRank Style" "Mkt Cap GBP (m GBP)" "Shrs" "Cost (GBP)"
I have found the problem.
I'm guessing that i built my custom table view before the stocko guys did some fixing of table views behind the scenes.
My custom view exports flag, name, ticker and i cannot change them
The other table views export Flag, ticker, name
I'll fix the spreadsheet tomorrow and reissue it
Yes. I wonder how often they do that and why. Perhaps they should notify us to avoid situations like this.
If like me and a few people who've fed back to Phil, you find the technical analysis is quite daunting and struggle to understand Ichimoku I've found a great 6 minute video which made it really clear for me and boosted my confidence in trying out this strategy.
?si=7KQloWHYN3wN70PjThanks to Phil and his excellent sharing of approach and his video channel I added the US region to my Stockopedia subscription yesterday and already have a few ideas to research/contemplate which I might buy next week.
Thanks again for sharing Phil, I think you've inspired a lot of people.
Thanks wildshot,
First there are a lot of ways to trade Ichimoku and many use the varying signals as entry positions. I personally don't like his description of the lagging line (he turns it off - lol)
Also in a strong uptrend that may last many months, the Tenkan Sen & Kijun Sen might cross several times as the uptrend catches it breath and profit taking occurs. Whilst the crossing of Tenkan Sen bleow the Kijun Sen generates a Bearish Signal it would be considered a weak Bearish signal if it occurs above the cloud. In essence it's saying "Shrug, we're in an uptrend and this has occured but it's not as significant as a cross below the cloud"
A weak bearish signal won't make me sell but it might make me wait before buying.
At one point he suggests entering a trade when the price breaks back above the Kumo (which is a valid signal that some buy off) but if you look left at that point the price is stuck within a band of consolidation (potential shadows hanging over the price potentially preventing price appreciation). Whilst some might take this trade (any many Ichimoku traders wouldn't) I wouldn't because I want a stock to be trending.
Best of luck
Hi Phil,
Only have a UK subscription currently so very few shares meet your strict screening criteria. Not looking to implement your system at the moment but interested to see if I have grasped the fundamentals so I can possibly follow it with a expanded Stock subscription. Hope you don't mind my seeking a view and not a recommendation bearing in mind your response to Peter T.
At the moment there are two companies Fresnillo (LON:FRES) and Halma (LON:HLMA) appearing in the screen so interested to see if I have your analytical approach clear in my mind. With regard to Fresnillo (LON:FRES) the Stockopedia Report shows the EPS consensus forecasts are strong and trending upwards but some of the financial metrics are bit variable particularly in 2022/23.. This likely to be the consequence of the business operating in the commodity space (Silver/Gold mining) which is inherently cyclical. I guess it might just make your first phase screen though you might be a bit wary. Moving onto your 2nd phase analysis using the ichimoku Indicator (not strong on the Japanese technical terms!):
Given this if I have grasped your approach I would think this stock might be in a consolidation phase and would steer clear.
Moving on to Halma (LON:HLMA) the Stock report looks excellent but my 2nd phase analysis would pretty much mirror that on Fresnillo (LON:FRES) - the ichimoku graph looks remarkably similar and given the very high forecast PE in excess of 30 and low Value rank of 6 this would probably be a no too. Though to be fair over the years Halma (LON:HLMA) has always been highly valued and has been a fantastic multibagger for investors (not that I have ever held it!)
Interested to hear if you have looked at these stocks and what your thought process might be. Thanks
Hi ACounsell,
So Fresnillo's history of earnings doesn't inpsire confidence in me.
Despite their EPS upgrades looking good, I saw this trio of graphs and had almost made up my mind instantly.
For example their margin has been up & down and that's translated into unpredictable profit. In the Stocko data 2024 was their best year for revenue and yet the worst for profit. I'm sure there's some reasonable explanation but I just move on as the risk is I'm seduced by the narrative of the CEO.
The issue with fishing in a small pond like the UK is that the best look like a good choice but compared to the wider market they are found wanting. I screen other miners with better track records and it allows me to sidestep stocks that can induce uncertainity. Now it could be that Fresnillo have transformed their business, opened some new mines, hit a rich seam and they will do very well but for me there are better options else where (even if I have to pay for subscriptions to international services, fx fees, withholding tax, etc)
With respect to the chart for Fresnillo. The low on the 21st October is going to be in place for quite a while so the only thing that will raise the bottom of the cloud is if the price can break the recent high on the 17th October. This sort of high to the left of the price action is called a Shadow in Ichimoku. So if I was to enter this stock I'd want the price to close above the Shadow which in turn would pull the cloud up, put the Chikou into clear terrritory and hopefully establish the uptrend.
What a contrast with Halma!
An ok EPS upgrade graph with a general uptrend apart from slight downgrades in Mar & Apr.
Pretty static margin but they have managed to increase cashflow. My only concern might me that 2026 PEG is 4.16 which is high suggests that the rate of growth they have achieved in 2025 is not sustainable and they might be punished for that later (?)
With respect to the chart it's a very similar story. The bottom of the cloud will remain flat for quite a while unless the price can break the spike high (shadow). If it does that it should get the cloud trending diagonally and hopefully put the Chikou (lagging line) in nice clear territory.
Notice in my analysis of the cloud I don't really do a lot of looking back.
I'm asking:
1) is the Chikou clear and above the cloud
2) is the price action above the averages
3) is the price action and the averages above the cloud
4) is the future kumo bullish
5) are there any shadows to the left that might hinder progress
6) are there some magic numbers up ahead that might hinder progress, e.g. £10 and how has the historic price reacted to these numbers in the past
I hope this helps to explain why I love stocks setting new highs
With respect to consolidation I would summarise it as ...
1) If the chikou is beneath the historical price action and is above or in the cloud we are in consolidation after some bullish activity
2) if the chikou is above the price action but has less than 18 bars clearance then we are at risk of consolidation
3) if the chikou is above the price action and had 18 bars or more we are potentially trending bullishly (but need confirm that by looking at the other elements of the chart).
For Halma, the chikou is a little too close to the hisstoric price action on the 27th Oct plus it has the challenge of trying to clear the spike Shadow from the 20th Nov. As I said in the previous post I would want to see the bottom of the cloud rising to confirm trendign behaviour.
Fresnillo's chart has less challenges but again it does need to break the recent high to get the bottom of the cloud to start rising, so one could argue it's at less risk of consolidation but hs not yet convinced me it's trending.
Hi Phil,
Many thanks for this response and your earlier one at 11:56 am. Very comprehensive and much appreciated. I will study in detail and try to enhance my understanding of your approach. Also just watched your latest Video on the Google spreadsheet that tracks all your investments. Very impressive and that will take me quite some time to understand fully! You must have put an awful lot of time into developing it and it is great that you are happy to share the development with other investors.
In Part 7 of The Quality Momentum Blueprint, I introduce my Portfolio Tool — a custom Google Sheets spreadsheet designed to automate portfolio oversight and support disciplined sell decisions.
This tool integrates with Stockopedia via CSV imports and includes powerful built-in logic to help track performance, evaluate sell triggers and maintain consistent decision-making. I’ll walk you through installation, configuration and real-world examples of how I use it to improve portfolio management.
Hi Phil,
Totech (TYO:9960) has popped up on your screen and it looks pretty good to me at first glance. Both the fundamentals and the Ichimoku setup are interesting, but there are a few things that make me a bit hesitant. To see if I'm understanding your process I’m curious if you’ve gone through this one yet or have an opinion on it. If you’ve analysed it already, I’d be interested to hear where you think the risks lie—especially on the Ichimoku side. Maybe a consolidation phase coming? Maybe wait for a buy price Y3185 to Y3230?
From the stock report, the EPS chart is fairly steady without any real dips and even shows a little flourish at the right end, although only one broker is covering the stock (does that put you off at all?). Quality metrics look strong: ROCE, ROE, and margins have been rising consistently. The balance sheet is clean with net cash. Revenue and EPS growth look solid, the company pays a dividend, and despite some fluctuations, the overall trend is upward. Stockopedia gives it a 98 StockRank with 98 Quality and 88 Momentum.
Valuation still looks reasonable for the profile: forward PE about 10–11 and EV/EBITDA mid-7s. Not deep value, but still OK given the profitability and cash generation. Value score is 71 - A high score for your screen.
On the technical side — and referring specifically to the IchimokuTrader.com chart — the Ichimoku setup looks bullish. Price is well above the cloud, there has been a bullish Tenkan/Kijun cross, and the future cloud is green and rising. The breakout level around 3230 (the Kumo break) seems like potential solid support, and the Kijun area around 3185–3230 looks like the key zone to watch for any pullbacks. The only slight amber flag is the Chikou span’s recent neutral bearish signal — not a breakdown, just a sign that momentum might be softening a bit. But overall, the structure still seems intact.
Hi Peter,
Great analysis again.
So again, I want to develop everyone here into autonomous decision makers but I also realise that you are trying to understand how I execute my process.
As a general comment I will respond with generosity to questions like Peter's where he has given a rationale rather than just saying "Totech has appeared on the screen, what do you think?"
Anyway now that's out of the way ...
The only thing on the StockReport that drew my attention was a large capex expenditure in the trailing twelve months. Maybe that investment will help them generate better returns. That said they have paid down their debt over recent years.
On Nov 11th they recently reported earnings and whilst the data is on Stockopedia it's not that easy to tell whether they beat expectations. Looking on TradingView I can see they met expectations for EPS and beat revenue expectations. The share price has risen since that announcement although one could argue "if they had more revenue then why didn't they beat EPS expectations?"
That aside onto the chart ...
The lagging line (chikou) has 20 bars clearance which is good but getting close to being touch and go (I've been suggesting 18+ is a good measure). Future cloud is bullish, price action above averages and all above the cloud. This could be a buy!
What else do I notice ... the price spiked up to 3500 (a nice round number), looking left the price seems to have a habit of bouncing off multiple of 250 and then consolidating, e.g. 3250 in Aug, 3000 in June.
One argument is given that the chikou is getting marginal one could be tempted to wait to see if the price can break 3500 lifting the chikou into clearer territory and giving greater confidence that the trend is established.
A contrary opinioin might be if you zoom out you can see "Yes the stock does go through periods of consoldidation yet since the earnings report in May '25 this stock has been in a solid uptrend and has been supported by the cloud."
It's interesting as I'm trying to harness the post earnings drift phenomenon however most of the price appreciation for this stock happens pre earnings report and then it consolidates. Insider information being leaked perhaps?
Not sure if hope that helps :-D
WRT Chikou Span Cross I think that's a bug in the IchimokuTrader.com site? The price did drag the Chikou below the price action but on the 29th Sept the chickou crossed above the price action drive by the close on Nov 6th which is a bullish signal. The closing price on Nov 6th was just inside the cloud meaning it would have been a Neutral Bullish signal. I'm going to contact the site and report the issue
So the feedback was that you only get a Bullish Chikou Span cross signal if the chikou is rising as it crosses the historical price action
I was asked a question over on YouTube about holding periods and I thought some here might like to see my reply...
I've created a quick distribution graph documenting the distribution of days held for my current holdings. I've excluded two outliers which I have held for 1464 days, one is Celestica where I have already banked a 1500% profit and I'm currently running some of my original investment at a 2380% profit and the other is Ferronordic which I can't sell due to an embargo as a result of Russia's disgraceful invasion of Ukraine (that's currently an 87% loss).
As you can see as of today the peak of the distribution lies around 100 days with the average being 93 days.
Obviously what you will find as you look back at my data is that I will ride the momentum of winners for a lot longer than my losers.
The 2nd image is a list of big winners (Celestica data is a bit out of date) and the 3rd image is a distribution of days held for the big winners where the average is 871 days!
Ride that wave
With the importance that Phil and Ed (in his previous webinars) and I'm sure many others place on the EPS graph is it possible for Stockopedia to add that to the screening results view in future? e.g. Where you get table view, chart view and bubble view. Being able to see the EPS chart for multiple stocks at once would be very useful.
Could it be configurable? So some might want to see revenue graphs over time, others net income, other margin?
Whilst we are on this subject. I would love to be able to overlay different rankings on the chart view. I know that you can see the stock rank on the simplified chart on the main stock report page but I would love to be able to add the stock rank (or any of the variations) onto the more detailed charts.
In part 6 of The Quality Momentum Blueprint playlist I pull together the content of the previous videos and demonstratre how I use the Stockopedia screener, StockReport Analysis & Ichimoku Chart Analysis to filter 10's of thousands of stocks down to 3 candidates in under 20 minutes.
After listening to viewer feedback it also includes a simplified approach to Ichimoku analysis, plus at the end I have a tease about a Portfolio Tool I'm working on to help with my sell rules which involves exporting your Stockopedia portfolio to a Google Drive based spreadsheet via some simple automation scripts I've been working on.
Enjoy!
Thanks Phil, your latest video is very informative & useful.
Thanks for sharing Phil
Two UK listed miners making the screen, Fresnillo (LON:FRES) & Atalaya Mining Copper SA (LON:ATYM) - not tempted, however.
A new Japanese stock NEC (TYO:6701) looks worthy of further research, however. Would be interested in Phil's view.
Hi Peter T
Yes I have just picked up on that and would be interested to hear Phil's view. The metrics that Phil considers would probably result in him giving Atalaya Mining Copper SA (LON:ATYM) a miss but Fresnillo (LON:FRES) would seem to fit his criteria - EPS upgrades over the last year with the graph rising left to right, good step upwards in most of the profitability metrics, etc. Also the share price graph is way above the Ichimoku Cloud so I think this mean plenty of safety margin. On October 31st they announced the cash acquisition of Probe Gold (TSE:PRB) a Canadian gold miner with exploration acreage. This if completed (projection end 1Q 2026) provides diversification in a safe and mining friendly jurisdiction vs. their silver and gold operations in Mexico. However, though it would seem to fit the bill the share graph is pretty scary with it having 3.5x bagged in 2025 (!) and as a result Fresnillo (LON:FRES) has a punchy PE for a miner of 16. Obviously future strong performance depends on how the silver and gold prices go from here! Not sure if I would be tempted either given the rating and the bull market for both silver & gold having run for quite a while but then I'm usually wrong!
I don't think Fresnillo (LON:FRES) would fit the buy criteria, as the Chikou Span line is clashing with the candle bars. Phil demonstrates this with a few examples in his latest video.
af20001
Just watched the Phil's latest video and I can see what you mean about the Chikou Span (lagging indicator) when use the 1 yr time frame. One question I do have though is what time period does Phil look at when using Ichimoku analysis because a 5yr chart on Trading View look very different to a 1 yr chart. Guess I should probably ask Phil!
I just use the daily chart and really you only need to see the last few months data to make a decision on whether to buy
Hi PeterT,
NEC (TYO:6701) is interesting but I would like it set highs pulling the chikou clear of the price action. It has about 13 bars to clear the recent consolidation.
Thanks Phil, Do you have a set size for the rectangle you draw? How many bars clearance are you looking for?
I usually eyeball it but if the largest the gap can be is 25 bars (as the chikou is the close price pushed back 26 days) then I'd suggest a gap of 18 bars
Hi Phil. Simple tip that may save you a couple of mouse clicks in your process . Rather than save the Stockopedia output as CSV choose the "copy to clipboard" option. You can then paste that directly into your spreadsheet. Format and data should be identical to CSV conversation/import.
H i DaveR,
Thanks for that! I've been doing the cut & paste malarky for years and then in the process of trying to simplify the process for less technical people I think I've built quite an elegant solution. I've shared it with a friend for a test drive and I'll look to share after I've demonstrated it. I'll try to record the conclusion video for the buying process today and then in the next video I'll walk the audeince through it as it sets up the narrative of how I maintain my positions and then how I decide to sell.
Stay Tooned!
Thank you Phil for making this information available. I have struggled to find a simple strategy that I can sleep at night with and you have given me a great starting point.
For a more newbie I would ask if you could give a bit more detail on these spreadsheet you create. Do I need to do it all the time? What info do I need from them?
Also , your comments on 'charting' was eye opening but I am still struggling to get my head around them. I have watched various videos on You Tube but they seem more targeted at day traders. Any suggestions for learning about charting for non mathematicians?
Hey Sharon,
Thanks for your comment and it's good to hear that you can relate to the content and it makes sense.
I think when I introduce you to the spreadsheet, you'll understand how I use it to keep track of my investments and how I decide to sell.
There should be no need to understand formulas or create new ones. The template I've built should do it all for you. Once setup, it'll be a process of exporting your portfolio from Stockopedia, copying it to Google Drive and importing it into a copy of my Google Spreadsheet Template.
I've built a full set of instructions that takes users through the setup process.
It tracks the key info from my screen, e.g. StockRankStyle, Earnings estimate upgrades & Ichimoku trend (which you have to keep updated manually) and it gives you suggestions on where to place your stop loss, when to sell, where to place a stop loss to take profit. It's currently being tested by a friend before I set it free!
With respect to the Ichimoku charts, I've been thinking about how to simplify the initial vetting of the charts after a comment from a viewer who said they found it overwhelming (thank you viewer for the feedback). If you rewatch the charting video and focus in on the last line I introduce ... The Lagging Line (Chikou). When buying you need to ensure that this line is above the cloud (bullish) and it has plenty of space between it and any surrounding price action (this means the stock is it trending). In the video I draw a red rectangle and place it on the tip of the Chikou to help me visualise the risk of consolidation.
Don't worry about the maths, I only included it to help people who would want to know how it's built.
Honestly there is enough content of charting (Technical Analysis) to keep your reading for many lifetimes. Is it important to understand it all? In my opinion No! I just know the Ichimoku stuff helps me but I don't have to know why for example they chose 13, 26 & 52 day periods in its construction. I just know it helps me.
Not sure if that helps.
Thanks for watching
Thank you Phil. That's a fabulous answer. Just the tonic!
As my Irish grandma would say: " you'll get your reward in heaven ( for your generosity)
Not sure if this question has been asked but interested to know what percentage of your total returns over this 13 year period has been contributed by Celestica?
As of today I make it 37%
re: The Quality Momentum Blueprint screen not returning many results at the moment...
This is good, it's the screens way of keeping you out of the markets when it sub-optimal. Lots of companies won't pass the screen because they are off their 52 week high by more than 10%.
Just be patient!
With the markets on a knife edge at the moment hold your quality bar, don't be tempted to loosen your buying criteria.
For me if the screen doesn't generate options I look to other markets, e.g. I have bought 4 Japanese stocks over the last two weeks.
Regarding Gold Miners, after the recent pull back they are holding up against the prevailing market more effectively than my other holdings. I'm no gold expert but if the market does get really wobbly where are investors going to put their money?
Finally I know I haven't completed the video series on YouTube, it is a work in progress. Each video takes time to plan and shoot. Then there is at least two days editing (if it goes well). So please bear with me. I mention this because the candidates presented by the screen are not all buys for me. Remember, my process is (links to each video) :
One commentator on another thread indicated that they had bought a European Retailer that appeared on the screen which I suspect is Clas Ohlson AB (STO:CLAS B). I wouldn't have bought this stock as it would have been rejected at stage 3.
(To view the image in more detail, put your mouse over the image hit the right mouse button and select "open image in new tab" from the context sensitive menu and it will give you a new tab in your browser with a larger image. This image is from IchimokuTrader.com)
The KijunSen (medium term average) & TenkanSen (short term average) are below the cloud (Kumo) and the future Kumo (the cloud to the right) is still Bearish. This is not a buy for me!
I hope that helps
Phil
Also whilst the lagging line (Chikou) has cleared the price action, it is has no vertical breathing space. A modest drop in the price and it would sink back into the historical price action and be consolidating.
Ask yourself ... why would I invest in a stock that is consolidating? ... and especially when the markets are so edgy?
Morning Phil,
I’d like to echo the positive comments from previous posters — I’m really enjoying catching up on your YouTube videos (subscriber), getting into the details of your process, and following this Post started by Ed (Thanks to Ed for helping bring all of this to the fore) I’ve also made a couple of small trial buys from your screen and am happy with them so far.
I was intrigued by your comment about buying four Japanese stocks. I assume you’ve extended your QMB screen to include Japan — have you added any other countries as well? I’d also be interested to hear which Japanese stocks you chose, though I completely understand if you’d prefer not to say.
If I had to guess, I’d say 6454, 9551, 6834, and 6368 — hopefully including 6834, given its 22.48% jump yesterday. Others on the list would be 1720, 1961, and 2317.
Morning Peter,
Many thanks for your generous feedback.
As well as the countries listed in my screen:
"Canada", "United States", "Denmark", "Finland", "Ireland", "Norway", "Sweden", "United Kingdom", "Italy", "Portugal", "Spain", "Austria", "Belgium", "France", "Germany", "Netherlands", "Switzerland", "Australia" or "New Zealand"
I have also been looking at Japan. It is delvering quite a few good options that are cheap on a PEGR basis. It's very much early days for me with this though.
Frustratingly I did try to buy Seikoh Giken Co (TYO:6834) last week but I can't place it in a SIPP or an ISA so had to pass.
So once again these are NOT buy recommendations but if it helps people to look at the stock reports and the price action to see which I buy and which I reject so you can think about your approach then we are good.
I bought Max Co (TYO:6454) this week & I have a market order in place to buy Organo (TYO:6368) when the markets open on Monday.
Metawater Co (TYO:9551) must have just popped up on my screen as I didn't notice it this week, StockReport analysis looks good but there is a risk of price consolidation as the lagging line (Chikou) is running out of time to clear the price action. I'd probably wait with this one either for the price action to appreciate pulling the lagging line above the historical price action or wait until the lagging line pushes through the historical price action and gently improves into clearer territory.
I also own Sanki Engineering Co (TYO:1961) , Fujikura (TYO:5803), which I bought about two weeks ago if I remember correctly.
I bought Asics (TYO:7936) on or about the 28th October and this in hindsight was not the best buy. Here's a snapshot of the chart that day.
I took a chance that the recent share price move would continue pulling the lagging line away from the historical price action below. Instead this happened:
Looking back at the first image, the lagging line (grey) is clear of the price action but has very little margin below it. Also notice the recent highs to the left, in Ichimoku terms these are called Shadows and they are often hard to break out of. I should have waited to see if it could have set new highs before I got involved.
Also I'm a bir of a runner or I was until I snapped my Quad tendon a couple of months ago and my preferred trainer is ... Asics. Did I fall into the trap of loving a stock? C'est possible!
I looked at Systena (TYO:2317) , the EPS estimates are improving recently but not ideal and I wouldn't have bought it due to price action consoldation.
Not sure if that helps
Best of luck
Phil
So a test for you now Peter ... whilst Tokyu Construction Co (TYO:1720) passes my screener what would have stopped me from buying it? Please consider both the StockReport and the price action
Hi Phil
Thanks so much for the speedy and detailed response on the Japanese stocks. Very interesting, helpful and a stimulus for more research on my part (including understanding shadows better)
So sorry to hear about your quad tendon rupture, I hope it’s not too painful and debilitating (although I suspect it is) I assume surgery is involved and several months of recovery. Hope it all goes as well as it can for you.
Now, onto the my rudimentary answer to your fun little test:
To be honest, when I was quickly trying to guess which four of the seven Japanese stocks appearing on your screen you might have bought, I opened the Stock Report for 1720 intending to jump straight to the EPS chart. However, I got side tracked when I noticed the price chart at the top: the shares had pulled back from the 9 September 52-week high. Out of habit, I opened the Charts screen and added the 10- and 20-day moving averages, which confirmed that both had slipped below the 50-day. That already made me doubt 1720 would make the cut — however, getting back to the main analysis:
Although Tokyu Construction (1720) passes the screener and looks respectable from the Stock Ranks, the price action seems the clear reason you would have rejected it.
From the Stock Report the company is OK but not compelling.
Amongst other things, the EPS chart includes a downgrade along the way albeit on the left half of the screen with the right half improving, not ideal, the earnings history is uneven, margins are thin, and long-term EPS and profit trends are not consistently upward. Momentum is also weakening, with the shares sitting below the 52-week high and negative 3-month relative strength. Maybe nothing here is a dealbreaker for you, but none of it strengthens the case for buying either and reinforced my pre-existing view that 1720 wouldn’t make the grade. I would have rejected it by now, however:
Technically, the Ichimoku chart makes the decision easy. Looking at the chart on ItchimokuTrader.com: ( I struggle with Stocko's version and haven't tried Trading View yet)
The share price has dropped below the cloud, and October–November produced a cluster of strong bearish signals: the Senkou Span Cross, the bearish Tenkan/Kijun Cross, and the bearish Kumo Breakout. The future cloud is red, confirming a negative forward trend. The more recent weak bullish signals can’t compete with this.
Hit the reject button and move on (if not already done so) It will be interesting to watch how this plays out in real life over the next days and weeks.
Looking forward to your next YouTube video. Thanks again for sharing your knowledge and experience. It really is much appreciated.
Quad tendon made a very loud crack when it snapped. It's not really been that painful but it was debilitating but I am getting there.
Excellent analysis. From memory the EPS graph wasn't good and what also stood out for me was the thin margin. I passed before looking at the Ichimoku but it's good practice.
It's interesting that the Japanese stocks use numbers as tickers it makes it harder to build a relationship to them and i would suggest it makes it easiest to be objective.
Glad your enjoying the content.
Hello Phil - I'm relatively new to this so forgive me if in advance if I have got this wrong. I have tried to recreate(or have attempted to) your Quality Momentum Blueprint screen following all your criteria but has returned for all regions (excluding AUS & Japan) 0 results. Did I do something wrong? Pls see below the criteria used. I'd be grateful for your feedback.
https://www.stockopedia.com/sc...
Hi,
There's quite a few differences between our screens.
The best thing is to go to my screen and make a copy.
Here's a link ... https://www.stockopedia.com/sc...
Very grateful for the ultra swift reply. I am rather confused as I followed (or at least tried to) all your criteria by copying them as displayed on the video. If you could spend 5secs to point out the differeneces -I'd be indebted. Thanksa agai for all your help.
Ignore prev comment,
you use net mgn instead of net profit
you have a net gearing test
you don't have my net debrt test
you have PT/B < 0 I have PT/B > 0
etc....
Thank you very much indeed for taking the time. Your videos, webinars, comments etc. are first class material.
All bar 1 of my holdings are showing red for daily change today. The only winner is the embargoed stock I can't sell. The market is laughing at me!
On days like this I:
Best of luck
Phil
So I want to reiterate ... I'm a Farmer not a Hunter!
If you don't know what that means then please read Ed Croft's excellent Stockopedia article The hunter and the farmer - whose side are you on? or the extract from my What is Factor Based Investing? video where I describe the difference between the approaches.
So I'm a Farmer. I invest my capital in factor rich territory.
So imagine an arible farmer has to plant 10 acres worth of wheat. He doesn't examine every wheat kernel to ascertain if it has fungus, pest damage, weather-related stress or mechanical damage. Rather he buys his grain from reputable suppliers and knows that there will be some grain that will not germinate but on the whole the crop should be successful.
Not every investment will win. In fact Stockopedia's analysis of my track record showed I only win 57% of the time but I win 2.4 times as much when I win as when I lose.
Remember the Top QM Rank Stock Screen is truly mechanical. It selects the top 25 stocks and rebalances every quarter. No analysis of the firms, no concerns over sector weighting ... nothing! Since inception in 2013 that screen has returned over 500% in the UK and close to 800% in Europe. Looking at the current candidates there is only 1 Highly Specualtive candidate and that is Frontier Developments (LON:FDEV) .
I strive to be as ignorant of the companies I invest in as the software that selects Stockopedia's Top QM Rank candidates. It pays attention to the quantative data that is driving the screen and ignores other non-prioritised qualitative data and the quagmire that is qualitative opinion.
I recently bought shares in Comfort Systems USA (FIX); Gigacloud (GCT); and Everquote(EVER). Q/M seekers may like to screen.
Thanks for this helpful video and the webinar with Ed. My research and portfolio have been enhanced. I'ts great to be learning at 80.
A bit later than planned (let's call it artistic differences between the recording technician and the editor) but here's my intro to Ichimoku and an initial overview of how I use some of the components when buying and holding an investment. I hope you find it useful ...
I've had a lot of lovely feedback so thank you. One of the most frequent comments is in relation to my disciplined approach and I've been letting that percolate for a few days. Whilst editing a video on my use of Ichimoku I came to realise why I might be so disciplined and why a rationale and dfined rules are so important to me.
A while ago I was so frustrated at a lack of Ichimoku chart support (as well as Point & Figure charts) I developed my own Java apps that could produce these charts from Yahoo finance data. Once you are able to chart Ichimoku (or any indicator) you can then start to consider the signals they offer. Then you can defne a set of signal filters that allow you to screen a set of stocks for Ichimoku signals and that is what I did. I used to run a Stocko screen, take the tickers from the candidates and run them through my Ichimoku screner.
And I think this is where my discipline comes from .... when trying to define a rule within software it can't be subjective I have to specify a rule that passes or fails. In defining those rules I have to understand Ichimoku and what I'm trying to achieve.
Truth be told if I could automate this whole process I would whilst keeping a watching brief.
Video is coming soon ...
Very inspiring and great so see a subscriber have such success. For years I've followed Ed's writings on the value and success of the ranking system but rarely put it into practice. Phil you motivate me to change my ways. I've subscribed to your YouTube channel and am currently working through your videos. Thanks for sharing your story.
Thanks wildshot, your story really helps to movtivate me to keep filming and editing.
The explanation on the learning pages blew my mind so if Ed could provide a learning video on the Ichimoku Cloud that would be most welcome
My next video in the series will be looking at the price action I'm looking for and to explain that I'll need to include an introduction to Ichimoku.
As promised ... In the video I take the candidates from my screen and show you what I look for in each StockReport.
I hope you find it useful.
Thanks for sharing your videos on your process. This one in particular shows how impressive, yet straightforward your selection process is. It's the simplicity of checking a few key metrics on each stocks stockreport that really stands out. Why make investing complicated?
I'm close to finishing editing part 3 of my series where I scan each stock report. I've been editing for two days ... it's a very time consuming process.
As everyone else has said, an excellent video/article, many many thanks Phil for taking the time to do it and respond to the comments. It's inspired me to do similar as my preference tends towards momentum rules based investing. The main takeaways for me other than the strategy itself are
1. Expand your universe rather than loosen the rules
2. The elevator pitch. I originally got this from a book I read (Clenow I think) but clearly write down in very simple terms what you are trying to achieve with a strategy, what it is, how you go about it and define the rules. If you can't do that then you don't have a clear strategy.
I also learnt how to do new things that I didn't know existed on Stockopedia!
And if I take out 5 stocks I bought this week it's 112
Thanks Phil and Ed for a great session. One question occurred to me - how do you take advantage of market corrections with this system, as by definition a lot of great stocks will move more than 10% from their 52 week highs and so fall out of the screen?
Thanks garry, at the moment I don't attempt to exploit market corrections for buying
Thanks Phil. One final question - very few stocks get through your screen, how many new purchases do you make per year on average?
So far this year I've made 62 purchases!
The 62 are all buy trades over a 10 month period? Phil is it the case that you trade on momentum and as a result you trade often? It’s the polar opposite of buy and hold and maybe the key driver to your stellar performance. Nimble and active investing seems to be what is now required in a fast changing world. A buy and hold strategy seems to be far less effective.
Yes 62 in 10 months.
Yes I folllow trends driven by growth being delivered by high quality companies.
My average holding period for my current 28 holdings is 131 days but I've held Celestica for 1440 days!
If you adjust for Celestica, the average holding period for the other 27 shares is 82 days. Would such a churn rate have been typical for the period? I hadn’t appreciated such an activity level. Thanks
I was thinking the same. Is the holding period of approx 3 months a significant element in Phil's stellar performance. Is the momentum aspect of the strategy so critical that anything less than a momentum rank of 90 dilutes performance.
62 trades suggests that the results of the screen must change quite often in order to throw up so many trades, especially given that Phil is a bit wary of companies at the bottom of his results list with high PEGRs
I've just built a quick pivot table on my transactions since 2013
Things to note ...
2025 has been a busy year in relation to previous years with most activity taking place during quarter 1 & quarter 3.
in 2022 I made no trades (buys or sells) at all. I simply sat out and waited
And so to a possible explantion ... When there is certainty and stability in the markets, companies and analysts can be more confident in their predictions . Remember I exit on:
Whilst I don't exit my trades when the market slides if the S&P 500 chart that looks like this for 2025 ...
and like this for 2024 then I feel this goes some way to explain why 2025 has produced a higher tunover rate.
Add to that a capricious and vengeful President then you have a market that is less predictable.
I hope that helps
Well, Celestica (NYQ:CLS) has beat on revenue and EPS for Q3. Now we just have to wait until the market opens tomorrow to see if it's beaten enough to keep the momentum going...
Celestica (NYQ:CLS)
+9% in the after-hours market
https://www.google.com/search?...
Hi Phil/Ed
Thank you for the webinar - it was great and I thoroughly enjoyed it.
A small request if it's okay (and one I asked many years ago via the green button):
Would it be possible to bring back Fantasy Funds?
My main reason for the request is that I used to follow Phil's portfolio (the time when he owned Trigano SA (EPA:TRI) and Corticeira Amorim SGPS SA (ELI:COR)) and as I was relatively new to investing I found it insightful to see how other people managed their capital.
It is a shame that we can no longer follow other portfolios and contrast them with our own style.
Thanks again
Abs
Very interesting session which posed me questions as to how best to cover international markets! I find when to sell very difficult and certainly the recent movement is SRB highlights the need to recognise whether falls (c20% in this case) are sell signals or buying opportunities! I have a tendency to hang on too long and that is what I am currently doing with SRB!! But I wonder if the application of some rules would have prompted a sell signal!!
Great seminar from you both, despite technical hitches!
I'm going to try this system on one of my ISAs and see how it works for me. I had previously only looked at UK stocks with half a dozen calamitous ventures into US ones. However, I've just added US, Canada & Europe to my account to see what comes up (the 12 or 13 that Phil had in the seminar).
Phil, you mentioned that you run a spreadsheet too. Intrigued to know what you keep in it as the Stocko data & AJ Bell systems seem to provide most of what we need.
Again, great seminar! Must watch more. Have joined the GrowYourDough YouTube channel (makes a change from endless mechanical videos about Jaguars!)
Hi David,
I will talk about my spreadsheet later in the YT series but I don't want to overwhelm with too much data/info and scare people off.
Fundamentally, I track the data that was in my initial screen, specifically, Q & M ranks, 1m/3m EPS upgrades for FY1/FY2, the manually recorded state of the trend (bullish/consolidating/bearish) and my stops.
It's all in one place and with a Google finance spreasheet I can retrieve price info and compare it against my stop and use conditional formatting if it gets too close or too far away from my stop.
The spreadsheet becomes like a dashboard (Red/Amber/Green) - if only it was that simpele :-)
I still use a couple of screens I duplicated from Phil many (many) years ago. I’ll watch the webinar and see if I should be updating them with your latest filters.
Thanks Carey, that's nice to know, I hope they have been profitable for you
"I still use a couple of screens I duplicated from Phil many (many) years ago"
I do as well. They've been great over the years at helping me find new companies, so here's a belated thank you to Phil.
Well I have to say I'm really moved that I've been able to generate some ideas for you
Hi Phil, thanks for sharing your screen and process.
Like the NAPS portfolio, it shows following a strict set of rules can really pay off.
Is there anything you can add about your losing trades? Was there anything they shared in common? Just wondered if more of the ones where you'd prefer slightly better metrics (e.g. as highlighted in your discussion of Vertiv Holdings Co (NYQ:VRT) below) went on to be losing trades, or were the losers just because of bad news or flagging momentum for example.
Thanks af,
Unfortunately I haven't done that analysis
Phil has done amazingly well. A less intensive approach would also have yielded this result, though. VM >90 has also returned 17% per year, amazingly. Would have taken a lot less effort but obviously have been a lot less fun too!!
Hi doctor dave,
Congratulations!
Please can I ask what time frame that is over and what markets?
Please describe your approach so others can evaluate that?
Is that a NAPS based VM approach with annual/quarterly rebalancing?
I must say having looked at the VM charts I am tempted (when I have time) to look at a VM approach too, particularly in the UK, Europe & Canada
Best of Luck
Hi Phil, no it's not my work it's all Ed's!! I follow it quite closely though. It's the UK VM>90 selections. Since 2011 it's returned 17.9% annualised. When any share falls below 90 it is dropped from the portfolio is my understanding. At the moment there are a record 100 companies in the group. Of course there are no trading costs involved in this imaginary portfolio but the churn rate is surprisingly slow. I follow as closely as I can now but still have occasional rushes of blood to the head, some of which work out (Filtronic (LON:FTC) and some of which don't (Beeks Financial Cloud (LON:BKS)
Ok, since watching Phil’s strategy I’ve spent a day on ChatGPT deep researching ways to improve the strategy. I’ve come up with this and would appreciate any input…
Regime-Switching QM
Idea: run two sleeves and change the mix when the market turns risk-off.
Risk-On (full throttle)
- S&P 500 > 200DMA
- % of S&P members above their 200DMA ≥ 50% (breadth confirmation)
Allocation: 100% to QM Core (30 names, equal-risk sizing if you like)Risk-Off (defensive)
Keep your stock exits (RS 3m < 0 and Price < 120DMA) regardless of regime.
Why this beats & smooths
What to expect (ballpark, net of costs)
Strategy
Return (median, 1y)
Volatility
Max DD
Your current QM (30 stocks)
+17–21%
Medium
−12% to −18%
Regime-Switching QM
+18–24%
Low-Medium
Apologies max drawdown on switching QM is missing in the table it should read -7% to -11%
It might be an approach worth following however my fear would be that:
1) by the time your risk on indicator signals then you have missed most likely missed the slump risking selling at the worst point
2) by the time your risk on indicator reverves many of the big recovery gains have been made. The US market loves to buy the dip!
That said when considering entering the market you could use the indicator to suggest where might be the best destination in the current environment
My 'Hoffer Screen' - seem simple but why make life hard. Can I add 'stuff' yes of course, but has actually thrown up some nice UK cos. I was getting out of the UK as fast as could cover the loss, but seems there is 'gold in the Chilterns' (joke - its just chalk.
At least three should be in the SIPP and forget about - but has "thrown up" a few that have never heard of.
The power of the Screen to DYOR - or just buy the lot and see what happens :)
You old gold digger, you. Was it Groucho Marx who said he is willing to trust all predictions except those about the future. On this basis your screen is as good as any. I believe Ed has a recent article about the vulnerability of brokers’ forecasts.
This was a valuable and thought-provoking presentation. Just one small correction, to something Ed said rather than something that Phil said.
Hargreaves Lansdown do not currently charge 2% foreign exchange fees. They operate a sliding scale, the first £5,000 is 1% the next £5,000 0.75%, the next £10,000 0.5% and anything above that 0.25%. The dealing charge varies from £11.95 to £5.95 depending on the number of trades in the previous month.
"Hargreaves Lansdown do not currently charge 2% foreign exchange fees. They operate a sliding scale, the first £5,000 is 1%"
1% on the buy and 1% on the sale is 2% on the trade. That's how I view it.
As you point out, it is a sliding scale, but I'd double every figure you've quoted for the full trade.
HL have reduced their foreign exchange fees in recent years. They used to charge 2% on both buying and selling.
Hi Phil, thanks for your excellent presentation and your evangelical sharing of your investing methods. Vertiv Holdings Co (NYQ:VRT) is a share I have been researching but have yet to buy. It sits within the AI infrastructure space which has seen so much investment and matches the high QM rankings of all my other holdings. With a PE of 68 the share price appears to be up with events. Are you still a holder and what is your view on the potential for future growth ?
Hi,
I'm glad you enjoyed thje webinar.
Vertiv Holdings Co (NYQ:VRT) does pass my screen at the moment. Up to this point I have never held them.
They have a risk adjusted PEG(R) of 2.69 which is quite expensive although I have bought more expensive stocks.
There is some weakness is the 2026 EPS graph and periods of stagnation but there has been a recent step up. I would prefer a stronger graph.
Revenue growth is smooth ...
Operating profit is stepping up nicely ...
As is net profit including forecast profit ....
Driven by an increasing margin ...
All of which is driving free cash flow ...
Allowing them to increase their cash pile ...
And drive down their debt ...
The stock is bullish and setting new highs ...
They have just released quarterly earnings where they surprised the market by 26% (and Ed's research shows the power of the post earnings drift phenomenon)
Here comes the frustrating bit ...
Notice I haevn't said anything about what they do.
I just want to give you a sense of how I analyse a stock that passes the screen.
I have no idea if it is "up with events" or what will happen with future growth prospects.
One could argue that the EPS chart is not strong enough given the PEGR and the current price is quite a long way from the bottom of the flat part of the future cloud (Kumo) ... about 18.5% by my reckoning. Could you stomach that?
I actually screened this stock on Friday and decided to buy it but that doesn't mean you should and if you do I'd suggest that you need to decide up front how and when and why you'll exit and not seek to ask someone else. Become the master of your ship!
Good luck whatever you choose to do!
Hi Phil, thanks for your detailed reply. My focus on Vertiv Holdings Co (NYQ:VRT) is a combination of following your selection methodology and specific sector drivers.
My portfolio is up 29% YTD driven by specific sectors: gold miners, uranium/nuclear energy, semiconductors, defence. I am light on exposure to AI infrastructure and VRT is positioned at the heart of AI infrastructure, benefiting from rising Data Center CapEx and swelling order books.
Following your methodology the EPS graph is trending up albeit not strongly and all the bar charts are stepping up (net debt stepping down) with positive earnings surprise. Momentum is strong and should continue at leat for now. The AI bubble could burst at anytime and with a PE of 68, VRT would be hit hard so as you say a tight stop is essential. I have significantly improved my performance over the last 2 years by not allowing losses to exceed 12.5% on individual holdings and by removing emotional attachments to my holdings.
So in summary I will open a position but with the caveat that momentum could reverse quickly.
Thanks Ed & Phil for an extremely interesting webinar, just what we need in these rather dull UK times.
I use a similar system based on VM & Q> 75 applied to only stocks that are visually rising and within certain Ma's parameters using Sharescope for charting, and other EPS metrics.
The system takes quite a lot of time and due to my advanced age am working on a system , rather like NAPS , that can be rebalanced twice per year.................I am reluctant to hand over to a wealth manager.
I would appreciate any views you may have on approaching this subject, there are possibly a number of viewers with the same task.
Many Thanks again.
Hey Funderstruck,
Thanks for your feedback and congrats on finding a system that works for you.
Could you teach a younger member of your family (obviously someone you trust) ?
You could set them up with a small account first and see if they can follow your rules?
It is tough though?
Perhaps as we all get older we just migrate to a yearly NAPS approach?
Whatever you choose to do I hope it goes well and even if you don't hand over controls to a family member I encourage everyone here to teach their younger family members how easy it can be and get them compounding their savings.
Best of Luck
Hi Phil, Ed,
As I'm based in Australia I caught up watching the webinar on Friday. Excellent discussion guys, most informative and interesting to see how Phil, you managed to build your knowledge and apply it in the markets over time.
I think you mentioned you have 52% in US market. In terms of diversification do you see any danger of being too reliant on a single market, even though, granted, a good proportion of results of your screen may come up as US-based? Part of the reason I'm experimenting with an exclusively Australian portfolio is the sense geo-politics, the shifts of power (in it the rise of gold) and the move away from globalisation play a larger part now in risk management.
Thanks,
Francis
Hi Francis,
It is not a deliberate drive to be 52% in the US it's where the screen has led me. First I had no UK candidates, so I looked to Europe, then I wanted more so I looked to USA & Canada, etc.
The makeup of my 16 multibaggers (listed above in Ed's post) is US (6), European (7), UK (2) & Canada (1)
I think it is better to be diversified across many markets (despite the fact that they are so interconnected).
For example, I'm sure the surge in the gold price has been hugely beneficial to the Australian market but what would a Chinese move on Taiwan due to Australian interests in the region? I'm sure it would shake world markets but any prolonged tension might have a major impact on Australian shipping routes and trade?
I don't know for sure what the right answer is and there are many out there who are better placed to comment.
Not sure of that helps
Hi Phil,
I just thought, being spread across multiple markets, whether you take mitigating action if you find you are highly-weighted in a single market. Is there a risk element in a portfolio pertaining to market/region exposure? It would be interesting to see if there are any studies on this.
One issue I'm thinking in relation to the US may be the gravitational effect of USD, that due to the strength of the dollar it pulls investors towards US firms, but what additional risks are they being opened up to? It may be a vast topic to even contemplate, I don't know.
The approach with my portfolio is, in a sense, the opposite to you. I'm looking at the strength and depth of the Aussie market, looking to shelter perhaps against the effects of FX. Writing about individual companies its great to see the diversity and that Oz isn't just all about mines - I've got a tin miner but I've also got IT infrastructure, a motorcycle dealership, a university accommodation developer, a cereal producer, an engineering firm. I find as I look at each company I'm drawn to the story, the structure and strategy that is the force behind the figures and stats. The economy may have its weaknesses or bias towards certain sectors but I've found it is diverse.
Its interesting to think about say the effect of the invasion of Taiwan on the Australian market. In terms of major events, what was the effect of 9-11 on the US market? People talk a lot about the dot com bubble and the GFC in 2008... In 1987 the catalyst for Black Monday was said to be a hurricane that was not forecast the Friday before; and there is an example following a tsunami in the 2000s. My point is its hard to tell what the effect would be on the Australian economy. In a large part it may hinge on how Australia responds, what is said and what involvement the gov decides to take, how things might escalate. Australia at the moment already treads a fine line between the demands of China and the US, politically and economically, and our economy is entangled to a large degree with both (arguable if its 50/50 but maybe heading that way).
Hi Francis,
There a lot of valid questions there to which I'd answer "I don't know" to most.
To be able to "shelter" myself from say fx fluctuations across markets I'd have to have some understanding of macro economics and I don't. The risk is by attempting to shelter myself I in fact deny myself an opportunity or a hedge by being on the wrong side of an exchange rate move. At least if I'm invested in multiple currencies I'm hedging against that.
FX for transactions are another matter but personally I find the cost is a price worth paying.
Hi Phil,
Sure thing, you have some valid points. Major currencies tend to fluctuate within certain bounds over a given period so maybe FX isn't so much of an issue.
Thanks again. I enjoyed hearing of your journey from a non-financial background and how you developed your knowledge and apply it in your decision making process. I admit I learnt a fair amount from your webinar. Will check out your channel and look forward to following your progress further.
Hi Phil
Really enjoyed the webinar. Very informative. Interestingly have duplicated your screen for my UK only subscription and as you and Ed said there are no UK ‘qualifiers’. However, using the wonders of Stockopedia’s brilliant software (though the charting with Ichimoku cloud leaves a bit to be desired!) if you disable the last two screening criteria relating to Forecast EPS growth the screen throws up 2 stocks: Polar Capital Holdings (LON:POLR) and Jupiter Fund Management (LON:JUP.
You obviously think it is a profitable approach which more than pays for itself as a full Stockopedia subscription is £1200+ , Trading View monthly subscription is on top of that and AJ Bell, platform, which I use for family SIPPs, ISAs and dealing accounts and view as excellent, is not the best value particular for trading overseas markets.
Hi,
Glad you enjoyed it!
Well I'm not completely up to date with broker comparisons but I've found that AJ Bell gives me the best access to the markets and companies I'm interested in.
I've just checked my three AJ Bell accounts and at present I being charged £5 per trade.
I only have a basic/free TradingView account
I remember back in the day talking to Ed about the cost of the Stockopedia subscription and of course it has to be weighed against the size of your portfolio and what you hope to gain each year. Ed's comment was along the lines of "one good trade will pay for the subscription"
If as planned I manage to present a public facing portfolio over the next couple of years people can have a more transparent view of the performance of this approach.
Best of luck
Great work. Thx for sharing
So here's a link to my screen - GrowYourDough: Quality Momentum Blueprint so you can study, copy and modify it.
If you only have access to one market, e.g. the US or UK you might want to tick the "Include dual lists" as this might get you access to foreign firms that also have a listing in your market, e.g. whilst Celestica is a Canadian firm it also has a listing in the US
I've put loads of time and effort into trying to document my approach in a way that is accessible to others and we didn't really get to dig into all of the detail in the 90 minute webinar so please head over to the channel where I'll be producing more content to explain the process.
Cheers
My QM approach is similar to yours, with one exception: I have preferred to make company background checks prior to purchase. These checks are easy in the UK, so my QM type stocks have all been UK selections.
You have shown that relying on the relevant metrics suffices, which broadens the geographical scope tremendously. So today I signed up for Stocko “Europe” and using your screen selected 2 stocks German to buy on Monday. Thanks for the inspiration - your data-driven approach gave me the confidence to expand my investment horizons beyond the UK.
Fabulous! I am so glad you posted this. I tried to copy the layout from screenshots and got no results, so I must have missed a rule.
I have made some copies of this blueprint and played around with the settings to see what this matrix throws up. It's really interesting for me a newbie. It has helped me see the wood for the trees. The worst part of starting out is spending your time fruitfully, your work has saved me a lot of heartache and financial loss. It's actually changed something I knew I needed to spend some time mastering into a lot of interesting fun.
(Recently I went to a regional presentation from AJ Bell who also included two other well known investment houses who presented their funds/ Investment Trusts. I sat at the back comparing their top shares and strategies with the data from Stockopedia I felt thankful I wasn't putting my money in their hands. It was almost embarassing when afterwards I checked with these investment managers if my assumptions and conclusion were correct - they blanched at my questions. A friend who was sitting beside me through I was a financial guru - Hilarious!
Using this method I am not locked into a region, method or industry and that has to be a great advantage for the small investor. For me, I accept risk and I am happy that I can be a small investor and probably do better with lower costs, a wider financial net and being nimbler on my trades and strategy. Stockopedia has been a revelation and transformation for me but perhaps not for everyone)
When I started to build Grow Your Dough about 4 years ago I was contacted by the organiser of financial community events where representatives of companies are brought before the private investor community to hear their pitches. As you might well know I'm not interested in the spin of the exces, I let the data do the talking. I expressed that my hope was that private investors became autonomous investors who were able to weigh the company not on the words of the CEO or CFO but by financial metrics supported by an evidence base of research. Surprise to say I never got invited to the event. Hehe! I have no hostility to that group or that approach it's just not what I think is in the best interests of becoming an autonomous investor.
Thank you for a really interesting presentation. Much of it resonated with my own experience, though in practice I find I can still hang on to losers longer than I should. That said, the reference to benchmarks - S&P500 - as a basis for sense checking what is happening to your stocks is something I will take from this - as well as the need to consider the use of the Japanese indicator. I tend to use the monthly MACD at the moment as a barometer - with a stop loss that is rather more forgiving than yours.
It was also great in that I don't use the Screening facility on Stockopedia as you have at the moment. So putting together a screen like yours has been a useful exercise for me just from the point of view of understanding how to use it more. In doing so, however, I seem to only get one stock showing for the US and UK currently - Ralph Lauren - I only use those markets currently. During your presentation, you found 12 over more countries, but there was 7 US showing on your screen. Has the number changed since your presentation - or have i done something wrong?
Thanks for your feedback Paktuan and I'm glad you found it useful.
I've posted the screen link further up in the comments
Thank you, that has helped me to resolve the issues I had trying to copy from the webinar! I need to find the link allowing dual listings - that seems like a good idea. Is there a link to your custom report somewhere as well, as that was something I wanted to consider in more detail as well.
Here's the fields for the custom view that I use ...
and the "dual lists" flag is in the bottom right hand corner of the screen editor
I hope that helps
Thanks to both you and Ed for the Webinar (I've just added Europe to my regions on the back of it & subscribed to your channel Phil) and for posting the custom report fields - but I suspect I may be missing something.... is the only way to customise a report to overwrite an existing one? So if I overwrite 'Holdings' I actually lose that view... or is there a way to add a Brand new report with all the fields listed?
Thanks
Mick
Hi Mick,
Glad you enjoyed and Bon Chance with the European adventures and the thanks for subscribing.
Re: table views ... I believe I butchered an existing view that I didn't think I'd use!
Hope that helps
This webinar was one of your best. Well done to Phil.
Hi Guys, Super webinar, thanks for all your time and effort.
Phil, could you talk a bit more about portfolio construction. I'm interested in holding percentage. Is it basically 20 stocks @ 5.0% each? Do you never rebalance - you did imply that you tend to run your winners, which I believe is investment orthodoxy, but can lead to bed-time stress!
Also, given that your screen appeared to only pick 12 stocks from the pool of global companies, have you ever weakened the selection process and if you do, what tends to get some easement?
Cheers and thank you,
Jim
Hi Jim,
Thanks for your feedback.
If I had just one AJ Bell account I would be buying about thirty stocks. On purchase I'd aim to buy 1/30th of the portfolio value at the time of purchase per stock.
It's just I'm managing three portfolios and the results presented are the consolidated results. In those portfolios I've been aiming for 10 stocks per portfolio giving me a combined portfolio of 30 stocks.
Take a look at this article How many stocks should you own in your portfolio? written by Ed in 2014. It describes how returns become more predictable when more stocks are added.
(If it isn't already apparent I'm a bit of a fanboy of Ed's articles. My whole approach has been a synthesis of his articles, be that factor based investing, momentum principles, the use of PEGR, portfolio sizing, etc. All of these ideas have come from Ed's articles. It's all here for you too. This place is a fantastic resource but you need to put the work in and pull together something that makes sense for you)
I don't rebalance BUT I might take some profit off the table if there is some weakness but I still want to hold until price action breaks my stop loss. I'm sort of saying ... this is getting marginal now ... I'm half expecting the price to fade ... but I'll give it a chance to recover.
I never stress about running my winners ... looking at a sea of red after a market slide is much more challenging for me.
No I don't weaken my screen to find more ... my view is the market is telling me that there is pessimissim out there so keep your powder dry and be patient.
Best of luck
Thanks for your comprehensive reply Phil, I appreciate a lot of what you said was in the webinar (I picked up more on a second listing).
I'm a big fan of the PEG and didn't know about PEG R, so thanks for that. I used to hear Jim Slater speak once a year at his annual REFS conference and he was a very convincing speaker.
As a result of the presentation I'm buying coverage for Europe and Asia but have no appetite for the US at present for a variety of reasons!
Wow! What a performance. Congratulations! And thanks for sharing, Phil. That volatility since the bull-phase beginning of 2024 -- that massive drawdown -- you must have well-developed emotional control. I know I'd struggle with that. Do you have any tips along the lines of the psychological aspect of things you can share. That's one of my many weaknesses.
Thanks Bob,
regarding the psychology of the drawdown.
1) The money invested is a part of and not the whole of my retirement planning so whilst the drawdown is significant it's not the whole story. That's not to say that the losses, if crystallised, would not be painful and have consequences for me and my family.
2) My learning through my psychotherapy training is that often clients focus on the detail of 2025 stories and if the therapist is not concentrating they can get drawn into the weeds of the dynamic in 2025 whereas my model of therapy invites me to zoom out, rise up out of the weeds of 2025 to get a helicopter view of the events of 2025 set within the timeline of the client. Behaviour can then be contextualised in relation to one's history and past encounters. So when the market wobbles I pull out the 30 year chart for the s&p 500 and I contextualise this period of time in the frame of the larger picture. Apologies for the image (I'm on my phone at the moment) but below is the full history of the S&P 500.
If my holdings still retain the qualities I was seeking when I bought them I'll hold and it could be I have to wait awhile. That's why i think a new investor needs to understand that they will need to commit to having the funds invested for at least two years. I sat out for all of 2022 due a mixture of the a bearish year and a difficult year for our family. Only when things started to show signs of recovery in early '23 that I started to revaluate opportunities and my current holdings.
3) I will elaborate more on my selling approach in my YouTube channel but basically I'm trying (not always successfully) to take the subjectivity out of the selling by using rules that tell me when to sell. Maybe in a few years time with advances in technology this whole system I describe could be automated because if truth be told there are better things to be doing than looking at spreadsheets.
Best of luck
Hello Phil,
Have a look at compounder Goodwin, it won’t come up on your filter as they don’t have broker estimates.
Interesting it passes 17 of the 27 tests in my screen and the ones it fails are because it had no analyst coverage. How can a UK firm with a market cap of in excess of £1bn not have coverage from analysts?
Is that common?
Just built a version of my screen that removes all of the lower EPS requirements apart from the Earnings Surprise >= 0 and adds a rule where brokers == 0
Six UK companies including Goodwin (LON:GDWN).
Volvere (LON:VLE) also looks interesting.
Without the EPS estimates I have no sense of the change in the prevailing mood of analysts (which helps me assess entry and exit) and I don't get a PEG to help assess the value of the growth.
Net result I can't use this approach to invest in stocks without broker coverage.
Graham Neary was/is a holder of Volvere , I missed that opportunity.
I guess you have enough shares to select from your process that even if you missed the odd two, it wouldn’t matter.
No, it’s not common.
A thoroughly enjoyable interview and a testimony to process and method. It sounded very similar to the Zach ranks process in America. I'm a dividend investor so it wouldn't be my type of screen but th
ere are many roads to Jerusalem. I think it was a well thought out process and I found the screen algorithms around momentum really useful.
Ignore, found it.
Enjoyed that webinar very interesting. How does one get/overlay this Ichimoku cloud onto a chart?
Hi Mike,
I'm glad you enjoyed it. You can add an Ichimoku overlay to a chart under the Overlays tab on any chart.
I have a feeling Ed got the team to add Ichimoku to keep me sweet :-D
We always had Ichimoku - but I'm more a moving averages guy!
Maybe it was the PnF charts :-)
Maybe it was indeed Ichimoku!
Cheers Phil just need to get my head around it now LOL.
Phil, Many thanks for a very interesting and instructive Webinar. I have a question on your use of Ichimoku charts.
I am a novice in Technical Analysis, and although I had heard of Ichimoku, until your presentation I had never seen it being used. So I have today very quickly read a short book on it. From what I see, your chart has far fewer lines than the charts in the book I am reading (Easy Ichimokou: Easy Trading with Ichimoku Kinko Hjo).
Your Cloud seems to be Senkou Span A & Senkou Span B lines (or as ShareScope calls them, Advance Shift and Second Preceding Span lines). But you do not use Tenkan Sen, Kijun Sen or Chihou Span lines. Also, my book shows candlesticks, which you do not seem to be using. All this is good for me - much better to have something clear and simple. But is my understanding correct?
Hi qvg,
Good spot re; reduced detail of Ichimoku Clouds.
I do use the other lines however I took the decision not to show them in the limited time we had as the risk is it becomes overwhelming so i chose to just show the Kumo (cloud). I did this because the cloud and the prices relationship to it is a really quick way to assess if the stock is bullish. The lagging line (Chikou) is also useful when buying. See this comment below https://www.stockopedia.com/co...
I do prefer a candlstick chart over a lines graph but I don't use candlestick patterns.
I will do a brief video on Ichimoku as a support resource for my Quality Momentum Blueprint playlist when I'm ready to record the price action analysis video. I tend to use the other lines during the maintenance phase.
I hope that helps
Many thanks Phil
Amazing interview. Phil is such h a modest chap. It shows how the gifted amateur in almost any field can bring fresh disclosure uncluttered by accrued prior learning or prejudice. Congrats on allowing him full rein to speak and adding relevant questions. Your own creation in Stocko has inspired his creative interpretation.
I really enjoyed the Webinar and found it very interesting. I've subscribed to Phils YT channel.
A video explaining the Ichimoku Cloud interpretation would be very very useful. I cannot work out how to overlay an Index chart onto the stock chart. I'll have a google around over the weekend. For me, buying is the easy bit, its when to sell and move on is the hard bit.
you can add an index chart in the stockopedia charts. Just open a normal chart and in the ticker box add spx (and select in Indicies) and pick S&P500
thats great. thankyou so much.
Stocko has so much data and info that its sometimes hard to work out what you need. Its a great product.
Useful webinar and in tune with my focus on what the software tells me. I used to subscribe to the VectorVest software and had achieved similar returns but avoided large losses when a share did go south by my own personalised screen based around forward EPS and NPN. If these were rising steadily, were undervalued; had good relative safety and momentum then I was in. Most of the companies I never knew much about who they were. When VV pulled out of the UK it wasn't a good day. I joined Stockopedia and have caught some good returns; M P Evans (LON:MPE) MPE being one of them. My problem is my refined, personalised parameters bring up very few shares; 3 at the moment whereas I could see more and bigger cap shares with the VV search. Looking at Phil's shares, his searches bring up very few UK listed shares, which is where I invest, just like my search. Not wanting to get in to US or Euro shares does limit me but it is enough to deal with the vagaries of one country and time zones and imminent crashes. Over the years (30) AstraZeneca (LON:AZN) has been >10 bagger(starting out as Zeneca) and Ashtead (LON:AHT) starting out at 44p one hell of a bagger :-). Being wary of an imminent crash, I have done a Buffet and am predominantly in cash; missing the recent gains ( when I buy they go down: when I sell they go up). If it does happen then I will be well positioned to go in again, so here's hoping sorry. I held gold from the turn of the century and through G Clown's sell off. I was told I was daft then but heyho; look at it now. My problem now is timescale; I would not have the time on my side to ride out another crash so I will see what the New Year brings before making my next move. Overall these webinars add to my knowledge and how to use the full extent of the data. My problem is too lazy to want to look too deep :-)
I wrote this post Change your style or broaden your perspectives? back in Jan 2014. I received all of the concerns back then ... fx fees, broker fees, withholding tax, etc.
G. Clown
I thought it was a very insightful and instructive webinar and I look forward to re-watching the recording.
Really informative and useful webinar thanks to Phil and Ed for putting it together, learnt a lot.
One thing I've never fully understood if anyone from Stocko or anyone who understands can explain it.. The eps graph...
Is the important part the right side? If it's been going down, jagged etc on the left but for example the last couple of months it has risen is that the important factor? Or is the entire period shown just as important?
Apologies for sounding like an amateur here but I've looked on the learning section and there doesn't seem to be any guide as to what we are looking at with the chart. Is there a guide or even better a short video explainer?
Thanks!
Here's the chart for Friedrich Vorwerk Se (ETR:VH2). As you move across the graph from left to right the data becomes more important. The last entry is the latest estimate and if it's above the previous one the analysts are more bullish about the stock but it gives me even more confidence if there has been a constant upslope as the company is clearly surprising the anlyst and they are having to revise their estiamtes upwards.
If I see that the last entry is below the previous I won't buy and if I'm holding I will tighten my notional stop and watch it more closely until the price action takes me out or I find another factor that will contribute to my exit, e.g. quality rank < 80
Thanks Phil that really clears it up.
Thanks again for the Webinar.
I get the line for 2025 but what about the paler blue line. Why wouldn't that start where the 2025 figures left off?
Beacuse the estimates for the profits in 2026 are independent of the estimates for the profitability of 2025. Perahps a new technology is coming online in 2026 and the analysts believe the business model of this company will be shredded.
Start on the far left, the date is April '24, the analysts provide estimates for '25 (FY1) & '26 (FY2) of 1.17 & 1.458. They are plotted on the graph as two data point, dark blue for FY1 and light blue or FY2
In may '24 the consensus estimates are collected again and they haven't changed. Another data point is plotted.
This is repeated every month forming the chart that you see.
At some point FY1 completes and FY1 becomes '26 and FY2 becomes '27
Lightbulb moment. Thanks for the clear explanation.
it looks like most of the outperformance was 2013-2018 and the last 18 months. so did he have 5 years of treading water?
I would say that that late 2018 to Spring 2020 & all of 2022 was challenging but no strategy works perfectly all of the time.
In the period 2018 & 2019 lots of well informed people were warning of market crashes (sound familiar?) and as a result I attempted to short the DAX and the FTSE neither of which was profitable. I wont ever do that again.
2022 was a terrible year for investments take a look at the S&P 500 or the StockRank strategy during that period. It was also a very challenging time for my family. I only really got my boots back on in the Autumn when the S&P 500 started to show signs of recovery not that I think I woud have started buying again until the S&P 500 showed signs of recovery.
Best of luck
I enjoyed the webinar last night and have a couple of questions for Phil.
Do you time your entries with technical analysis in any way, or just buy purely on the fundamentals (and the few simple TA rules in your screen)? For instance, would you ever think “thats very extended short term, I’ll wait a bit”?
Secondly, when the market is trending down (and you hold off from selling), would you still be buying any new positions? Or do you wait for a new bull leg?
thanks!
Hi Matt,
I'm pleased you enjoyed the webinar and thanks for your questions.
In the webinar last you saw me :
1) screen for candidates
2) analyse some elements of the stock report for each candidate
If a stock passes both of those tests I then look at their Ichimoku chart (i'll be covering this in a future YT video in ther series).
So with the chart for Amphenol (NYQ:APH) as the price is above both red Tenkan Sen (Fast Average) & dark grey Kijun Sen (Medium Average), both of those averages are above the cloud, the cloud is bullish and the light grey lagging line (Chikou) is not colliding with the price action which tells me the stock is trending.
Whereas with Nissei ASB Machine Co (TYO:6284) the current price is stuck in the cloud, the future cloud (to the right) is unclear, is it bullish or bearish? The fast average is above the cloud but the medium average is stuck in the cloud too. Finally the lagging grey line is tangled up with/below the historical price action. If the price rises over the next few weeks then the averages will move above the cloud, the cloud will turn bullish and the lagging line will be in clear territory.
Fundamentally I want stocks that are trending as I want to compound my investment and not have my cash in stocks that are consolidating.
I hope that helps
Hi Matt,
Just reread your question again and realised I haven't answered all of your q's.
It is tricky if a stock has got extended high above the cloud and it is a challenge to buy then because all things being equal my final stop loss will be below the cloud. Quite a long way away. However quite often when a price spkies on earnings releases this is what happens and I believe Ed's research suggests that you get post earnings drift (a positive effect) and so generally I will buy in those circumstances. See The Setup – three simple rules that captured the 36% drift in H1 2025 for more details.
I don't tend to buy on the way down I'm waiting for the index to demonstrate a good recovery (hopefully dragging my holdings with it). I have over the last few days been wondering if I could use the VIX (Volatility Index) as a way to buy good candidates when it spikes (if I have any cash available) but I haven't really investigated this in any depth.
I hope that helps
For example, here's a chart of Celestica (TSE:CLS) with the volatility index at the bottom. I've added some horizontal lines to the VIX chart and I'm wondering if a spike in the VIX exceeding the green line (value 26.7) would represent a good time to buy in the future.
It certainly would have generated three or four reasonable buys in the past
Thank you very much for your detailed answers.
I invest in quite a similar way to you. Things have evolved over the years, including some wrong turns (usually trying to be too clever), but I also use screens and ranks to do all of my stock selection now with some TA sprinkled on top. I used to do more analysis and found the ranks and screens did a better job in less time.
I tend to use moving averages and a weekly MACD for sell signals, along with a drop in stock ranks. I actually have little problem in knowing when to sell, its timing buys I find tricky. I like to try and get pullbacks or breakouts but I have a feeling I'd probably be better buying (almost) whenever. still a work in progress.
I have never really paid attention to brokers forecasts so that was very interesting. You have also inspired me to possibly look outside the UK market. And you have also made me think about being more diligent in avoiding things stuck in bases, and being more strict on things actually being in an uptrend.
My CAGR is 14.9% since 2012, and like you have found the last few years to have some tougher patches.
Keep up the good work, I have subscribed to your Youtube channel and I look forward to seeing some videos.
Would you be willing to share what your sell rules are please ? Are they "hard and fast / set in stone" or do they take into account market conditions ?
Thankyou in advance
Hi LovelyLovelyGorgeous,
I'm not sure if that request is directed at MattH or me but I am getting there in terms of producing the YouTube content and I promise a video or two will be dedicated to the selling process and future videos where I go live will include my review of my stocks to demonstrate how I think about each position and how I decided whether to hold or sell.
I'm currently putting the finishing touches to a Google Spreadsheet that will help you to understand how my maintenance and selling decision making process works.
It involves exporting a CSV from Stockopedia, importing it to Google Drive and the importing into my Spreadsheet template.
If noone else finds it useful it will certainly help me as historically I've been manually cutting and pasting data.
I appreciate the patience
Cheers
Phil
Thanks Phil, it was directed at Matt. I really appreciate all the content you have produced recently on YT. I'm looking forward to your sale process. Thankyou
Hi there,
My sell rules are as follows. Firstly, is the whole market tanking? If so, do nothing. Secondly, is the share trending. Is the weekly MACD positive and the five week moving average above the 10 week? As long as it is trending, I'll leave it alone. Thirdly, if the share has stopped trending has the momentum rank stayed above 80 and if so is the stock rank above 75? If not, I sell.
I have a flow chat which I follow to keep me honest with these rules. Now nothing in the stock market is perfect so occasionally these rules may take you out early or keep you in too long. Like Phil though, I like to have quite a defined system that takes out a lot of the ambiguity.
Some of these rules have evolved over the years. Especially the rule about what to do if the whole market is tanking. In the past I haven't had that and have found that I have sold out just at the wrong time before a rebound. Particularly because it seems that in this modern age falls and rebounds can happen quite quickly.
I love those rules MattH, it seems we are cut from the same cloth.,
I have been listening to The Authorised History of GCHQ and they were reflecting on the type of candidates that they recruited for tasks like cryptoanalysis and they described seeking individuals with "Machine Oriented Thinking". What in essence they were describing was an individual who could think like a computer programmer way before they were invented!
I think that 's what we are both doing ... defining a set of rules we (try) to follow and that could be automated if the systems were in place.
Oh! Also Ed I was reflecting on your question as to why I waited so long to sell some Celestica ... If I recall it just kept appearing on my screen. Rather than selling I really wanted to buy more but I just couldn't have so much riding on one stock. I think that is what kept me fully invested for so long.
I also hold Celestica (NYQ:CLS) , though unfortunately not for as long as you. I top sliced my holding recently in order to buy a bicycle, but it is still one of my largest holdings. I note that you tend to hold on to your shares during general market downturns, but I am pretty sure that the AI bubble will collapse at some stage and I think that that will not be a time to continue to hold my half-dozen or so AI-related shares.
Thanks Ed! I'm very grateful for the positive comments I received across social media. If you have questions then please ask and I'll try my best to answer them.
If you're interested I'll be going into further detail about my approach please check out my YouTube playlist The Quality Momentum Blueprint on my channel Grow Your Dough.
At present I've added there videos:
1) Overview of the playlist contents
2) A refresher for those who are new to factor investing
3) The rationale for the approach and a dive into my Stockopedia screen
I'll be adding to this playlist to show you:
4) How I vet the screen candidates by checking their StockReports
5) What I look for in the price action for each candidate
6) How I maintain my portfolio and the data required to do that
7) Why, When & How I sell
Allied to this I hope to build a public facing portfolio so that I can build a transparent record of my process and all being well I'll provide video updates of my buy and sell decisions.
Please be patient with me, it takes hours to film and edit each video.
Please, please, please remember this is NOT a tipping service.I might even delay videos to reduce the risk of this. My goal of sharing is to show you my process and my psychology.
Also I genuinely know very little about each stock I hold over and above the Stockopedia description so please don't be offended if you ask me some detailed question about company and I shrug and say "I don't know". My strategic naivety allows me to distance myself from opinion, comments from the CEO, etc. The data (the combination of the price action, profit warnings, EPS estimates, Stockopedia metrics, etc.) will inform my decision to continue holding or sell.
Best of Luck
Phil
Hi Phil,
Fantastic interview and thanks for sharing your approach in such detail. I remember you from the very early days of Stockopedia and I always consider you a kindered spirit with your data driven philosophy.
I did submit a question which was maybe partly covered, but I would be grateful if you could expand. How do you maintain mental discipline in tough markets and when your approach doesn't seem to be working? While your overall performance is amazing, most of your gains seem to come in 2 spurts:
1. The period from inception to around 2018
2. Since about 2024.
There is a period inbetween of around 6 years, where it is essentially moving sideways. That is a long time to wait for your porfolio value to break into a new high. My returns have followed a similar pattern although at somewhat lower level, I guess mainly because I have a hard time mentally with tough markets and I keep doubting my approach. I have often been sitting on way too much cash and I also moved into other assets, including bonds, which have been a drag on performance.
Anyway, I'm interested in understanding more about your state of mind during these slower epochs and how you stay disciplined.
Cheers!
Hi MB,
Thank you for your kind words and whilst I'm not a dedicated follower of the boards I've always valued your posts and your approach too.
I explained in a reply above about the 2018/19 period, me being a little inexperienced and still giving too much emphasis to external voices fortelling of stock market crashes took the decision to short the DAX & the FTSE at various points. Not good.
Also not doing this full time and having an amazing whirlwind of a daughter means you don't always get the time or the opportuninty to focus or sit back and take a helicopter view of things.
If I'm invested and stock market crashes I:
1) revsit my data to make sure the metrics I track for each stock are still valid
2) pull up a chart of the S&P 500 over 30 years
3) close my laptop and do things I enjoy
Life and the markets was tough in 2022 for me and my family and I sat and waited from Dec '21 until Jan '23 before I sold or bought again.
When a client comes to see me in psychotherapy after a disaster in their personal life, sometimes the urge from people around them is to "do something" but often in my experience it's best to sit with the pain, let the dust settle and clarity will emerge.
The problem with investing is ... do you need access to your funds right now? Or can you wait two years if the markets go south?
Best of luck MB
Blow out update from CLS today Phil, well done!
It's the gift that keeps on giving. It's a 27 bagger for me now.