What is the CAPE for the FTSE 100 ?

As part of my investment process[1] each month I review the FTSE 100 using CAPE (Cyclically Adjusted PE) in order to project a ‘best guess’ of future returns for the UK market over the next few years.
I focus on the FTSE 100 because that’s where I do most of my investing. If you invest primarily in another index then of course you should probably be looking at CAPE for that index.
So where is the FTSE 100 today in terms of its CAPE[2] valuation, and what does that suggest about the future?
FTSE 100 CAPE slightly cheap
As I write the FTSE 100 is sitting just below its all-time high at 6,761. According to my figures that gives it a CAPE ratio of 13.3.
That’s slightly below the figure I use for CAPE’s long-term average, which is 16, and so with a CAPE value slightly below average it’s reasonable to describe the FTSE 100 as slightly cheap today.
That’s all very well and good, but so what? Cheap and expensive are woolly and subjective terms so I prefer to focus on what it could mean for future returns; and what it means for future returns is that they should be better than normal.
FTSE 100 annual return projection of 9% over the next decade
The UK stock market has returned around 5% after inflation over more than a century, so a reasonable baseline for future returns is 7% in nominal terms, assuming the Bank of England keeps inflation at 2%.
However, because of the slightly low valuation, a simple projection over the next 10 years suggests that a best guess for returns over that period would be closer to 9% a year.
Here’s a quick re-cap of where stock market returns come from:
- Dividends – with a lower than normal valuation, yields are higher than they otherwise would be and so returns from dividends are also higher. The FTSE 100 dividend yield today is about 3.5%.
- Dividend and earnings growth – CAPE has little or no impact on how quickly companies can growth their dividends and earnings. My assumption is that these grow at the historically average rate of 4% a year (i.e. 2% after inflation).
- Changes to valuations – With a lower starting valuation the change is likely to be positive rather than negative, adding to returns rather than subtracting from them. To return to a CAPE multiple of 16 the FTSE 100 needs to go up by an additional 20% or so.
Put those together and you get a nominal rate of return of just over 9%, with the FTSE 100 standing at a smidgen over 12,000 in 2024.
The chart below shows the FTSE 100 over the past 25 years. Each coloured band relates to the index’s projected 10 year returns from that level:
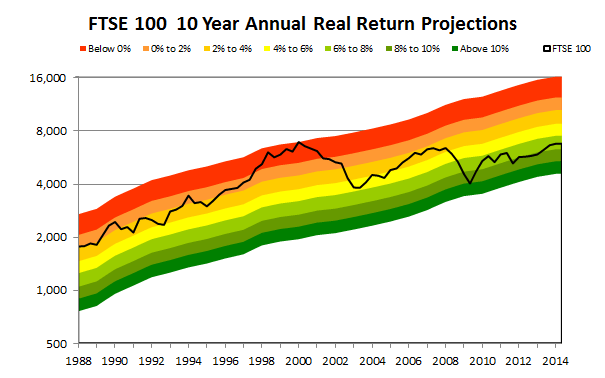
So, for example, in the late 1990’s the FTSE 100 was well into the top red band where projected real real returns were negative for the next decade (which for most of that decade they were). On the other hand in 2009 the index just touched the bottom green band, where future returns were projected to be in double figures, even after inflation (and again they have been so far).
The table below shows how those future return projections relate to various CAPE valuation levels, as well as my interpretation of a contrarian asset allocation strategy that Ben Graham occasionally mentioned:
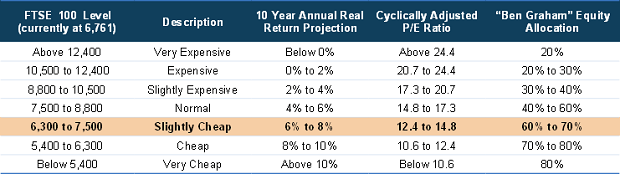
Today the FTSE 100 is in much more ambiguous territory than it was in either 1999 or 2009; it’s not especially expensive or cheap. Overall though I think the odds are likely that we’ll see better than average returns over the next decade.
Blog Updates
1 email per week. No spam. Get the latest blog posts and other information from around the web to help you become a better investor.
References
- ^investment process (www.ukvalueinvestor.com)
- ^CAPE (www.multpl.com)
Disclaimer
This is not financial advice. Our content is intended to be used and must be used for information and education purposes only. Please read our disclaimer and terms and conditions to understand our obligations.
1 comment
Sensible but dull. For long term investors only.