What this year's Super Stocks (& Sucker Stocks) performance means for investors

With a quarter of the year gone, it feels like a lot has happened in the world, with far-reaching consequences for equity markets. I thought it would be interesting to see how the StockRanks have faired during this time.
Long-term performance
We know that the long-term performance of the StockRanks, rebalanced quarterly, is very good in the UK:
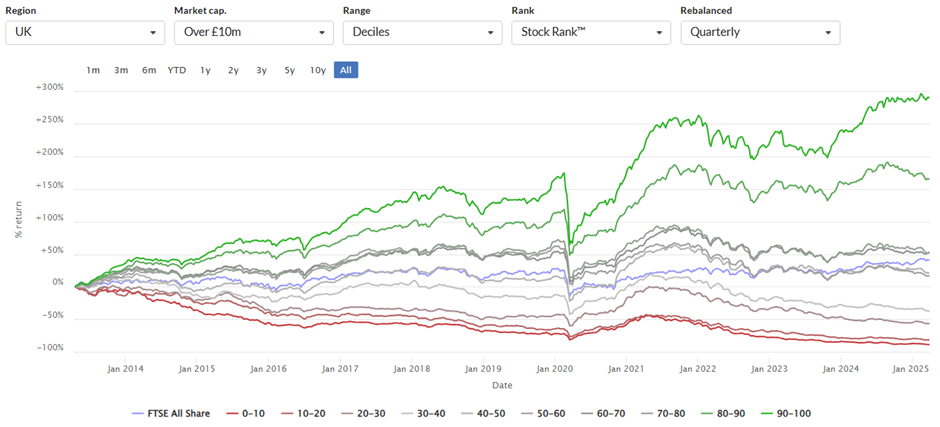
However, something strange has happened in the US. The same long-term outperformance of Super Stocks over Sucker Stocks exists over there. However, even the Super Stocks have been beaten over the last decade by the most popular passive index, the S&P500:
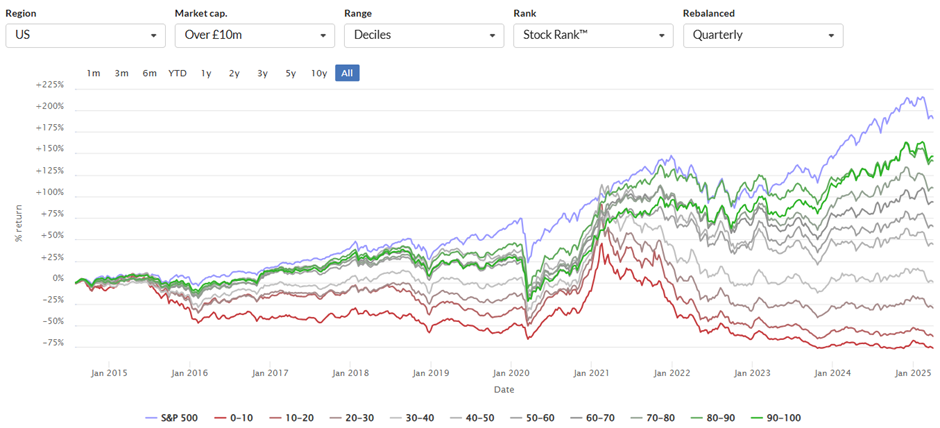
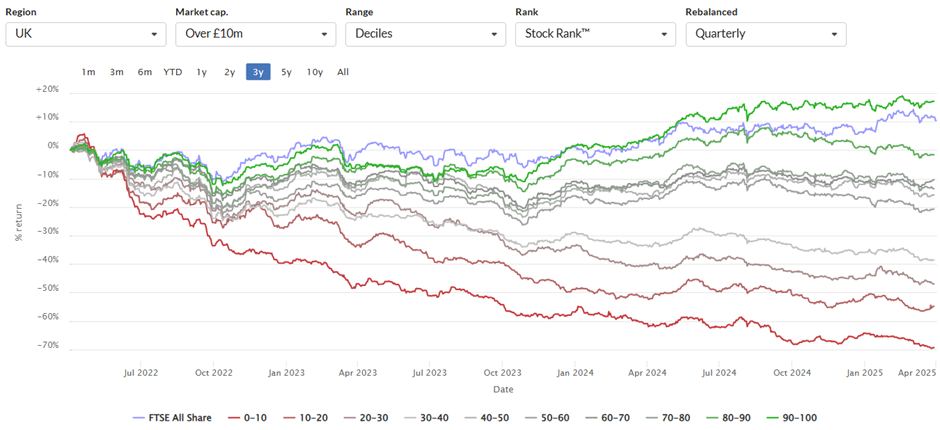
So what is going on? We have seen a similar effect in the UK over the last few years. Even the Super Stocks have only just beaten the rather tepid returns of the FTSE100 (on a price return basis). The median StockRank decile has massively underperformed:
Large vs Small
In both cases, this is because the largest stocks have significantly outperformed the smallest. What we are seeing is the difference between an equal-weight Stock Rank portfolio, which calculates the average return of the stocks in a particular decile, and the market-cap weighted index, which invests in proportion to the size of the constituent companies.
For many years, smaller companies outperformed larger ones. The reason is simple: smaller companies have much more scope for growth, which is also typically reflected in higher multiples. However, over the last few years, that orthodoxy has been turned on its head, with the largest companies significantly outperforming and being given a premium rating. There are strong arguments on both sides as to whether this is a rational adjustment to a tech-driven world or an irrational bubble caused by trend-seeking passive flows. Whether this change makes logical sense or not, one of the outcomes is that market-cap-weighted portfolios have outperformed equal-weighted ones with the same portfolio constituents.
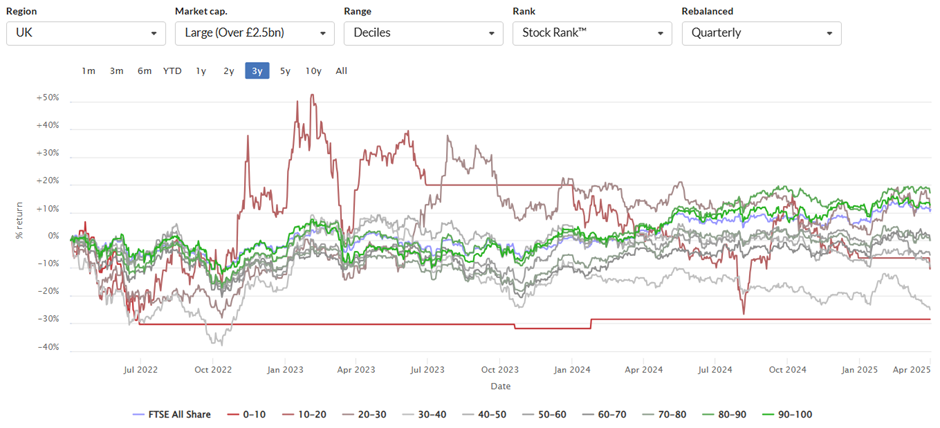
The data is noisy due to the lack of stocks in each bucket, but when I concentrate on the largest stocks only in the UK, both the 80-90 and 90-100 deciles outperformed over the same 3-year period:
However, in the US, this same effect doesn't happen:
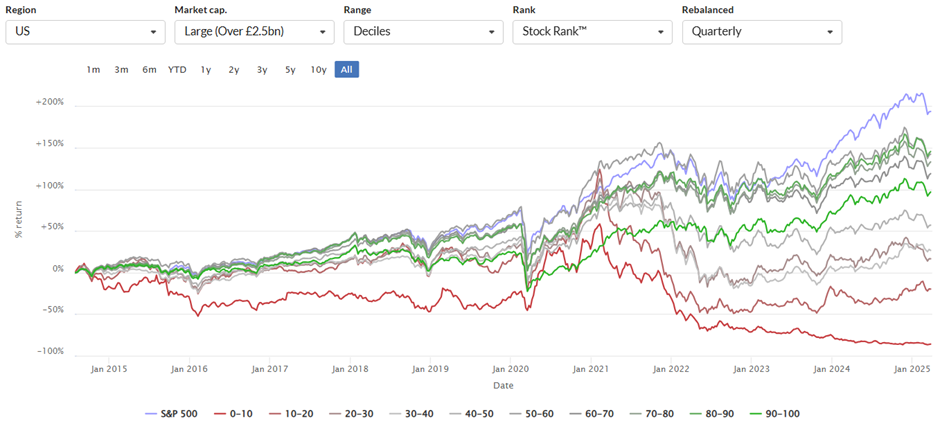
The issue here is that the £2.5b cut-off isn't high enough to capture the large cap effect in the US, which is concentrated in the S&P500 and even in the largest few stocks. History tells us that such concentration is unlikely to last, but maybe this time is different.
2025 Performance
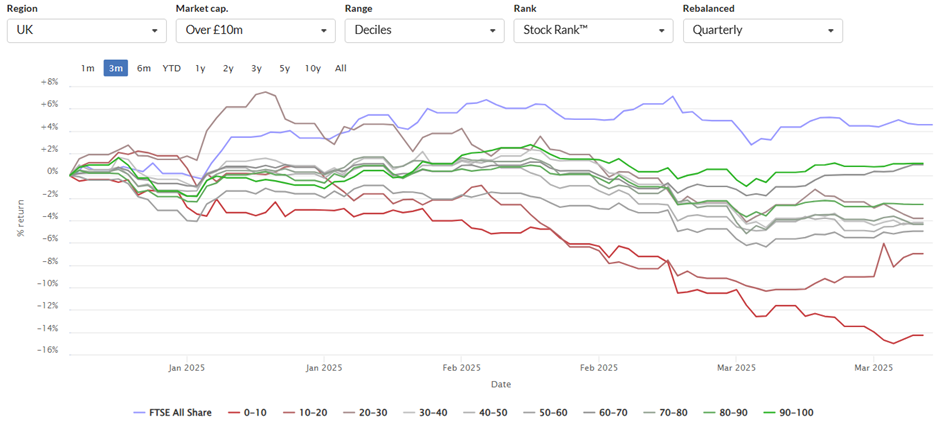
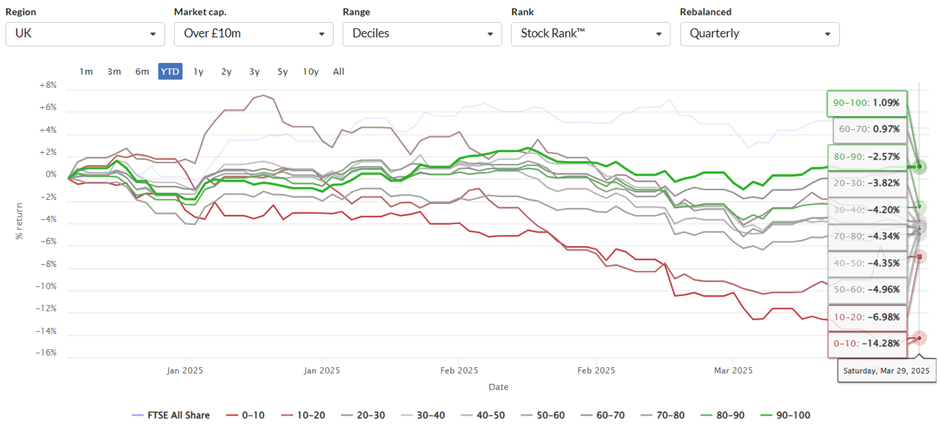
The "larger is better" effect shows no sign of abating in the UK, with the FTSE 100 having beaten even the Super Stocks so far this year:
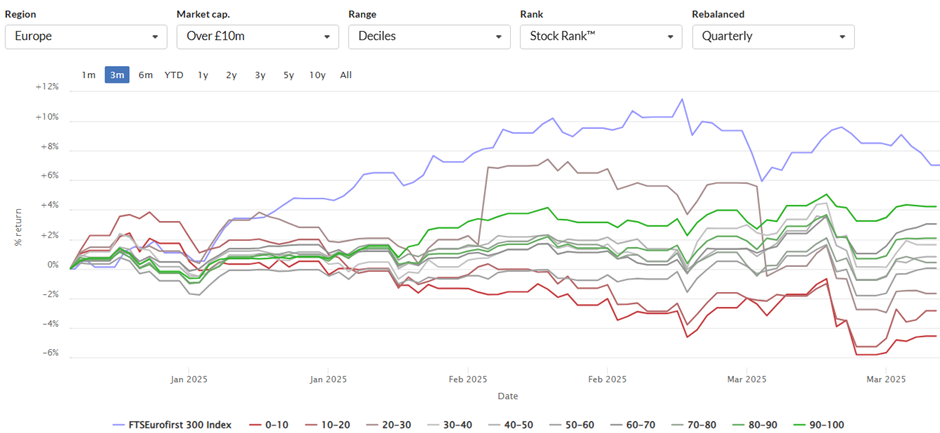
The same has happened this year in Europe:
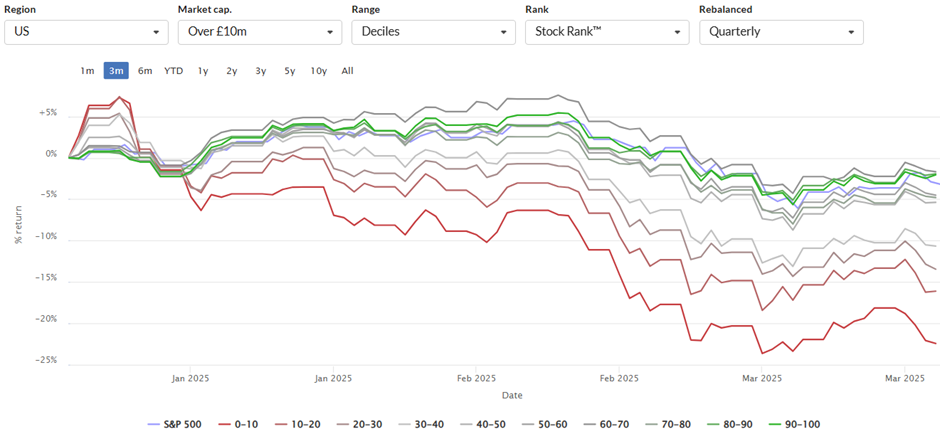
Things look a bit better in the US, with the Super Stocks having the upper hand. However, it is worth noting that all the returns YTD here are negative:
Value comeback?
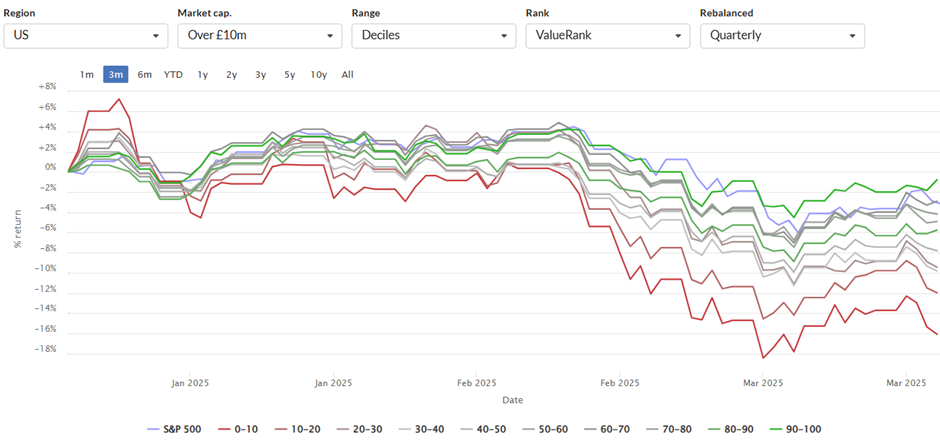
Looking at the individual Ranks, the Quality and Momentum Ranks show the same picture. However, the 90+ Value Rank stocks are starting to outperform this year in the US:
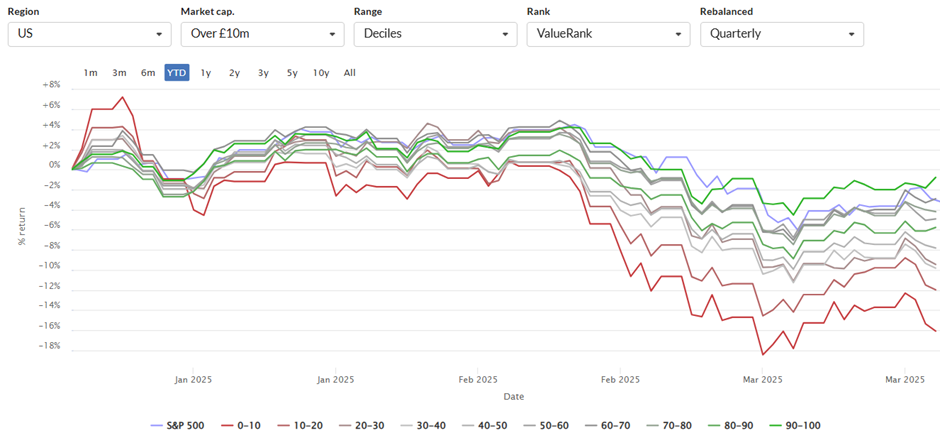
Could this be the start of the (very) long-awaited return to small cap value and away from large cap growth?
In the UK, the Value Rank is doing well only among the largest of companies:
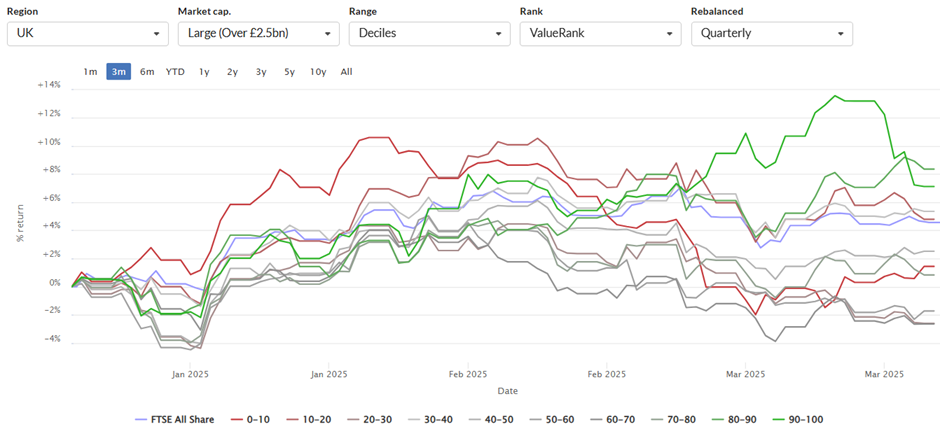
It seems the torrid time that UK small cap markets are experiencing due to outflows is dwarfing any other effects in this space.
Don't be the sucker
One thing that stands out is how badly the lowest-ranked stocks perform. The long-term US StockRank performance chart shows a one-year period post-COVID where the lowest-ranked stocks went on a tear:
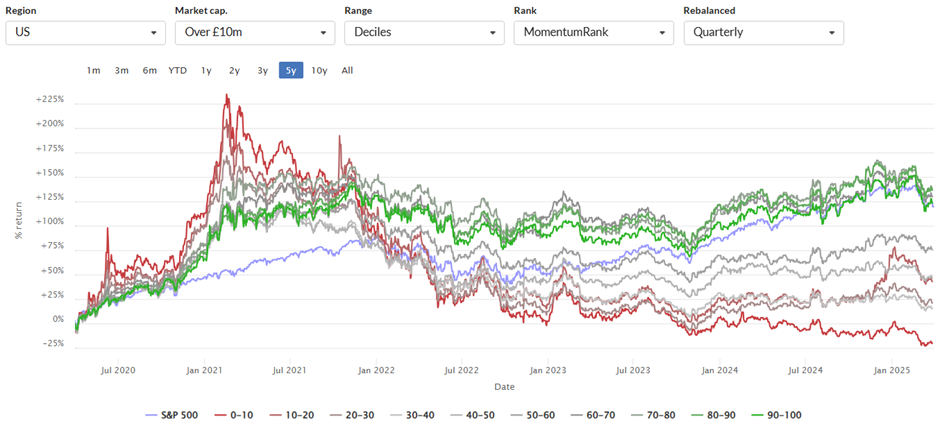
The end of 2020 was a truly bonkers time when traders who posted stock memes managed to engineer short squeezes that saw huge returns in stocks that were effectively bankrupt. However, a year later, they had given back the gains, and the high stock rank portfolio was back in the lead. While not quite as extreme, we saw an almost identical pattern in the UK:
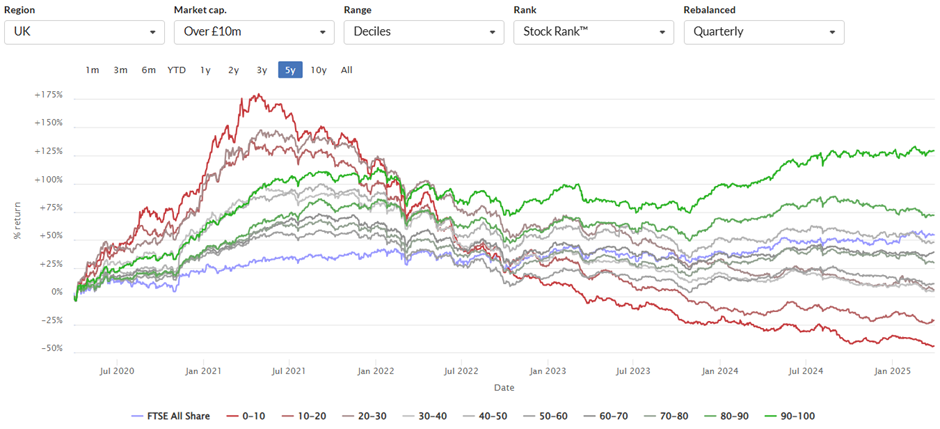
Barring these crazy times, the spread between the returns of the highest-ranked stocks and the lowest-ranked almost monotonically increases. In the UK, year-to-date alone, the spread is a whopping 15%:
Q, V, & M Component Ranks
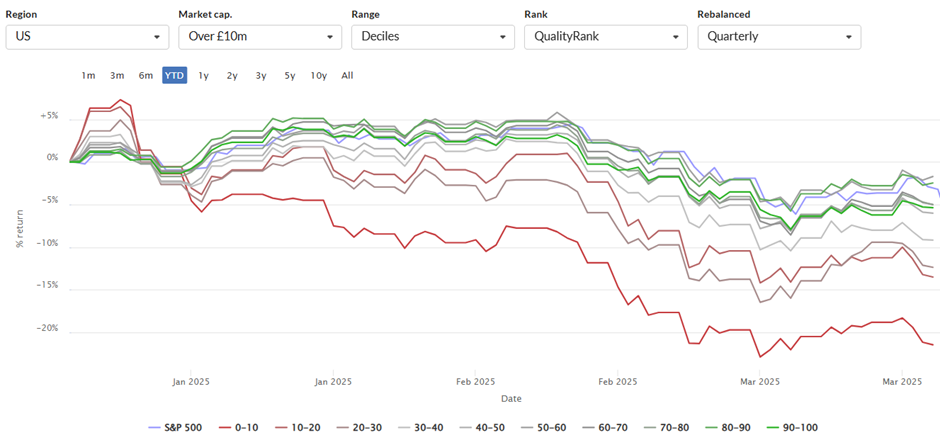
Most interestingly, this effect holds for the individual ranks. In almost all regions, over almost all timescales, the set of lowest-ranked stocks on each of the Q, V, or M ranks performs poorly. Here are the graphs for the US year-to-date as an example:
Quality
Value
Momentum
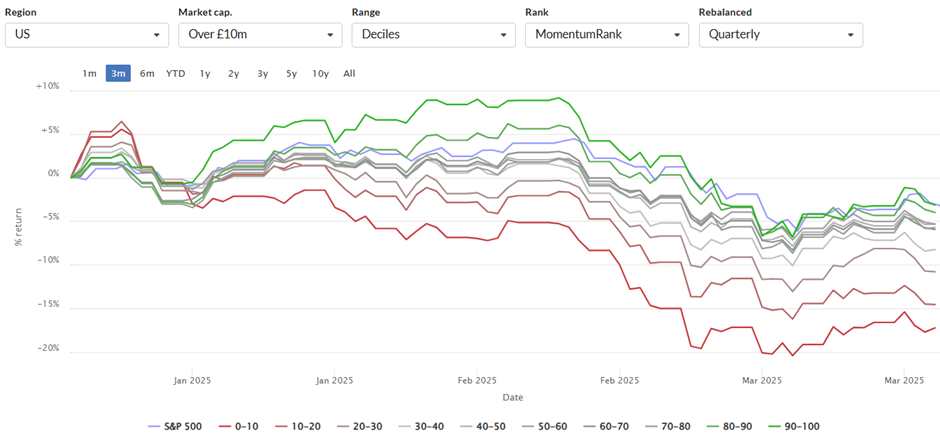
Stockopedia subscribers are well aware of the warnings about Sucker Stocks. Those who risk their capital in such stocks are certainly swimming against the flow. They may well be strong enough swimmers (analysts) to overcome this, but often higher returns are generated by swimming with the flow and investing in relatively highly-ranked stocks. However, the graphs above raise an uncomfortable possibility. They suggest that investors may be better off avoiding stocks that score less than 10 (or even 20) on any of the Q, V or M ranks.
As a value investor who tends to ignore momentum when I find a bargain, this is a sobering thought. It may also give investors who have High Flyers in their portfolio, but where price momentum has bid the shares up so high that the Value Rank is now tiny, a fright.
The nature of the market is that many Sucker Stocks tend to be minuscule, not least because they have likely already lost investors a lot of their money! At Stockopedia, we tend to ignore stocks with a market cap below £10m. The cut-off is arbitrary, and this doesn't mean that there aren't gems below this, but lower than this, we quickly get into the realms of uninvestable liquidity, and we have to pick a limit somewhere. Doing a quick screen for stocks with a market cap above £10m and a Stock Rank less than 10, currently yields 46 results. However, if I run the same screen for individual ranks, I get 77 low Value-ranked, 43 low Quality-ranked, and 48 low Momentum-ranked stocks. Combining the lists gives 102 individual stocks with at least one of the Q, V, or M ranks less than 10. Of these, 89 do not have a QVM rank below 10. Here's the list of those:
Ticker |
Name |
Mkt Cap £m |
ADT1 |
Adriatic Metals |
754 |
AGL |
Angle |
34 |
AGY |
Allergy Therapeutics |
309 |
ALFA |
Alfa Financial Software Holdings |
656 |
ALK |
Alkemy Capital Investments |
12 |
AMIF |
Amicorp FS (UK) |
148 |
AQX |
Aquis Exchange |
195 |
ARS |
Asiamet Resources |
28 |
ATC |
All Things Considered |
18 |
BANK |
Fiinu |
18 |
BCG |
Baltic Classifieds |
1506 |
BKS |
Beeks Financial Cloud |
155 |
BOR |
Borders and Southern Petroleum |
45 |
CER |
Cerillion |
454 |
CHAR |
Chariot |
21 |
CIC |
Conygar Investment Co |
19 |
CNS |
Corero Network Security |
87 |
CTL |
Cleantech Lithium |
10 |
CUSH |
MiLOC |
30 |
CYAN |
Cyanconnode Holdings |
46 |
EDX |
Tecc Capital |
40 |
EEE |
Empire Metals |
74 |
EPP |
Energypathways |
13 |
EUA |
Eurasia Mining |
134 |
EXPN |
Experian |
33268 |
FAR |
Ferro-Alloy Resources |
36 |
FARN |
Faron Pharmaceuticals Oy |
230 |
GGP |
Greatland Gold |
1726 |
GMET |
Guardian Metal Resources |
59 |
GSCU |
Great Southern Copper |
25 |
GST |
GSTechnologies |
35 |
HEX |
Helix Exploration |
21 |
HLMA |
Halma |
9951 |
ICFG |
ICFG |
79 |
IES |
Invinity Energy Systems |
36 |
IKA |
Ilika |
62 |
INAC |
InvestAcc |
79 |
INC |
Incanthera |
13 |
INSG |
Insig Ai |
25 |
ITX |
Itaconix |
15 |
JDG |
Judges Scientific |
541 |
KEFI |
KEFI Gold and Copper |
42 |
KMK |
Kromek |
35 |
KZG |
Kazera Global |
14 |
LINV |
Lendinvest |
39 |
LND |
Landore Resources |
10 |
MATD |
Petro Matad |
27 |
MOS |
Mobile Streams |
58 |
OBI |
Ondine Biomedical |
45 |
ONDO |
Ondo InsurTech |
39 |
OPTI |
OptiBiotix Health |
16 |
OXB |
Oxford BioMedica |
329 |
PAT |
Panthera Resources |
28 |
PBEE |
Pensionbee |
359 |
PBX |
Probiotix Health |
11 |
PHE |
Powerhouse Energy |
21 |
PINE |
Pinewood Technologies |
337 |
POLX |
Polarean Imaging |
14 |
PRE |
Pensana |
67 |
PREM |
Premier African Minerals |
16 |
PRTC |
Puretech Health |
352 |
PXS |
Provexis |
11 |
QBT |
Quantum Blockchain Technologies |
11 |
QED |
Quadrise |
80 |
REL |
Relx |
71940 |
RENX |
Renalytix |
30 |
RGG |
Rentguarantor Holdings |
30 |
RMV |
Rightmove |
5374 |
RTW |
RTW Biotech Opportunities |
313 |
SALT |
MicroSalt |
32 |
SAR |
Sareum Holdings |
17 |
SBTX |
Skinbiotherapeutics |
56 |
SCLP |
Scancell Holdings |
82 |
SEA |
Seascape Energy Asia |
19 |
SFT |
Software Circle |
121 |
SKL |
Skillcast |
33 |
SNOX |
Sulnox |
121 |
SOLG |
SolGold |
207 |
SOU |
Sound Energy |
16 |
SRT |
SRT Marine Systems |
152 |
STX |
Shield Therapeutics |
31 |
TAND |
Tan Delta Systems |
15 |
TAP |
Quetzal Capital |
11 |
TRD |
Triad |
56 |
TRST |
Trustpilot |
958 |
VLRM |
Valereum |
24 |
WPHO |
Windar Photonics |
40 |
ZEG |
Zegona Communications |
5201 |
ZEN |
Zenith Energy |
19 |
These include some of my holdings, such as CT Automotive (LON:CTA) or Capital (LON:CAPD) , which look cheap but have poor momentum. There are also some very popular stocks amongst individual investors, such as Beeks Financial Cloud (LON:BKS), SRT Marine Systems (LON:SRT) or Judges Scientific (LON:JDG) on the list. There are even a few very well-regarded large and mid-caps, such as Experian (LON:EXPN) , Halma (LON:HLMA) or Rightmove (LON:RMV) . The long-term StockRank performance of similarly ranked stocks suggests that investors should be very wary of investing in these, regardless of other positive qualities they may possess or the strength of their other ranks.
Conclusions
Small Cap Value on the comeback?
The US markets lead the world. They say, "When Wall Street sneezes, the rest of the world catches a cold". While biggest-is-best seems to be the case in the UK so far in 2025, in the US, small cap value has outperformed. This may be a sign that the pendulum will swing back in favour of smaller and cheaply-rated stocks.
StockRank investors need to have a balanced portfolio
Investors who rely primarily on a company's Stock Rank to guide them need to make sure their portfolio is sufficiently balanced. I've written in the past about how such investors likely need to hold many stocks to avoid painful periods of underperformance. It seems that investors would also be better off holding both higher-ranked smaller and larger companies to avoid the long periods where one or the other outperforms. It may even be worth considering SuperStocks from other regions in order to protect against the times when Super Stocks lag in a particular country.
Avoid lowly-ranked stocks
The case for simply avoiding Sucker Stocks, no matter how compelling the story, is a good one. Like the occasional Super Stock that takes a bath, investors may be able to think of the occasional Sucker Stock multi-bagger. However, one of the main reasons that Ed came up with the StockRanks is because he was a sucker for the stories, yet these types of stocks were consistent losers for him. The reality is that in most market conditions, the lowest-ranked decile of stocks on any of the Quality, Value or Momentum Ranks perform poorly. Even if investors use the Stock Ranks for nothing else, their performance may be enhanced by not just avoiding the Sucker Stocks but also the lowest-ranked stocks on any of the individual ranks.
[Disclosure: Mark owns shares in Capital (LON:CAPD) CT Automotive (LON:CTA) ]
Disclaimer
This is not financial advice. Our content is intended to be used and must be used for information and education purposes only. Please read our disclaimer and terms and conditions to understand our obligations.
7 comments
Very useful. The interesting point is that a low score on any of the ranks is bad news. So you need to drill down from the total QVM score.
This implies that a stock with a balance of qualities performs best. For example one with an 80+ on all three measures, if it exists. This may explain why there is little difference in performance between those with a total score of 99 and those with a total score of 91.
A useful follow up article would be to look at those with a balanced scorecard.
Mark,
Do you think that these cumulative return charts are the best way to understand whether factor investing is working? I have taken a different approach. Using my own data I have looked at the effectiveness of various factors over a 6 week period and compared the total return of the top 250 (sorted by factor) compared to the average. I have stockrank data back to 2021 but Mkt Cap data only back to 2023. The chart below shows the underperformance of small companies over the past two years, but the trend is positive so small cap investors have some cause for cautious optimism.
Hi DWit99,
I don't think they are perfect. Multiple regressions are probably better, so if you are doing that, then kudos. I would need a lot more data/time to do that sort of analysis.
Good news on the small cap comeback, though. It is about time!
Mark
Great article thanks Mark. We all feel a little better about our underperformance this year now!!
Super helpful article Mark - particularly at the moment when I'm struggling to make sense of some of the performance in my portfolio.
I'm wondering if the relative success of larger caps in the UK reflects the fact they are generally better equipped to deal with a macro environment with inflation, higher employer costs, high interest rates as they tend to have more pricing power, better debt terms, and more negotiating power with their suppliers?
Superb article, thank you Mark, and all the boffins who crunch the data behind the scenes.
Brilliant Mark, as a sucker I found this educational, as in the truth hurts. Well done Ed for coming up with the stock ranks -- I'll use them whenever my finger's hovering on the buy button.