When should I rebalance a portfolio of SuperStocks

Last year, I looked at when to sell QM stocks: high-quality winners. I thought it would be interesting to expand the study to look at when to rebalance a portfolio of SuperStocks, the highest-ranked stocks on a combination of Quality, Value and Momentum.
The conclusion I came to for QM investors was that they could generate continued outperformance by holding a portfolio of QM stocks for up to four years:
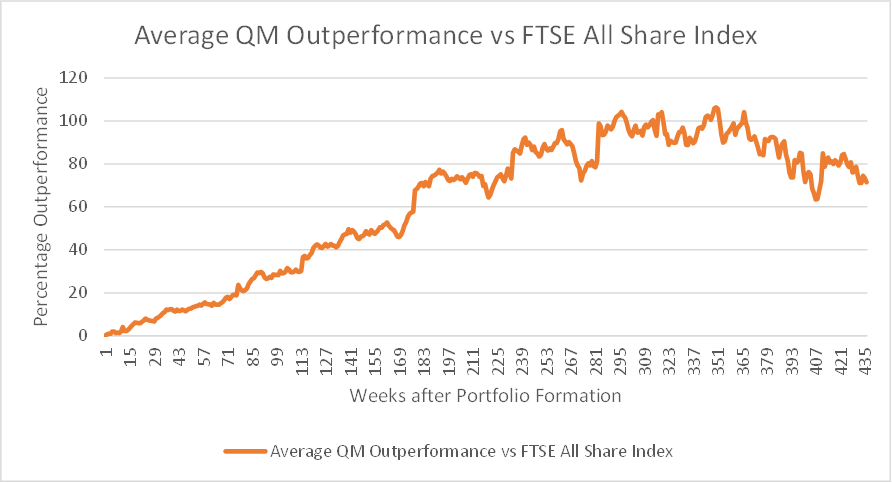
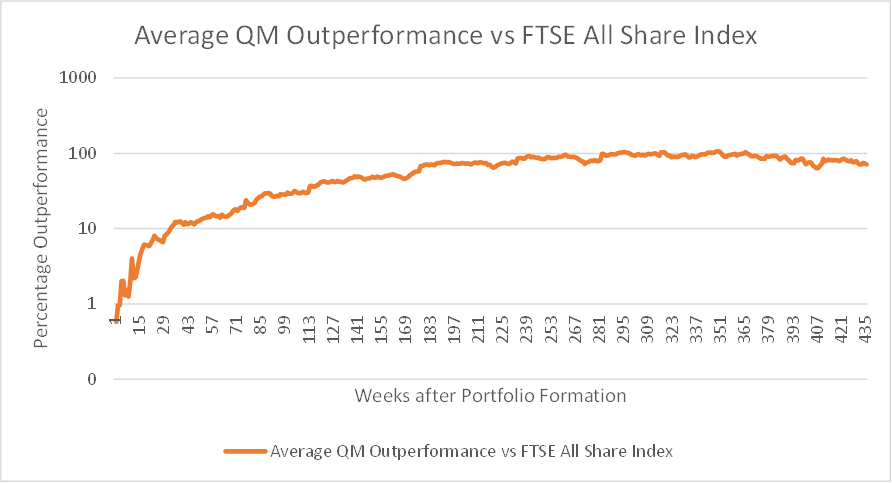
It seems the quality factor continues to drive outperformance even after the initial momentum may have faded. After this period, holding further is likely to lead to underperformance. However, if an investor is interested in maximising compound returns, they should probably sell after a year, as the same graph on a log scale shows more clearly:
This is due to Momentum being a relatively short-lived phenomenon in terms of EPS outperformance, as the following graph from the Factors From Scratch study shows:
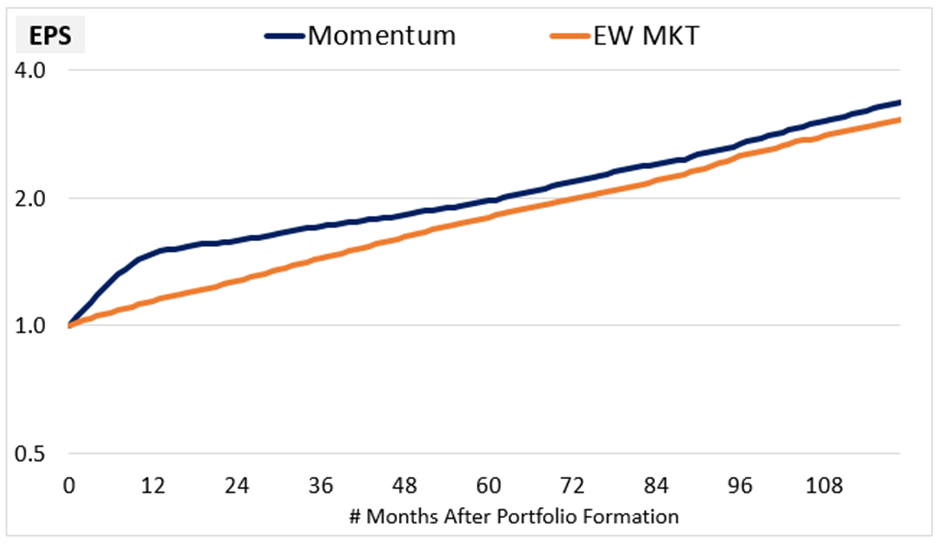
Complicating matters is the challenge that Momentum is one of the best factors to trade in theory and one of the worst in practice. Many quant momentum funds have not lived up to the hype. The reason is likely the high costs of regular rebalancing. So, in this respect, investors may be better off holding for longer periods.
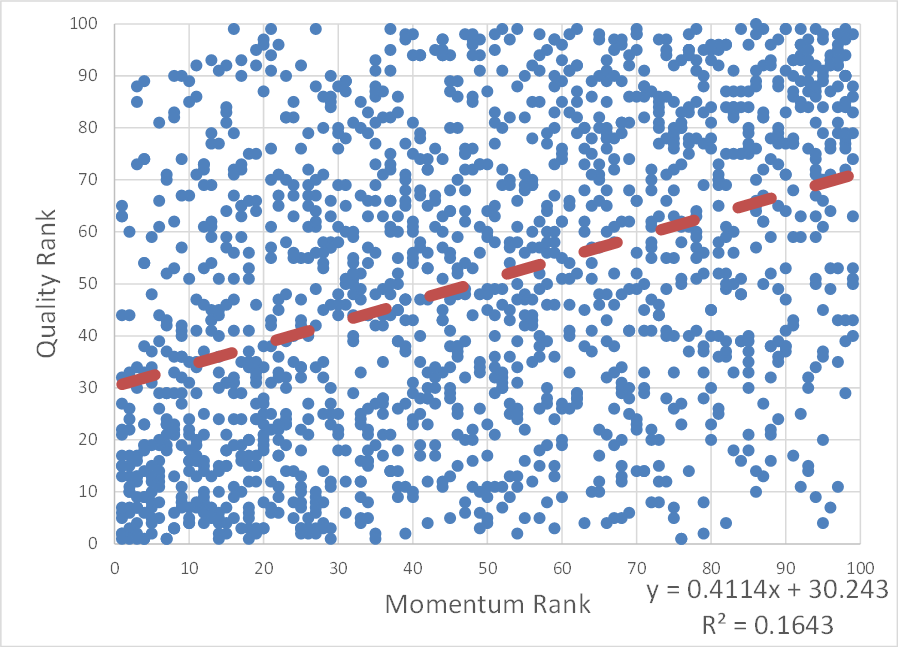
Another factor that may be impacting is that the Quality Rank is heavily weighted to the Piotroski F-Score, which contains earnings Momentum measurements. This makes the Quality and Momentum Ranks positively correlated:
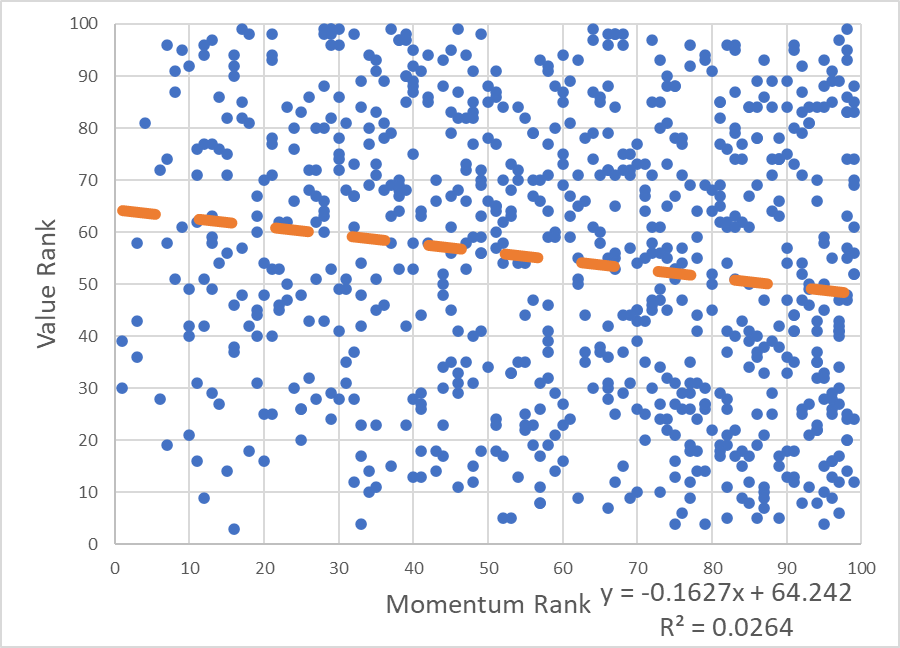
In contrast, Value and Momentum are largely independent and even negatively correlated when only looking at stocks that are forecast to be profitable, as the following plot shows:
Methodology
This time, I started with the data I used to study whether investors should ignore low-margin SuperStocks (Spoiler: they should not). This means I have a list of all of the UK SuperStocks at the end of March for each year, 2014-2023. I then looked at how these stocks performed over subsequent periods. Since the Stockopedia data began in 2014, I couldn’t go any further back, but it means we have one 10-year period, two 9-year periods, …., and ten 1-year periods of performance to study. I then looked at the average cumulative outperformance of these sets of SuperStocks based on prices from Google Finance.
One complication is that, as I go back in time, a greater proportion of stocks have been delisted or faced other corporate action, meaning price data is no longer available. However, with the whole set of SuperStocks available in my study, there is still enough data to draw some interesting conclusions. Compared to my study of QM stocks, these results are more robust since I started with a set of around 150 SuperStocks for each year. While some pruning was required for delistings or stocks that barely traded, this meant that far more stocks were included in each portfolio here compared to the QM study.
Results
Here is the average performance over all formation periods:
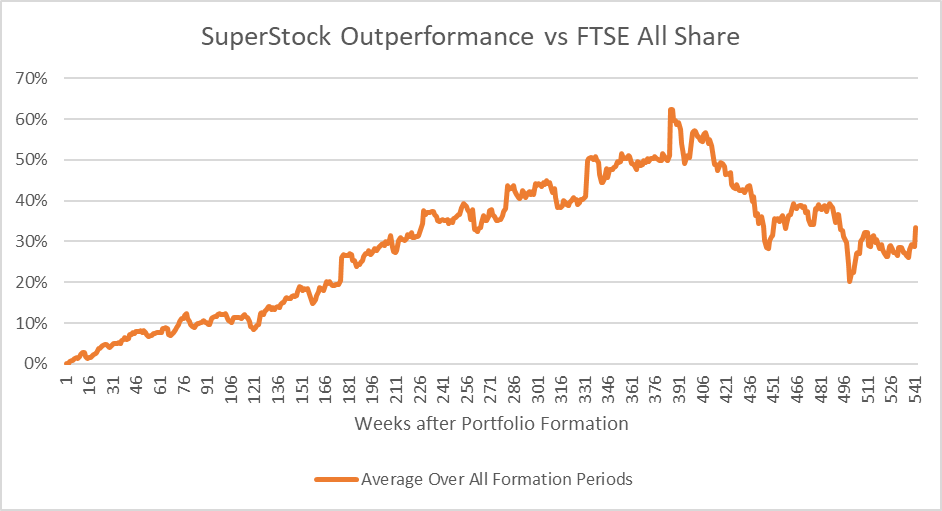
Interestingly, compared to my study of QM stocks, the absolute performance is not as strong. We can’t conclude that it is better to be a QM investor since I had only the top 25 QM Ranked stocks for this study. However, it may be that QM investors should focus on the highest-ranked stocks. However, the outperformance continues for much longer, meaning that investors could be as slovenly as they like and hold a portfolio of SuperStocks for five years or more and still expect to outperform the market. It is possible that adding the Value Rank adds to the longevity of outperformance but not the absolute returns.
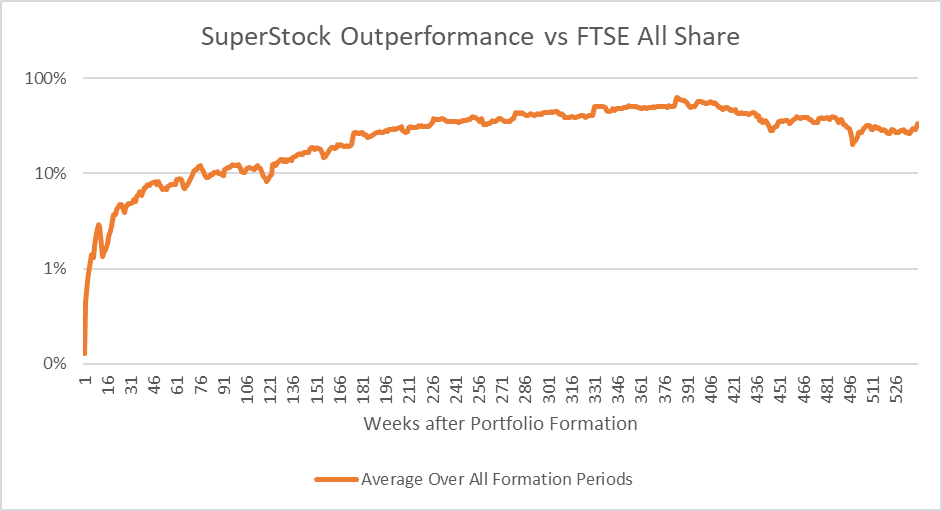
Looking at the log-scale graph, the highest compound outperformance still occurs in the first year:
As in the QM study, and despite using a different formation date and many more stocks, the performance trajectory varies significantly by formation year:
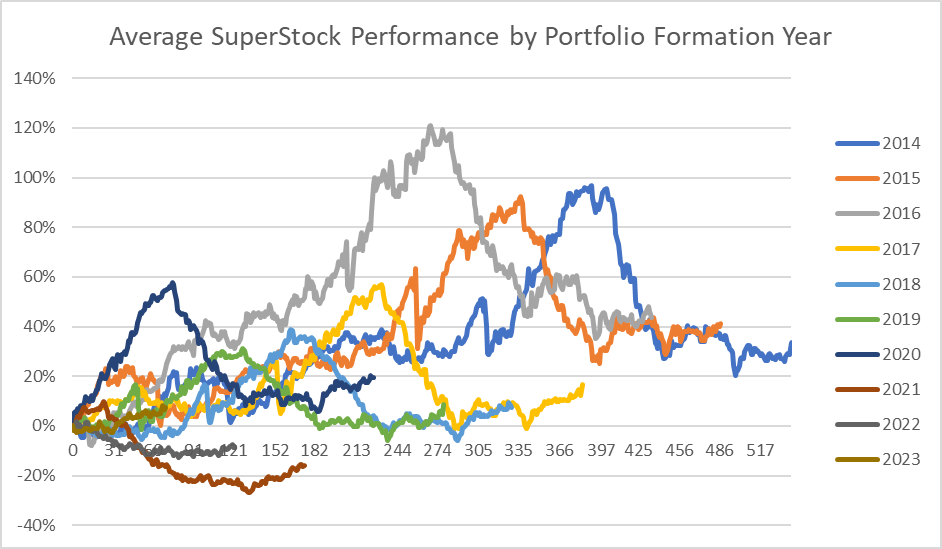
Starting in mid-2021, all portfolios of SuperStocks started to underperform. I had hoped that including the Value Rank would mitigate this effect. However, this doesn’t appear to have been the case. The reason is that this effect is unlikely to be something specific to the StockRank methodology, given that it affects portfolios of a large number of stocks formed over many years. Instead, the most likely explanation is that these are all equal-weight portfolios, and they have underperformed market cap indices because small caps have underperformed large caps during this period.
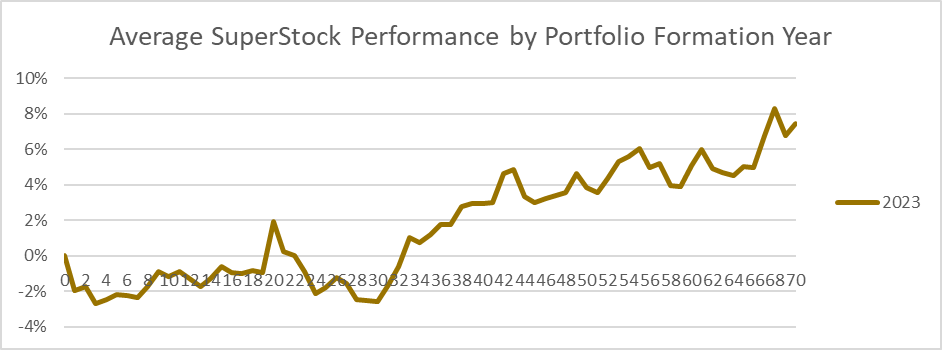
On this front, there is some good news. After a slightly shaky start, the portfolio of SuperStocks formed in March 2023 has started to outperform. It seems the recent challenges of large companies outperforming small ones may finally be coming to an end:
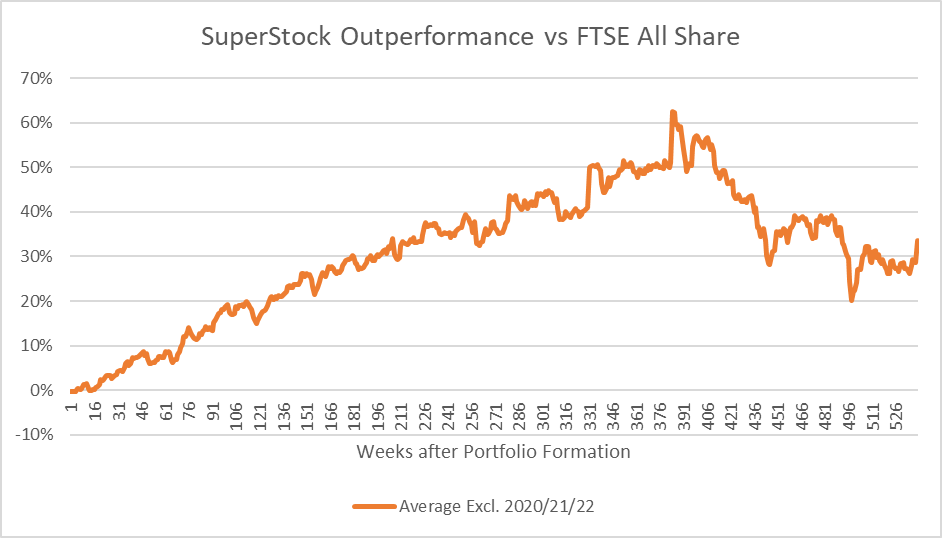
Excluding these “difficult years”, then the SuperStock outperformance is remarkably steady and continues for at least five years:
Conclusion
This large study of SuperStocks confirms that their outperformance isn’t just limited to rebalancing after one year. Investors can choose the rebalancing period that has the best personal trade-off between return and costs. Given the history of momentum funds failing to replicate the academic findings, this may be better off being much slower than one year. A hybrid strategy may even be best. For example, liquid SuperStocks are rebalanced yearly, but less liquid ones are sold after a longer period.
Like all equal-weight strategies, investing in a portfolio SuperStocks will underperform the indices during periods where large caps beat small caps. Sadly, this is unavoidable as these periods tend to be unpredictable. Thankfully, while painful, these periods have historically been shorter than the times when small caps have been in the ascendency. There are signs that 2024 may see the return to more normal times.
Addendum
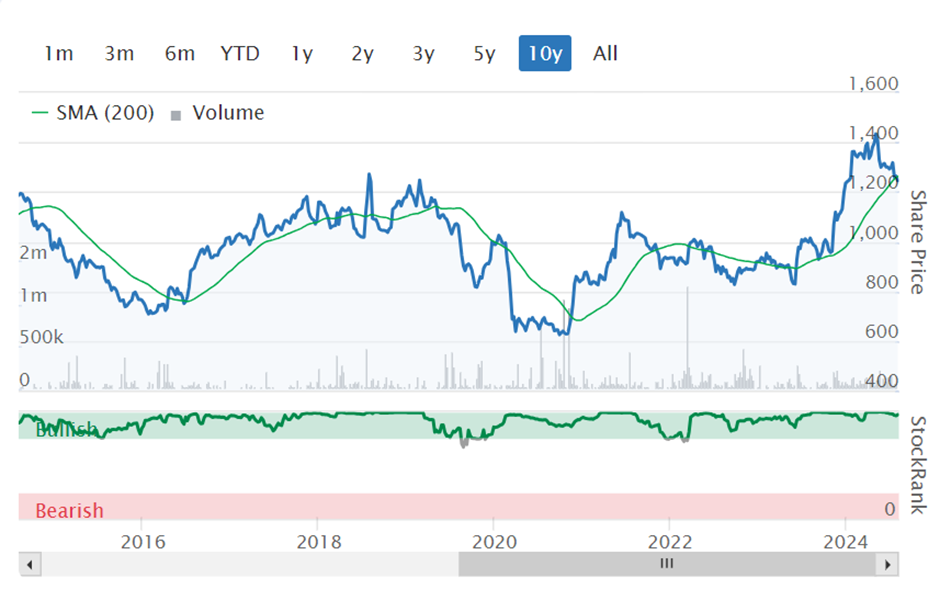
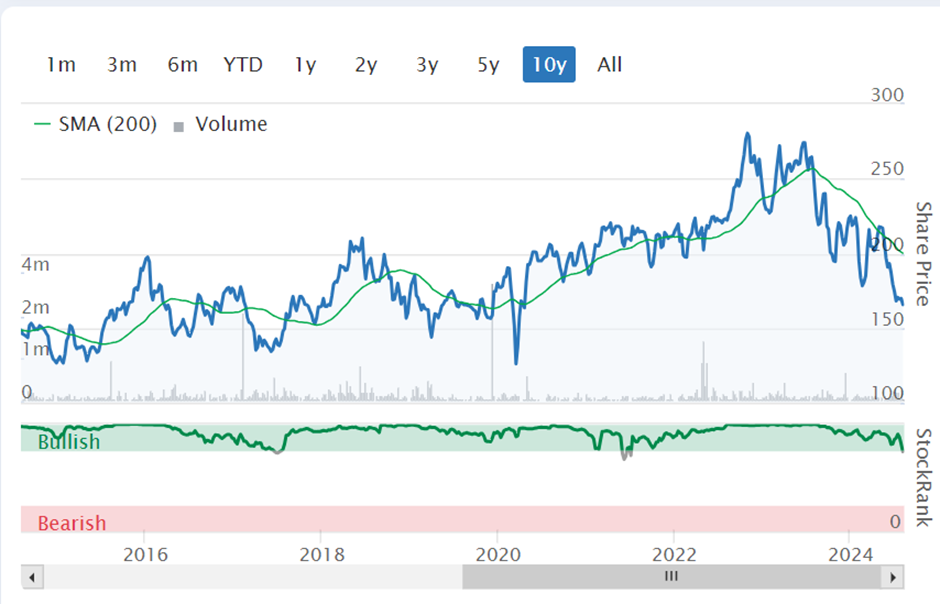
It may be tempting to think that the way to outperform would be to rebalance out of stocks that are no longer SuperStocks and keep those that are SuperStocks in the portfolio. However, a look at the stocks that have featured as SuperStocks for many of these periods suggests this may not be optimal. Here are a few examples of the companies that were SuperStocks for nine out of the ten yearly portfolios:
Ocean Wilsons Holdings (LON:OCN)
NWF (LON:NWF)
Barratt Developments (LON:BDEV)
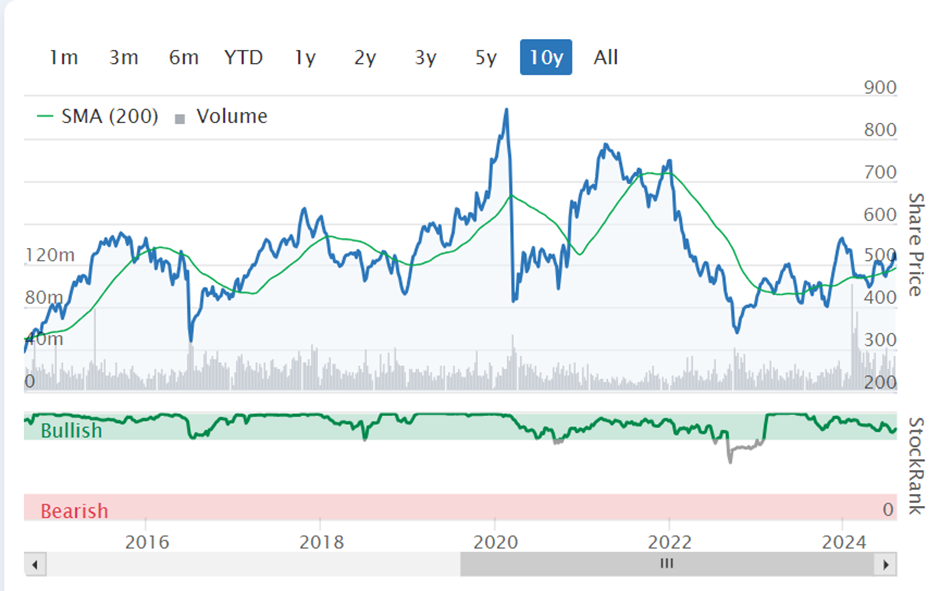
None of these have been stellar performers, and their share prices have been largely range-bound. These may be the type of SuperStocks to avoid rather than hold forever.
Disclaimer
This is not financial advice. Our content is intended to be used and must be used for information and education purposes only. Please read our disclaimer and terms and conditions to understand our obligations.
10 comments
An excellent article Mark. Thanks.
The drag from costs are often mentioned in such articles. However, for money held outside an ISA or SIPP, there is the additional drag of CGT, currently at around 20% but expected to double in the next budget. I calculate that with a typical growth rate of 9%pa (inflation plus real return), if re-balanced yearly, a 20% CGT rate deducts 2.3% off the gain and a 40% CGT rate deducts 4.6%.
My conclusion from the above is that I only use a re-balancing portfolio for money held inside a SIPP or ISA. For money held outside a tax wrapper, I aim to hold the assets forever, which forces me to hold worldwide ETFs and Investment Trusts.
Yes, taxes are definitely a frictional cost, which means it's worth continuing to hold for longer. As the article shows, holding for very long periods is unlikely to be a great strategy for individual stocks, which will begin to underperform over time, on average. However, for funds where the "churn" is internal, holding forever can make a lot of sense.
Very useful. Personally I have held Oceans Wilson about 4 times in the last 10 years because of its high stock rank, and then been disappointed. It seems some stocks are just not liked by the market, rather than being temporarily mispriced.
A small request, can Mark do a dynamic analysis. Stocks that moved up in rank for example from the 80-90 bin to the 90-95 bin or 95-100 bin and then track performance over the next 6, 9,12, 15 months. I suspect returns are a lot better than those who are in the 95-100 bin.
Ocean Wilsons Holdings (LON:OCN)
Strangely I was looking at Ocean W yesterday ahead of the interim accounts of Wilson Sons tonight after close in Brazil. I've held off and on for several years - currently in, based on the perennial discount to NAV (currently estimate at 45%) but perhaps more importantly the current growth being shown by its subsidiary Wilson Sons.
https://api.mziq.com/mzfileman...
Q1 profits were up 29% mainly due to the volume at the container ports being up by 24% - according to the data this has continued to improve. We'll see tomorrow.
I guess my point is, even with a perennial superstock, there are times when they look better value and times they don't. I don't believe in coffee can stocks.
Yes, only about 1 in 1,000 stocks are 10 / 15 year coffee can stocks. If you can find these then your IQ is likely higher than Einstein. Personally i can't.
It is an interesting theory. Sadly, it is not a small request! The data I have is "point in time". I will ask the data heads if they are able to generate the data that would enable this analysis and see what they say. It might have to be a bit more simple than that and separate SuperStocks into those whose StockRank is higher than a few months ago, those that are the same and those that are lower and see which set performs best. It is a nice idea for a further study, though, thanks.
I have done a lot of financial research, i have a Phd in behavioural investing. It can be done in excel. Need stock rank at annual intervals, for those in the 80-90 bin. Calculate difference in stock rank and capture those with an increase of more than 10. Capture share price change over the next yearly interval. Clean up and get averages.
Sorry, I didn't mean the analysis wasn't possible. Just not possible with the data set I currently have been given.
i just love that trend line in the quality/momentum graph statistics at its finest
Again a fabulous article Mark, thanks so much. One of the things that is noticeable about Superstocks is how rarely they crater. If the flat performance of the final three stocks mentioned is the an example of bad performance, I'm happy with that! There will be a couple of Renold (LON:RNO) in a basket too, which will make up for the flat ones. It should be a good year overall for the Superstock small caps. DD