When to sell? A guide to using the StockRanks as buy and sell thresholds

"I understand that I should buy quality, value, momentum shares and the StockRanks are a good guide to this... but I've still got a major problem when should I sell?"
It's a very good question. It's all very well thinking "90+ StockRank shares tend to beat the market" and buying 90+ ranked shares accordingly - but managing a portfolio of shares on this basis poses real questions. The rank for a high ranked share will tend to fall over time, so it's highly likely it will cross below the 90 level within any reasonable investment timeframe - often within weeks or months. When is the right time to sell?
I'll cover two approaches to answering this question using the StockRanks in fully invested portfolios - periodic and threshold rebalancing. I'll introduce some key rules of thumb from a fascinating recent research paper that anyone can apply. What I won't cover is sell rules used by more active strategies - such as stop losses, timing indicators or other fundamental sell signals.
Periodic Rebalancing
One solution I've long promoted is to use periodic rebalancing which ducks the question of when to sell by waiting till a point in time. The slow moving "NAPS" investment process buys a portfolio of high ranked shares and rebalances them annually, ignoring any ranking movements in the interim. What tends to happen is that the ranks of the holdings drift downwards as the year progresses. Even at the half year mark you see a significant fall in the average ranking. This year's portfolio has already about 20% of the portfolio below a 55 ranking. But if you are rebalancing annually, you just ignore all this and wait.
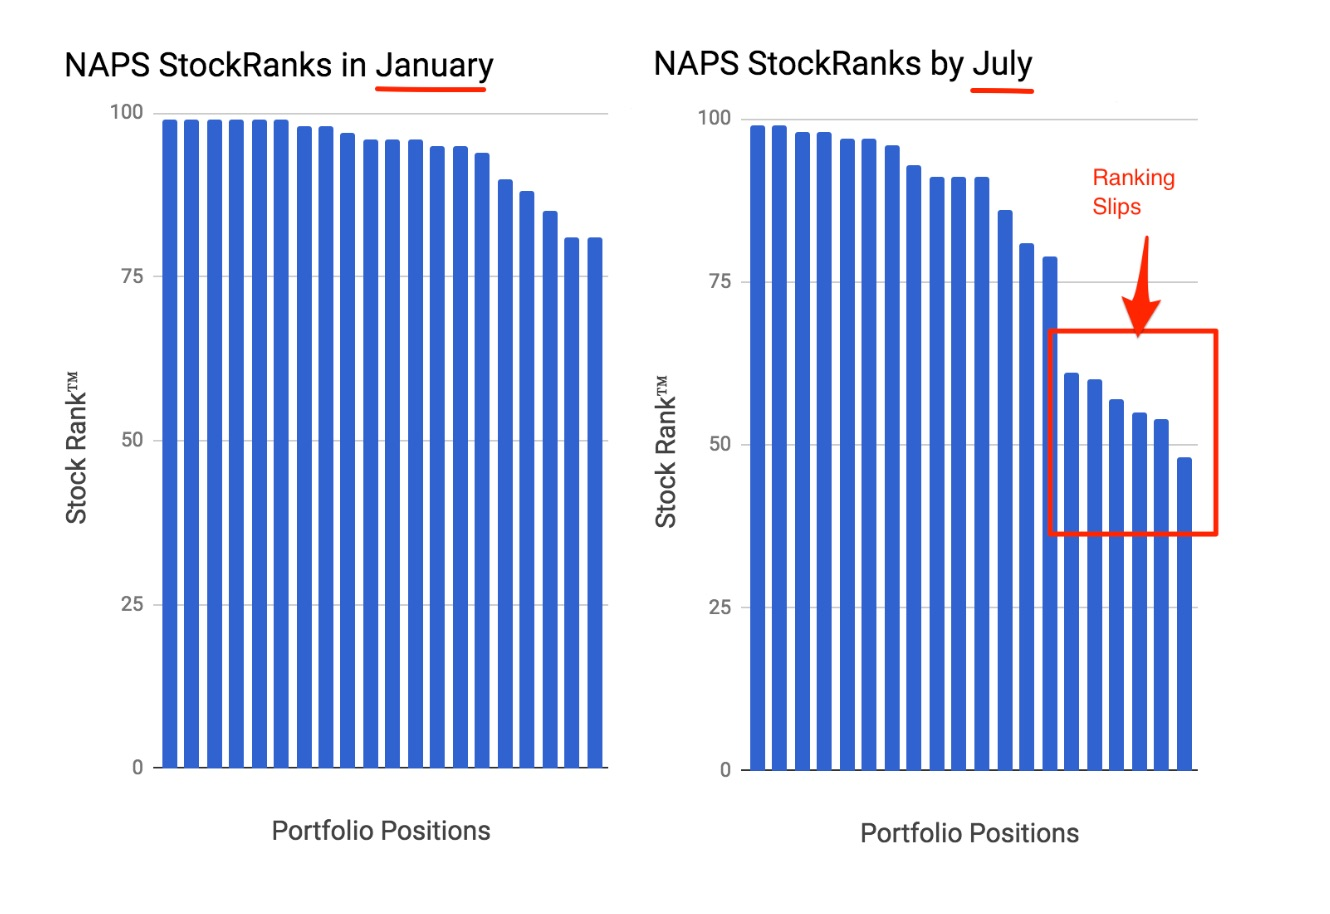
I'm working on some research to investigate the optimal rate of rebalancing vs transaction costs which I'll share in future, but in essence annual rebalancing is very hard to beat.
But what if we want a more active approach to sell rules?
Threshold Rebalancing
The alternative is to use threshold rebalancing. To select a lower StockRank threshold at which to sell shares to free up funds to invest in higher ranked alternatives. Our own staff Investment Club had some discretionary set 'guard rails' within which Club members could pitch shares. We set the buy threshold as a minimum 75 StockRank and a forced sell threshold whenever the StockRank fell below 50. This forced sell rule was unpopular as everyone gets attached to their shares, but saved us from numerous losses. But these rules were set in a very ad-hoc fashion. Couldn't we be more rigorous?
While I haven't done the research on our own data yet - I have recently stumbled upon an eye opening research paper titled "Combining Factors" by Christoph Reschenhofer - PhD student at the Vienna Institute for Finance, Banking and Insurance. This is a great read for anyone of a geeky bent. It uses a framework not too dissimilar to the StockRanks and tries to answer these questions based on (essentially) a percentile ranking system.
In essence, and if you don't want to read the whole thing, here is the key rule of thumb:
For smaller cap shares....
- Buy at a rank of 92
- Sell at a rank of 72
The above rules work for his multi-factor ranking based on Value, Momentum and a couple of Quality factors (profitability and investment) in an equal weighted mix on US stocks. They take transaction costs into account and are optimised to find the exact ranks to maximise the risk/return trade-off (Sharpe Ratio).
For large caps, the rules of thumb increase to...
- Buy at a rank of 94
- Sell at a rank of 74
But in essence, they aren't that dissimilar. Here is a heatmap that illustrates these numbers for large caps. Let me explain how to read it:
- Scan along the horizontal axis for the 'buy' rank.
- Scan up the vertical axis for the 'sell' rank.
- Green is 'good' - and indicates a positive risk/return tradeoff.
- Red is 'bad' and indicates a negative risk/reward tradeoff.
- The optimal risk/return thresholds are at the black diamond at 94/74.

Clearly the "rules" above are optimal points in a range of good choices. Purchasing above ~90 and selling at any cutoff down to ~50 does work fine… but returns are optimised at higher sell ranks. If investors want to minimise transaction costs, choosing a lower sell cutoff doesn't lose that much in terms of performance.
Christophe found that the turnover of the portfolio in these cases was about once every 11 months. i.e. not that far off annual rebalancing. But Christophe also found that if you wanted to reduce the turnover further, you could use a filter to only include shares with a momentum rank above 50... this seemed to reduce the turnover dramatically to make the average holding period to 24-36 months. An unusual result.
Conclusion
There's a huge amount in his research paper, and lots to delve into. I am pulling out some rules of thumb above which are based on a different data set to the StockRanks so should be used with caution. These rules also are based on being continuously invested - so the aren't a timing model. Bear market investors beware.
Nonetheless I'm a huge advocate of finding sound rules of thumb and applying them in worlds of uncertainty. The above rules very much align with the kinds of StockRank levels that some of the best investors in the community have mentioned they use to me for optimal performance.
As a last point of note on the 'rules of thumb' topic, and for further reading, I can't recommend enough the work of Gerd Gigerenzer and especially his book "Risk Savvy - How to make good decisions" which is incredibly eye opening for improving choices in health, wealth and other areas of life.
Disclaimer
This is not financial advice. Our content is intended to be used and must be used for information and education purposes only. Please read our disclaimer and terms and conditions to understand our obligations.
29 comments
The other issue is many uk platforms don't have trailing stop losses.
Stop losses may work better in more liquid markets such as the US and on large mcap stocks.
This is also an interesting article from Investing Chronicle. https://www.investorschronicle...
It references an Swedish study (on the Swedish exchange) that shows a trailing stop between 5-55% will always outperform buy and hold. 20% is the optimum level. In case you can't read the IC article the study is https://www.lunduniversity.lu....
One interesting aspect of the Christophe paper is the reduction of transaction costs to 50bps from near 400bps, thats a properly disrupted sector! I increasingly feel the need to move from HL my investments to get foreign exchange investment accounts and eliminated repetitive exchange fees!
All good stuff, thanks for very useful inputs from various posts.
That study was " Of course, we have to consider that this research was completed only using stocks that consists of the 30 largest companies in Sweden."
A bit different from UK small caps.
I would like to know if that was based on actual trading, as stop losses are not guaranteed, you may get a much lower price, if there is a profit warning or market crash, in fact in a market crash as with Brexit vote, stop losses were a nightmare. . I have been taken out of many stocks with stop losses only to see them bounce back, some even went up over 100%. I did a study on NAPS a few years ago, stop losses would have taken you out of most of the big winners one year, so not only you a loss but also lost all the gains, some of which were around 150%.
Of course you don't need a stop loss to sell shares.
You might also find this this academic paper useful (though it's 50 pages are not exactly written for a lay readership)
It's based on a near 90 year backtest of the US market, and makes a convincing case that a stop loss policy can improve a momentum strategy.
https://papers.ssrn.com/sol3/p...
Bought book on Amazon $AMZN or £AMZN for £3.99 and will read on the airplane, if manage to get on it.
Now on sale, the company that is at $119 - unless we're in the 'dead cat bounce'.
But it doesn't matter what you think - set up an ISA for the grandkids and put a couple of this bad boy in there and forget about it.
Sometimes things are too good to be true. Who can breach that moat (shopping/cloud/books Kindle/etc etc) maybe China was a contender but have found their socialist roots so morbidness sets in.
Hey Ed, thanks for writing such a thought provoking article based on a research article. Having now read the article I can see the author defines a small cap as being below the market median. I wondered if you could let us know how we can compute the market median cap on an ongoing basis. Thanks very much for such a stimulating read.
Very interesting. Thanks.
.
When to sell!! The hardest question in investing by some distance!! When to buy is fairly easy but when to sell…..thanks so much for tackling this issue. I vacillate between Buy And Hold and Sell By Numbers (usually too late). Certainly very interesting to see that Sell By Numbers could have legs. I look forward to hearing more.
Hi, great article Ed
A great article.
The key point here seems to be the decay rate of factors and combined factors. Not sure if this is available anywhere.
I think this may also need to be split into a few size categories because the other consideration is transaction costs which are very size dependent.
The key point here seems to be the decay rate of factors and combined factors. Not sure if this is available anywhere.
This is hard to work out without access to the Stocko database but using data I have collected myself I can get a general feel for things. The chart below was created by taking the Value, Momentum, Quality and Stockranks (and volatility as that is an area of interest for me) and plotting the correlation coefficient as it decays with time. (x-axis in weeks) Momentum is effectively uncorrelated with the starting momentum rank after about a year. Value and Quality decay quite slowly and Stock rank is in between.
The ranks also show regression to the mean which can be seen for the momentum rank in the second chart below. (x axis in days) Q1 -5 are quintiles taken from my database of about 750 shares.
This is very useful.
It is well known that momentum is best measured based on last 52 weeks and then continues to be positive (on average) for the next 52 weeks. After this it drifts or goes into reverse. Therefore any factor with momentum as a component will only have a 12 month shelf life. Probably the reason Ed and NAPS are for a 12 month holding period.
Value and quality are based on business characteristics that are slow moving. But the important point is the market's opinion of the business, which could change quickly.
Without going into this too deeply, the mechanics of mean reversion are vital here. A very high quality score can just indicate an unusually high profit that year. That profit will likely mean revert downwards. Separately the market valuation of this, shown by the P/E ratio will also have a mean reversion path, but upwards you hope. This is just a complicated way of saying DYOR, a high stock rank is just the start of an investigation.
I have done some work on this in the past. The optimum holding time is difficult to calculate as it depends on many assumptions. However, it is possible to get an idea of the shape of the curve. I made the following assumptions to generate the curve below:
1: The expected excess return is proportional to a factor, such as Stockrank.
2: The factor decays exponentially with time. Different factors will have different decay rates
3: There is a cost associated with switching.
The exact values are not important as this is just an example showing the general shape of the expected excess return related to holding time for a particular switching cost. In this example there is clearly a big penalty for trading too frequently. The curve is quite flat around the optimum holding time and falls slowly with increased holding time. High expected return and low transaction cost/spread will shift the curve upwards and to the left, and vice versa.
I don't think it is particularly helpful to spend too much time focusing on NAPS, which are simply anecdote. It would be more useful to generate general principles that can be applied to all portfolios.
That's a great chart @DWit199. Anecdotally I have evidence that this is about right. I've found 1 year holding periods to be about optimal for QVM (after transaction costs), but holding for 2 or 3 years sustains most of the gains. i.e. performance decays slowly.
I am new to investing and have been following closely the Stock Rank levels as a way to invest in the UK market. This is very valuable information. Its a very interesting concept and something I have been wondering the last month. I am using Freetrade so transaction cost is not an issue. Do you think that rebalancing the portfolio more often could make it work better? Thinking every 2 months or maybe every month. Alternatively I can use this rule of thumb to sell my stocks when they fall below the StockRank level that I choose, I am currently choosing only 95+ for buying so perhaps if they drop below 80? Thank you
@ed_banses - I'm doing some work on optimal rebalancing periods which should help answer these questions in due course, but what I've found is that quarterly rebalancing ends up being v. expensive for a number of reasons.
While small portfolios can have costs dominated by commissions, as portfolio sizes grow the most dominant costs tend to be:
So trading on a 'free' website isn't free for the above reasons. When I last looked at Freetrade they didn't let you deal in the full range of small caps - so while spreads may be less of an issue in large caps - a lot of the outperformance potential becomes diminished.
One story of caution... when I started out, I subscribed to the American website aaii.com - and got so excited about their model portfolios. They rebalanced 'quarterly' so that's what I did - but I had a small portfolio size... it ended up being a very expensive lesson !
Hi Ed, thank you for the comprehensive reply and great pointers Yes indeed I am only working on ISAs and SIPPS and working Freetrade Plus so I had most of the stocks being suggested in the screens. I do need to factor the other expenses that you mentioned and review the method. Lots of great info here, I will continue to read. Thanks again. Eduardo
Ed, thanks for the thought provoking article. As a side note, flowing off your comment on AAII: if a longer holding period is seemingly better, why are the guru screens etc on a quarterly turnover basis? Have you considered changing this to half yearly or even yearly to be more reflective of what a sensible practical approach to selling should be?
Great article, very interesting. Would it be possible to assess previous year's NAPS performance using the suggested rules?
There are probably 2 main scenarios:
1. Once sold, wait until annual rebalance to purchase the highest ranked stock in the same industry
2. Once sold, immediately purchase the highest ranked stock in the same industry (this is probably a bit more difficult to assess)
Cheers,
I've added that to my research list.
Ed, interesting article. Re NAPS because you now do top QM and VM stocks, some are below the 92/94 level, will you be changing NAPS rules next time?
Also some would have been sold quickly such as Hill & Smith Holdings (LON:HILS), probably a good thing depending what replaced it.
One concern system glitches, such as the one where quality data was missing which reduced the scores considerably for a few days, this could take out for no reason.
Looking at my folio momentum, most of big movers in the last 30 days are from ranked below 72/74.
This year has been unusual so I would read too much into this years results.
How does the UK data differ from the US?
Since I like round numbers, applying a 90/70 rule to one of my long term holdings Volex: BUY June 2017 @ 54p SR 91 : SELL June 21 2021 @ 373p SR 70. Current SR 45 @ 314p. Clearly I have achieved significant gains on Volex but had I sold at SR70 the gains would have been greater.
A 90/70 rule adds further fuel to the doubts I have had over the last 6-9 months on a buy and hold strategy. However the picture is complicated further by the fact that Volex has gained 25% in the last month with a lowly SR40 so are the major recovery gains in SP lost in the time it takes for the SR to reach 90?
Final thoughts on this are that if the 90/70 rule works then to reduce trading costs it would make sense for me to reduce the number of holdings in the fund and build larger stakes in this lower number.
Yes an approximate 90/70 pairing has always made intuitive sense and this kind of range has generally guided my tactical purchases/sales as guardrails.
I would be lying if I said it always worked out this well... but in 2020-2021 I was doing a lot of active/tactical investing and Reach (LON:RCH) was an almost ideal example of this system working well.
Of course - plenty of examples show otherwise !
Thanks for this Ed. and flagging up the research. It is interesting when looking at the performance history of your Stock Ranks that a lower sell threshold might be OK but, potentially at the cost of some performance vs. less in the way of transactions cost. For example looking at the UK Ranks in Quintiles for >£50m Mkt. Cap. as shown below:
This shows that 80 to 100 wins by some margin - so the 75 or so suggested in your article may not be a bad suggestion. It is notable though that 60 to 80 also generally outperforms, while even 40 to 60 quintile is there or thereabouts. Suggesting that if one wanted to re-balance more frequently, quarterly in this example, which gave higher returns than semi or annually, then using 60 or maybe even 50 might not be a bad compromise to limit turnover, albeit likely at the expense of some performance, although you'd probably still do relatively well overall. Maybe you have the resources / data to test that?
Certainly when I ran institutional portfolio in the 00's of of a similar quantitative scoring process we tended to focus on the top two quintiles and certainly had to justify why we were holding something if it was in the bottom two quintiles and the bottom quintile was a definite no no.
Since then I have been running my onw money via a quantitative process for selecting quality dividend growth stocks from UK dividend paying stocks, which suits my own investment goals & temperament. I have generally selected from the top decile of these stocks and used the top quartile or 75 as a threshold / trigger for selling or reassessing holdings on a monthly schedule as I found a longer re-balancing periods tended to see the portfolio exposure to the factor scores deteriorate quite significantly along the way.
This has worked pretty well, although along the way I have found that some of these have led to poor trades where we were between figures and the data is perhaps somewhat stale. Quite often figures would come out and the Score would annoyingly jump back up again, although that can obviously work both ways. Thus in order to avoid marginal unproductive turnover, I have added a slightly more nuanced approach now where I might give lower scoring stocks the benefit of the doubt if there is news flow due, although that now mean more judgement on a case by case basis rather than following a pure quant process. Having said that though I'd say the picking from the top decile is also prone to that as we all have our natural biases & some stocks that score well can seem very unappealing at face value.
Any way not sure if this helps with the debate, but as an active investor it is how I tend to view and use the stock ranks and my own scores.
All the best, Jamie
Website: Compound Income
Twitter: Jamie@Compoundincome
Jamie - thanks for the insights. I think using personal judgement to trump an algorithm is something we all get better at with experience. Given your many, many years of experience you've earned every right to do so!
I've found in the NAPS that there's always one share that I am extremely nervous about for qualitative reasons, and I have found that I would have been right about 3 out of 4 times to have trusted my judgement.
Thank you Ed for a very thought provoking article. It is a fundamental truth that the simpler something is the more likely it is that it will be adopted consistently. If this method of when to buy and when to sell is proven to improve fund performance then it becomes extremely significant.
Throughout the world of ‘amateur’ private investing, the most glaring omission to my mind is analysis and indeed recommendations on when to sell. And I’m sure I know why, it’s a much, much more challenging decision! And the numerous clever people out there who earn a living joining the barrage of daily buy advice are silent on selling for this very reason. This article is therefore hugely welcome and I look forward to seeing the theme developed. Your man on the SIF portfolio is also a lone voice and I greatly respect his wisdom and courage routinely making his choices public. The only other equivalent voice I know of in the media willing to stick their neck out is the Questor column in the Telegraph, which I rate highly.
Integrating a sell regime as robust as the buy one in NAPS is an absolute necessity and is overdue! Thank you Ed for this article. It is I think the most exciting development possible for NAPS and I hope it can provide a world beating end-to-end solution!
well a big pat on the back for the boy from Brechin for summarising that paper in 2 lines - I got a headache reading the first paragraph! If you do the analysis on Stockranks could you also reverse it and identify dealing in shorts so I can balance out bull and bear markets