Which is the most important factor when looking for multi-baggers

Last week was multi-bagger week on Stockopedia. Ed presented the findings of the ongoing Stockopedia research project to identify the characteristics of the stocks that do exceptionally well. In my weekly article, I introduced the quality metric, Gross Profits to Assets and described how investors can use this to screen for potential high-return investments.
Ed's empirical research, based on the highest-performing UK stocks of the last decade, led him to conclude that multi-bagger stocks have the following characteristics:
- High StockRank
- Small Size
- High ROCE
- Low debt
- Moderate P/E
- Strong Trailing Sales Growth
- Outperforming the market over the last year
- Low share dilution
Thankfully, these correlate very well with my own multi-bagger framework, developed from the 100-baggers book and by following Warren Buffett and Charlie Munger:
- Moat;
- Runway;
- Operational Leverage; and
- Cheap.
I view each element of my multi-bagger framework like a lever. The best returns come from companies that can pull strongly on several of them, ideally all. A large runway allows rapid sales growth, while a moat means growth can be funded without dilution. Operational leverage enables earnings to grow more rapidly than sales, and the same is true for earnings per share due to the lack of dilution. Finally, if the multiple that the market is willing to pay for earnings expands, this further enhances returns.
The maths of multi-baggers
Mathematically, each part has the same impact:
Share Price Increase = Increase in Sales x Increase in Net Margin x Increase in Multiple / Increase in Number of Shares
Here's an example of how this works. Say a company has Sales of £20m and a net margin of 5%. This gives them £1m PAT. With, say, 100m shares in issue, they would have 1p EPS. If the market valued them at 10x earnings, they would be trading at 10p per share.
Fast forward ten years, sales have grown to £100m, and they have a net margin of 10%, then their PAT would be £10m. If the market now ascribed them a 20x P/E and the shares count had doubled to 200m, the share price would be 100p. Investors would have made ten times their money.
Share Price Increase = 5 x 2 x 2 / 2 = 10
The list of multi-baggers
Ed's seminar focussed on the highest performing ten stocks that started with a market cap greater than £50m. However, he also shared a longer list of stocks that had been high performers over the last decade across all market cap ranges. Here is the complete list:
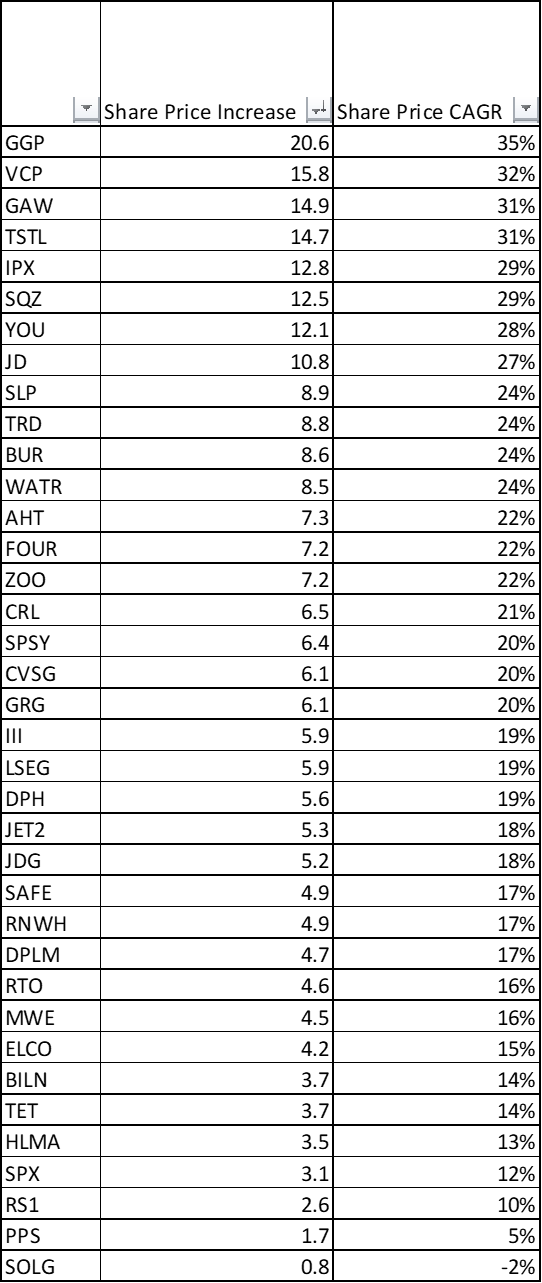
[Note that my returns are taken from this week's share price compared to that ten years ago. This means that several stocks are no longer top performers, which demonstrates how volatile stocks like this can be. My numbers also exclude dividends and any spin-offs or divestments, which would have enhanced the returns of many of these stocks.]
I am interested in which factors, Increase in Sales, Increase in Net Margin, Increase in Multiple and (lack of) Increase in Number of Shares, have had the most significant impact on these stocks being multi-baggers. To do this, I downloaded ten years of Income Statement data and calculated the power of each of these levers for delivering exceptional share price performance. But first, let's get the bad news out of the way.
The bad news
As Ed already pointed out, screening for all these multi-bagger factors is rarely a successful strategy. In his webinar, the screen of his quantitive yielded no results. Despite this, investors can use the Stockopedia screening tools to help narrow the field by using some looser criteria. This is what last week's Gross Profits to Assets screen attempts to do. Or the screen for Buffett and Munger-style stocks that I created last year.
When presenting these screens, a typical response from investors is that the results don't look like multi-baggers. And I agree. If a company looks like the perfect stock on all metrics, the market is efficient enough to spot this and price it so that the multi-bagging has already occurred. Many investors look at companies whose share price has risen a lot and assume it must be a great company rather than doing the work of finding a great company where the share price doesn't reflect this yet.
Instead, investors may need to look at something like Luceco (LON:LUCE) , which came out on top when I looked at potential Buffett-style stocks. It can be hard to believe that a supplier of electrical products could be a good company, let alone a great one. However, this company has a long-term RoE averaging above 20%, a commitment to growing organically and by acquisition, operational leverage and is modestly priced. See my Stock Pitch here. This is no guarantee of future performance, but the management must be doing many things right for the company to have these attributes.
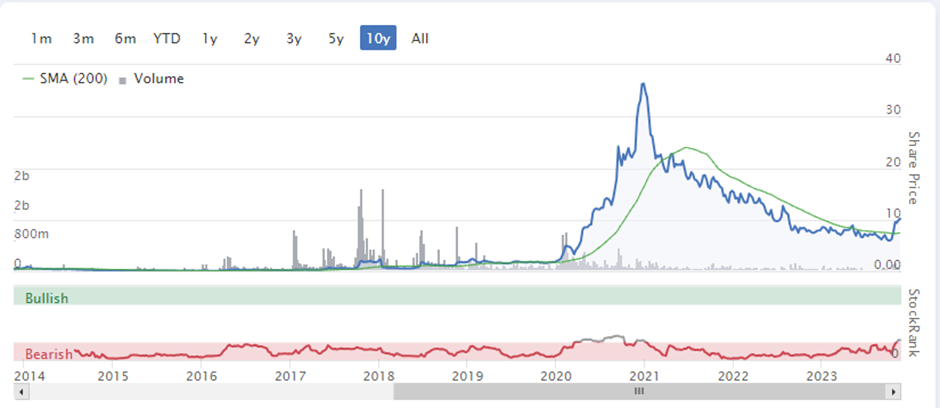
The second piece of bad news is that investors will not be able to spot all stocks that turn out to be multi-baggers. For example, two companies on the list, SolGold (LON:SOLG) and Greatland Gold (LON:GGP) , have had zero revenue for the whole 10-year period. These stocks have done well because they have found large amounts of gold. The real returns to investors here came from a relatively short period. Investors in Greatland Gold (LON:GGP) really made their money buying in early 2020 and selling a year later, rather than holding for ten years:
For these reasons, I exclude Mining and Oil & Gas companies in this analysis.
It's not just the high performers amongst companies in extractive industries that are hard to spot. Take, for example, Triad (LON:TRD) . This company has lower sales than a decade ago. Its last results were loss-making, whereas it made a profit ten years ago. Yet the share price is 8.8 times higher. Almost all of the share price gain came in a brief period at the end of 2021:
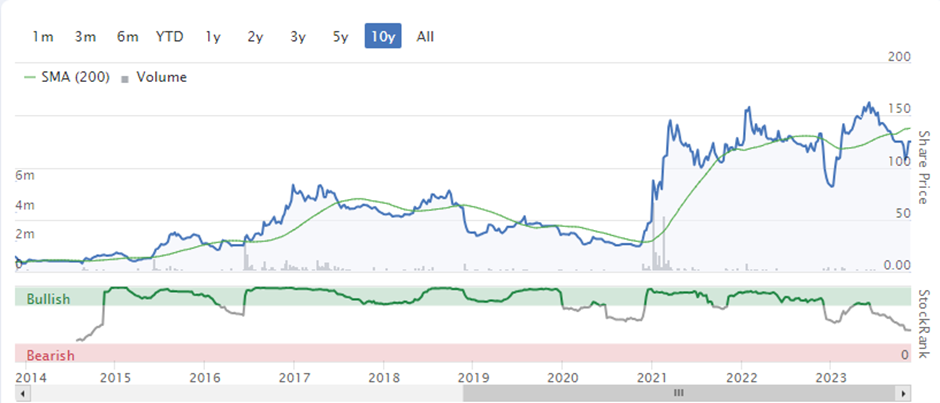
This rise appears to coincide with the time that they announced they would explore doing blockchain work. As far as I can tell, this sudden enthusiasm for the crypto world never delivered any significant revenue. Their strategic partner, Stratis Group Ltd, was filing micro-entity accounts at Companies House without an income statement. Unsurprisingly, the words "blockchain" or "Stratis" are not mentioned in recent results. The fact that the shares haven't given up all these gains appears entirely due to luck and probably illiquidity. Hence, I won't be considering this further.
I am also excluding Proton Motor Power Systems (LON:PPS) . This appears to have been loss-making for all of the last decade, and if I use the current share price of 4.25p, it has only gained 70%, a CAGR of just 5.4%. So this is not the kind of company we are interested in.
What can we learn from the rest?
Firstly, Share Price Gain is correlated to revenue growth:
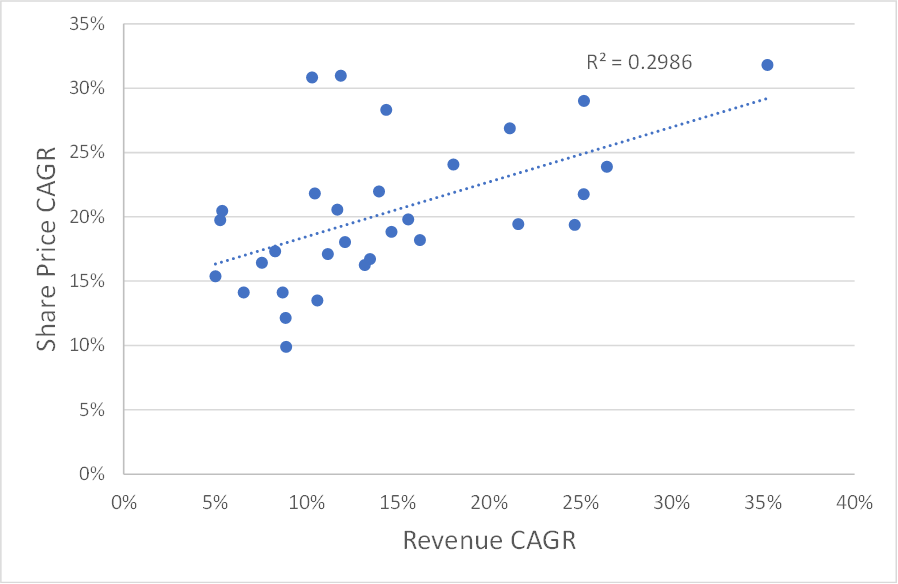
Indeed, Revenue Growth has the strongest R-squared value (a measure of statistical correlation between variables) between share price increase and the various factors.
Several of the companies had phenomenal revenue growth rates. However, many of these were due to acquisitions, which saw the share count soar. This didn't impact their share price returns significantly because many of these also had operational gearing, which helped maintain this growth:
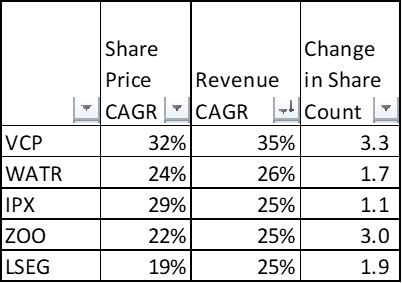
Kudos to the management of Impax Asset Management (LON:IPX) , as they generated these growth rates without issuing significantly more shares. It is worth noting that acquisition-led growth adds risk, as recent questions over some of the Victoria (LON:VCP) acquisition accounting have shown. In £ ZOO's case, acquisition-led growth has left them with a high fixed cost base, leading to losses as revenue has declined recently.
Revenue Growth wasn't the only driver of returns. Nine stocks managed strong returns despite single-digit revenue growth CAGR:
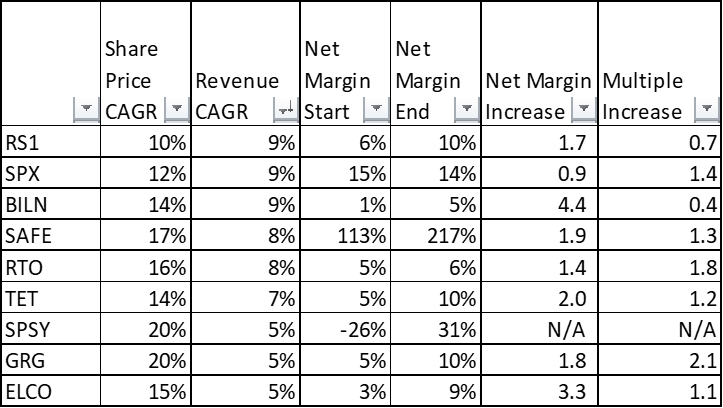
In these cases, the returns were mainly driven by increases in net margin. Multiple increases also aided all but Billington Holdings (LON:BILN) and £RS1. Six companies saw significant multiple increases:
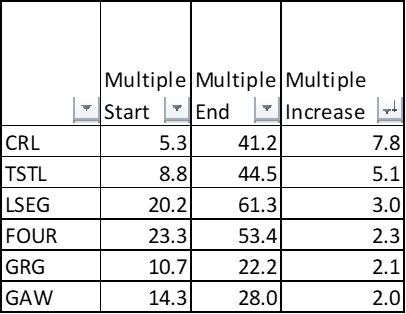
(Although the Creightons (LON:CRL) figure perhaps reflects shareholders' hope that trading will recover from a weak period, and earnings are temporarily depressed, rather than a complete change in sentiment.)
Nine stocks saw a multiple contraction:
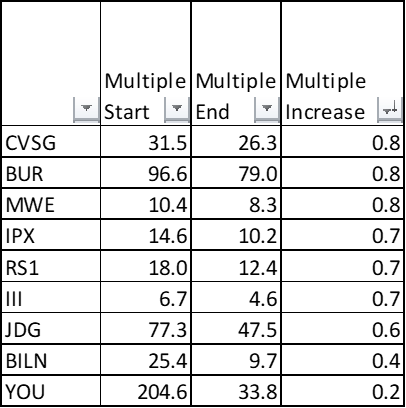
Partly this reflects the very high starting multiple for some of these companies, such as Judges Scientific (LON:JDG) or YouGov (LON:YOU) , but it also highlights how much sentiment plays a part in stock returns, even over the long term. Overall, this backs up the assertion that buying cheaply plays an integral part in generating exceptional returns:
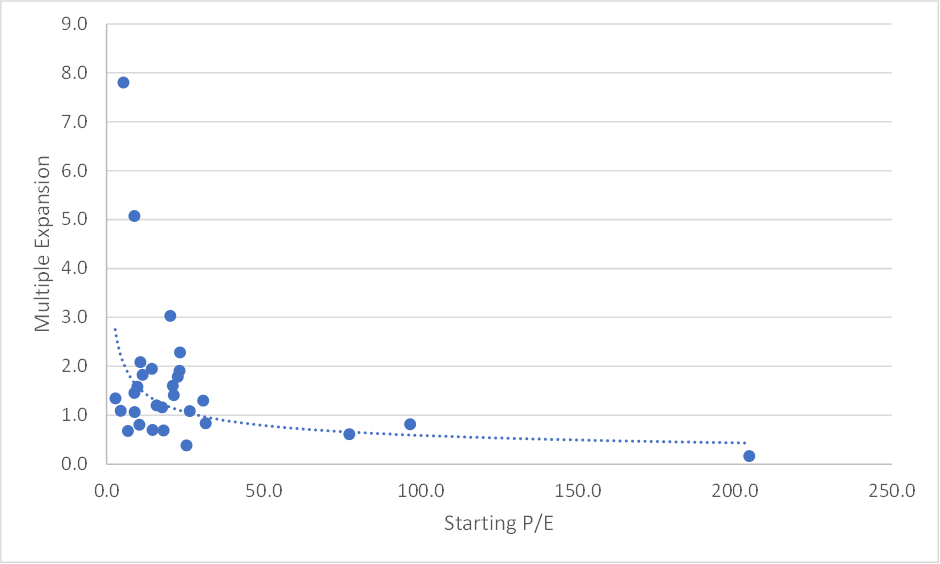
Conclusion
Each of the levers, Increase in Sales, Increase in Net Margin, Increase in Multiple and (lack of) Increase in Number of Shares, played its part in at least one of these shares being multi-baggers. However, if investors have to pick one lever to look for most, it would be the potential for rapid sales growth. Operational leverage also had a big part to play, and if investors can find companies where the net margin is low single digits but has the potential to expand into the teens, they will do very well. Although multiple expansion had an impact, this was very hard to predict, as it depended to a large degree on investor sentiment; many of the companies that saw the most significant multiple expansions were not the fastest growers of either sales or earnings. However, investors were still better off buying cheaply because these companies tended to see multiple expansion, whereas, on average, already expensive stocks faced a headwind of multiple contraction. Happy hunting!
[Disclosure: Mark owns shares in Billington Holdings (LON:BILN) Luceco (LON:LUCE) ]
Disclaimer
This is not financial advice. Our content is intended to be used and must be used for information and education purposes only. Please read our disclaimer and terms and conditions to understand our obligations.

9 comments
Really enjoyed the work on multibaggers; however, to do a similar, but much less sophisticated review of my own on where some of my screened possibilities were a couple of years, or even a year, ago, I need historic values for momentum, value and quality. Past values for Stock Rank do, of course exist, so is it possible to have histories on the other ranks?
Thanks Mark. Very interesting piece of work. Please can you tell me the quickest way to find the net margin?
Hi WarrantStar,
The quickest way is to just divide the Profit After Tax by the Revenue. It’s not on the StockReport but can be screened for or added as an item on table views for portfolios or screen results. The Operating Margin is on the StockReport and gives you some idea of the Net Margin as long as there’s not too much debt or cash on the balance sheet.
Hope that helps
Mark
Thank you Mark. That is very clear.
Interesting article.; I'm reading 100-baggers by Christopher Mayer. It's an interesting read.
Owner-operators is sometimes a factor, so heavy insider ownership is a bonus. A log long time ago there was a poster over on Motley Fool who put together a "family firms" portfolio. By all accounts it did much better than the market.
I'm putting together my own set of criteria: ROE > 12.5%, dividend cover of at least 2 (to allow reinvestment), sales growth of at least 5% pa, reasonable PER, low debt, and doesn't expand share base much.
What companies do you get with that?
Hi Mark, Excellent piece of analysis to compliment Ed's webinar. Just to clarify your use of 'Multiple' - you're using this as a shorthand for p/e multiple and then if a firm's p/e moves from 15 to 20 that's a Multiple Increase of 5 - or have I got it completely wrong?
Hi Maddox,
Sorry that wasn’t totally clear. Yes, when I’m talking about multiple I mean the P/E, i.e. the multiple of earnings the market is willing to pay. However, an increase in P/E from 15 to 20 would be 1.33 in my table, because, all things being equal, it would make the share price 1.33x the previous share price or 33% higher.
Hope that makes it clear,
Mark
Thanks Mark much appreciated.