Why the best shares often have the worst looking broker forecasts

In last month’s results season webinar, Graham and I discussed the surprising recent strength of UK contractors - names like Morgan Sindall (LON:MGNS) , Kier (LON:KIE) , and Galliford Try Holdings (LON:GFRD) - all of which have been quietly and consistently beating expectations for years.
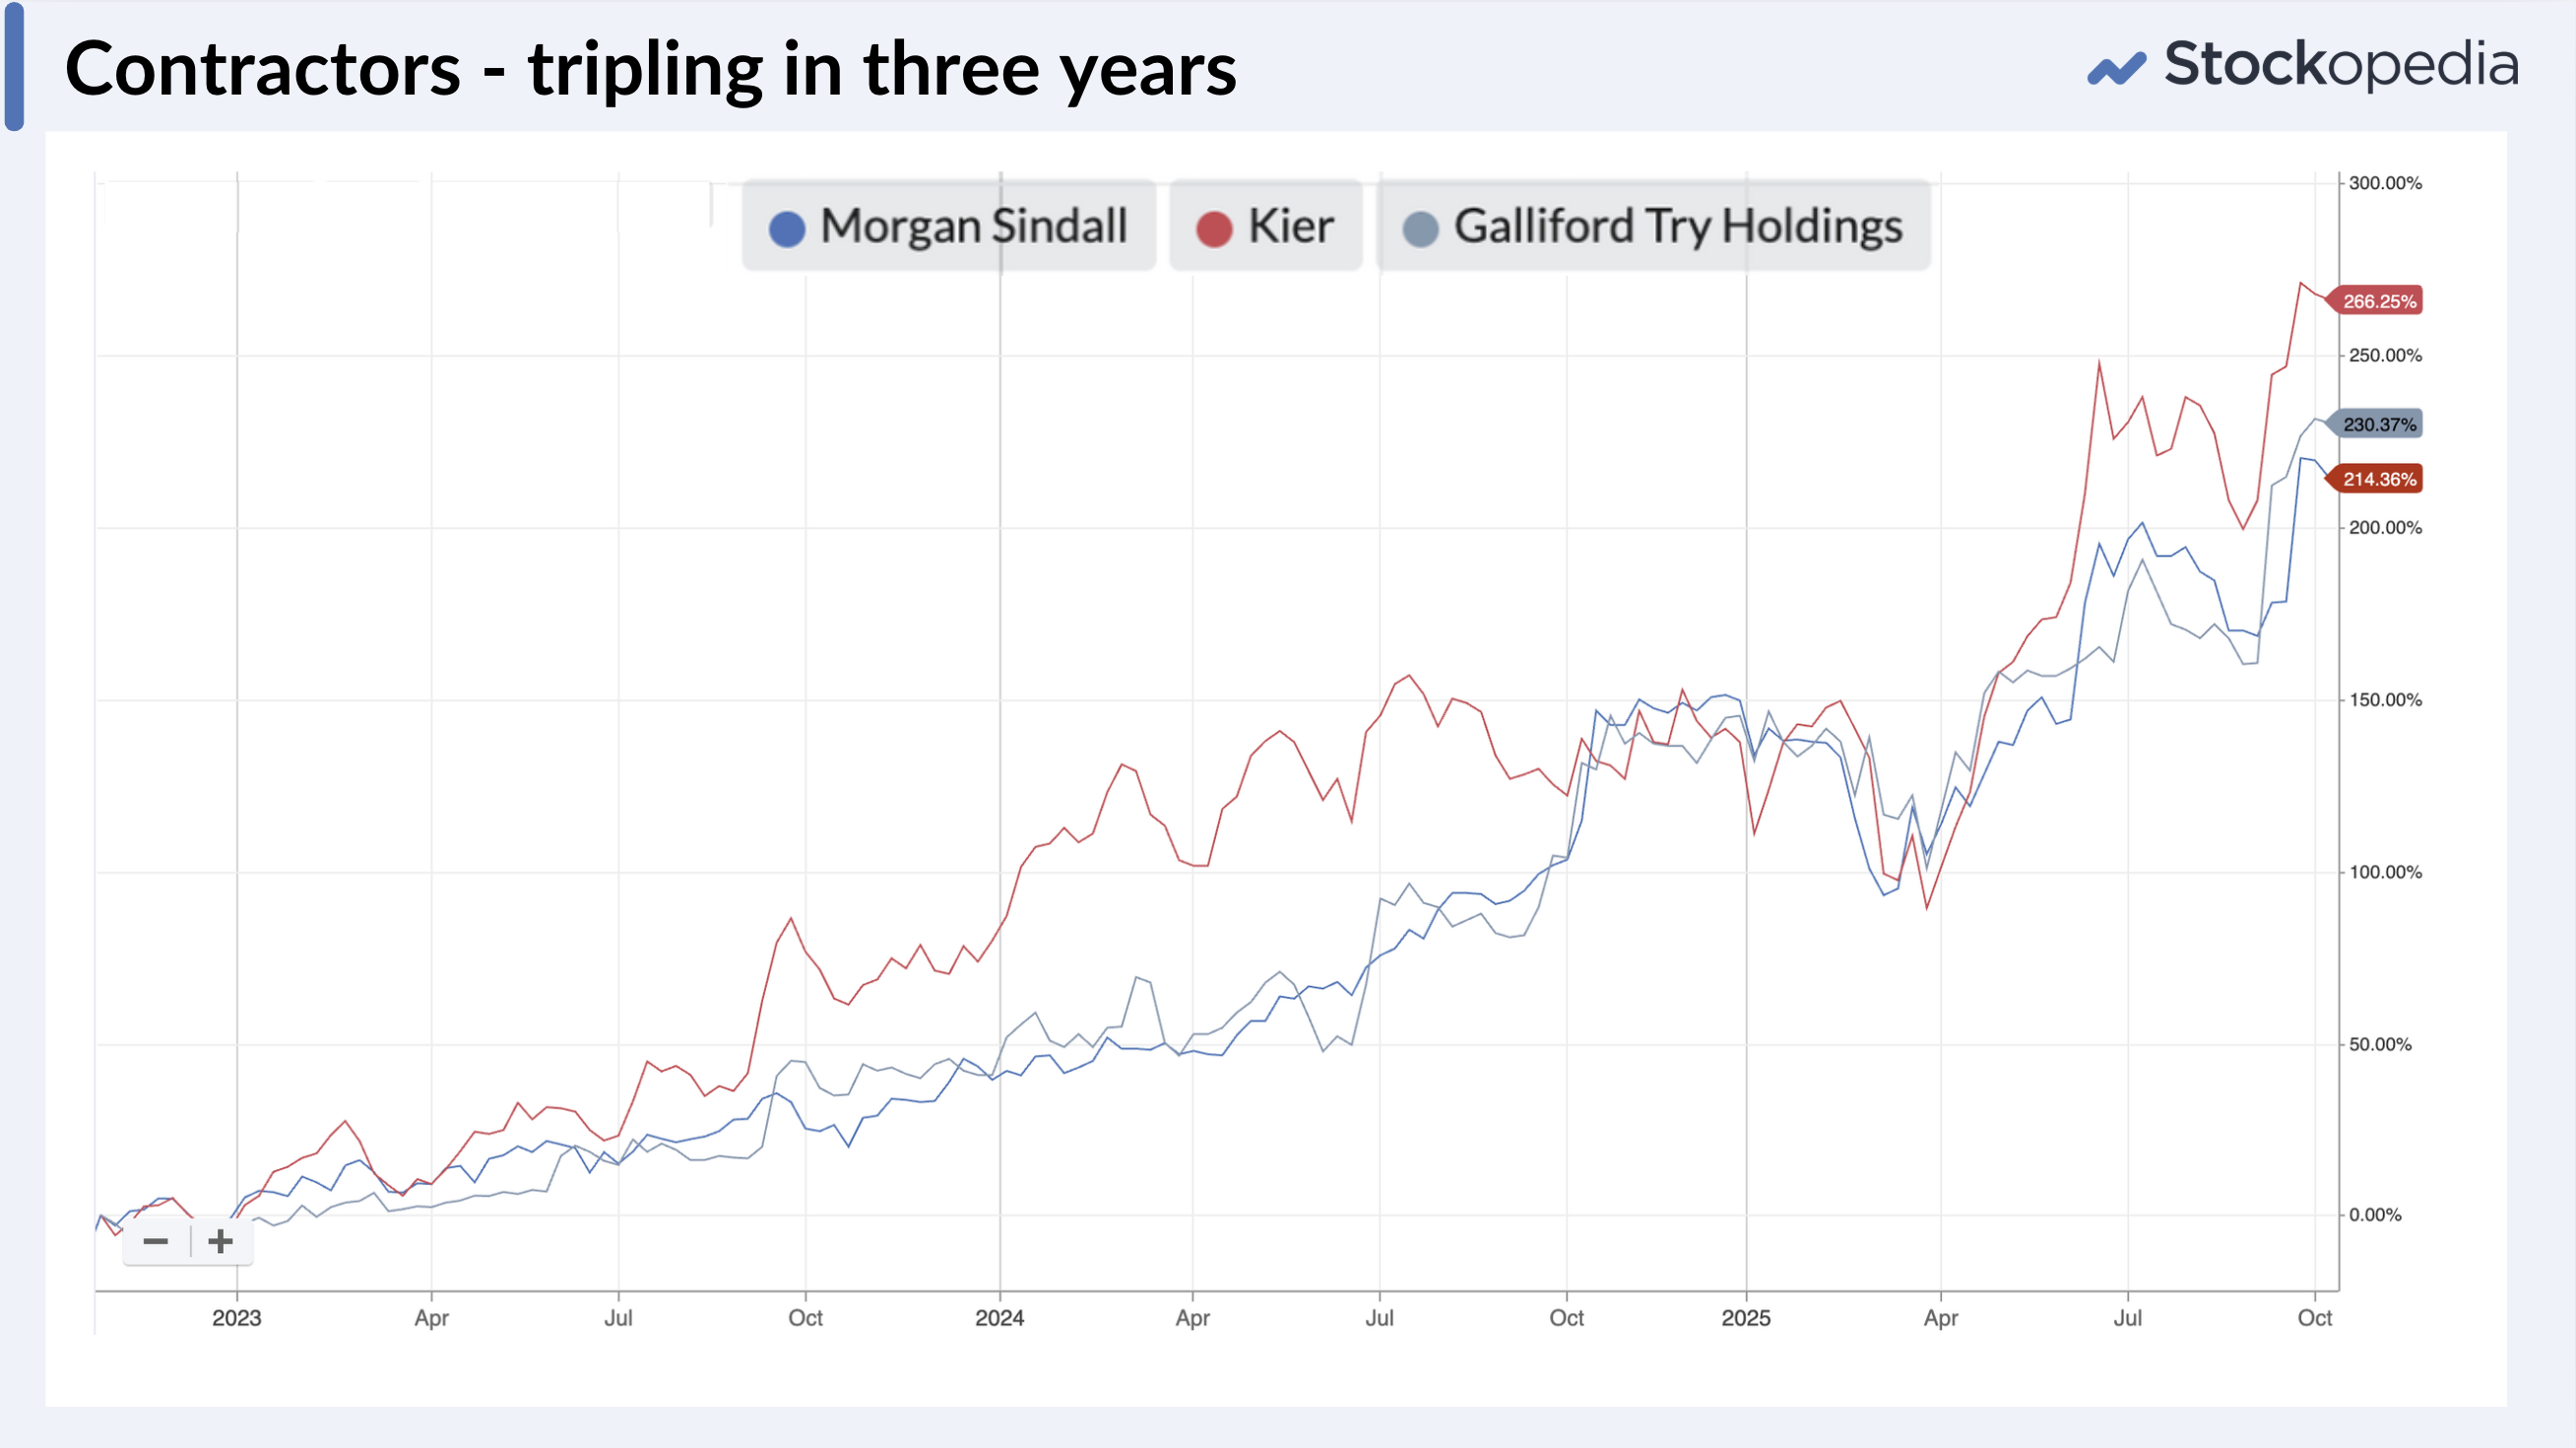
These stocks have carried high, 90+ StockRanks throughout their multibagging runs, but I anticipate they may have been significantly under-owned by Stockopedia subscribers.
Why? Because whenever you looked at their StockReports in recent years, your eye would have been drawn to their earnings growth forecasts and those forecasts have almost always looked flat or uninspiring.
Everyone knows that earnings growth is a fundamental catalyst for share price acceleration. Jim Slater’s Zulu Principle taught us to look for high forecast earnings growth and moderate P/E ratios - growth at a reasonable price right? So, buying shares that show no forecast growth - or worse, negative growth - feels completely alien. Who wants to own a share without earnings growth?
But that’s exactly where the opportunity lies.
There’s far more power in the unexpected
I’ve been rattling on for much of the last year about the power of “ahead of expectations” announcements (see here, here and here). What really drives share prices isn’t forecast growth - it’s unexpected growth. Prices move the most when companies surprise to the upside - and brokers are forced to upgrade their numbers, which often leads to the P/E ratio expanding.
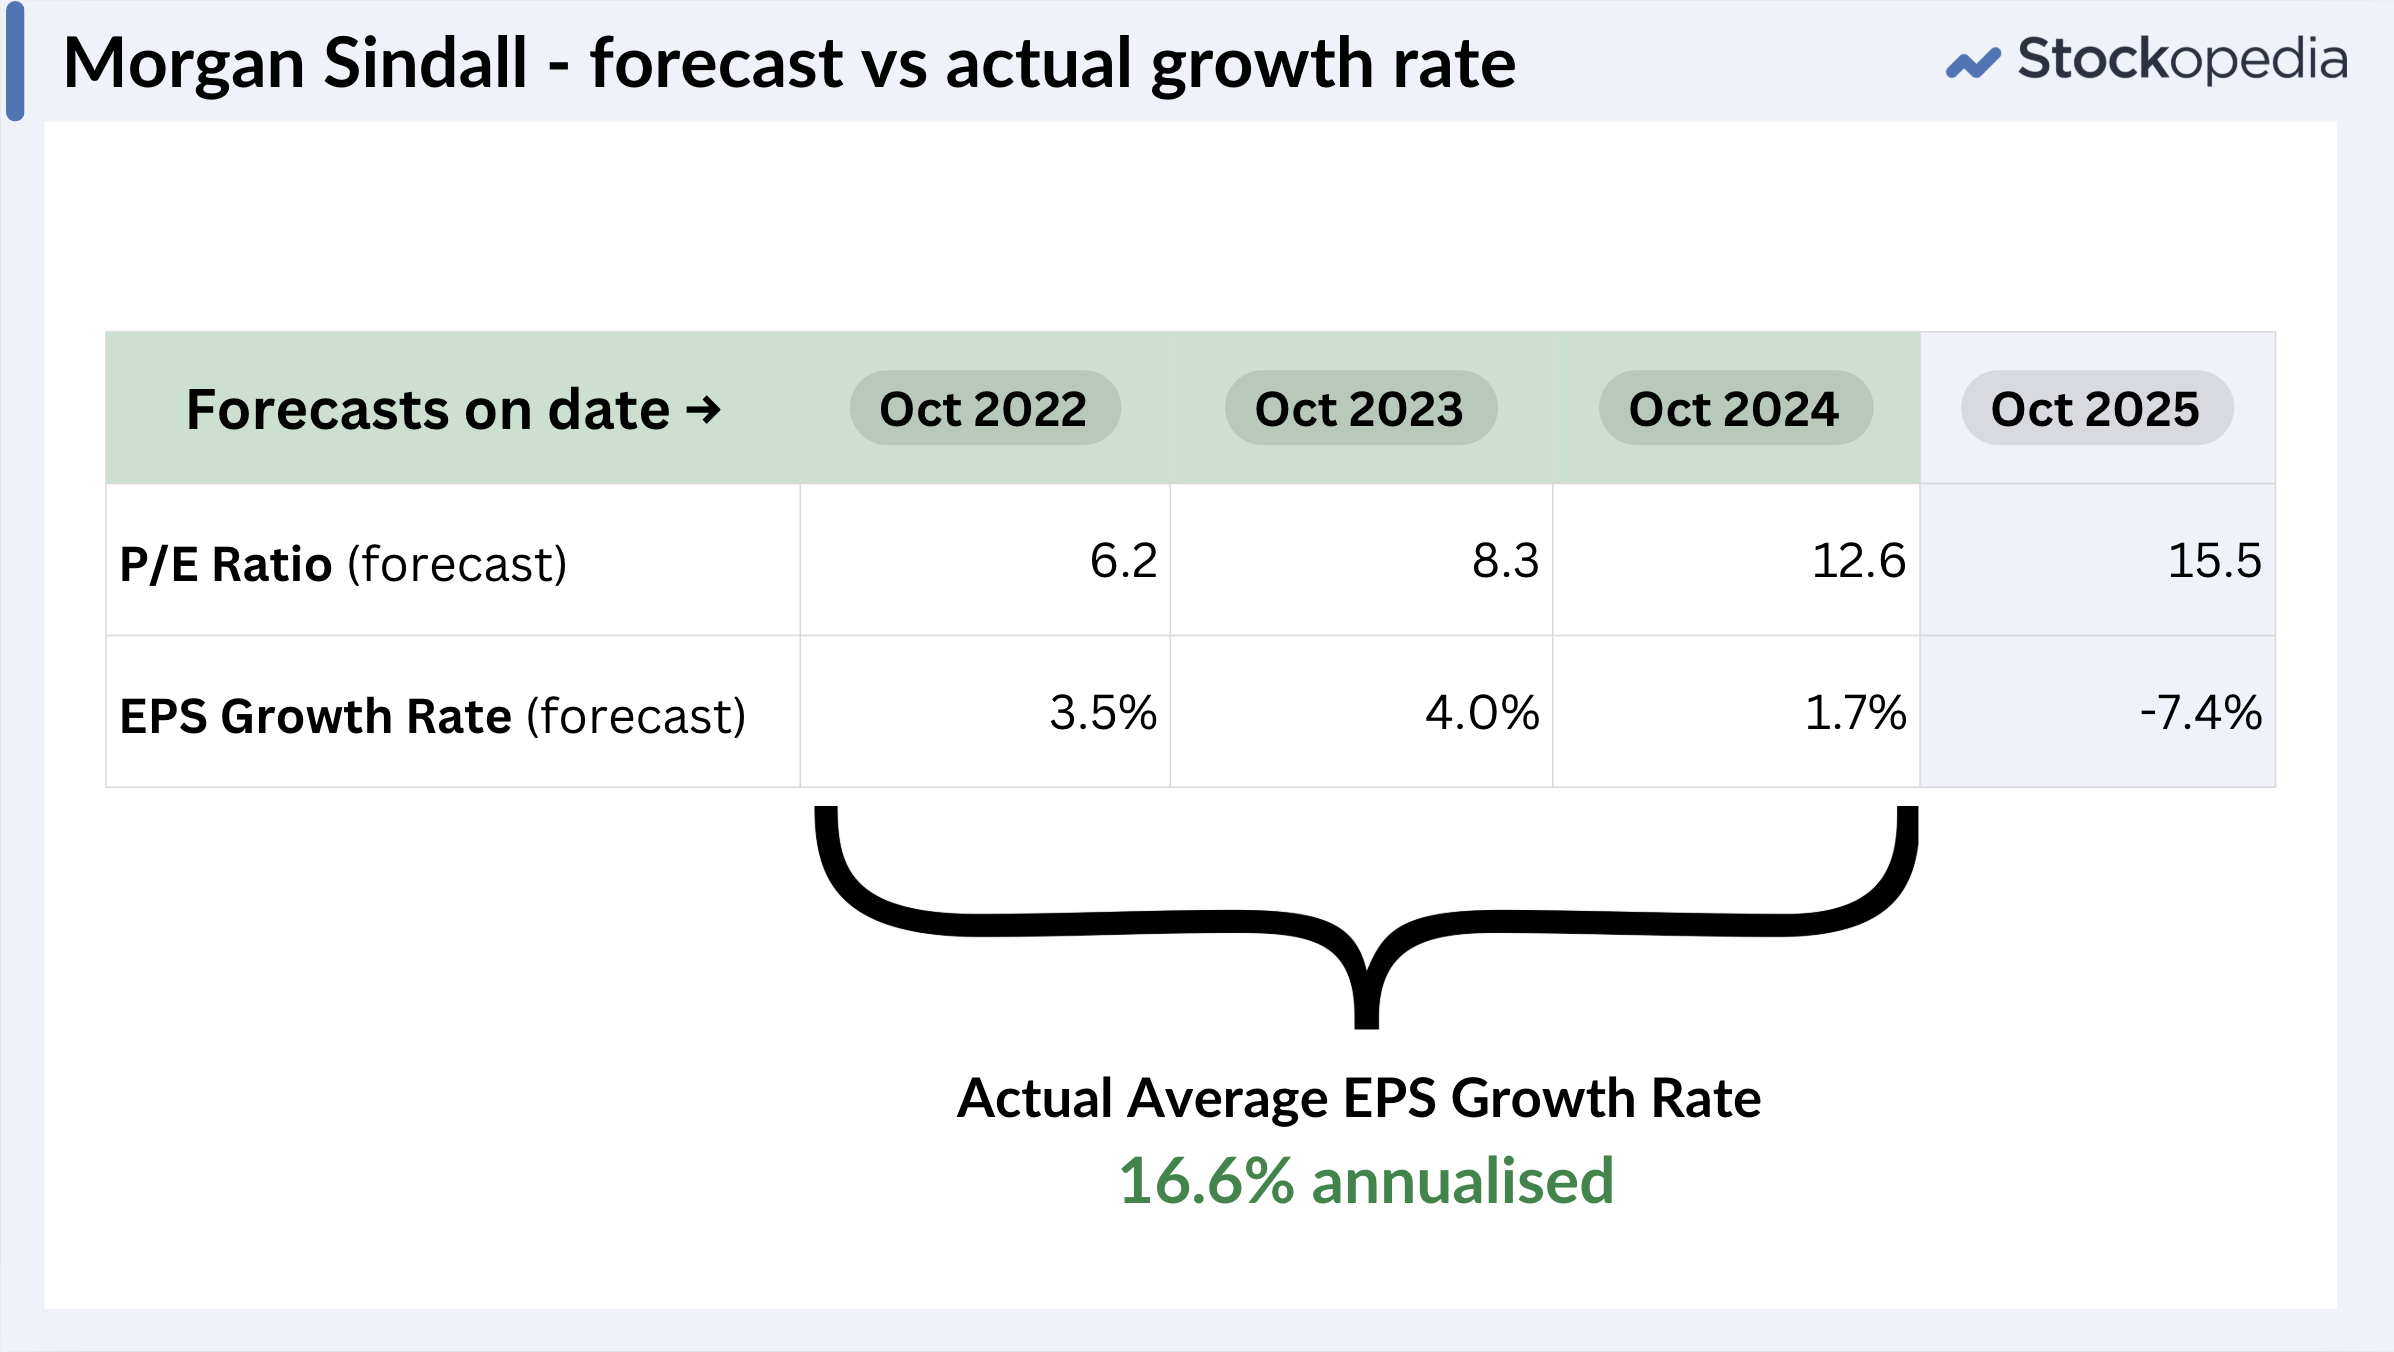
Let’s take Morgan Sindall (LON:MGNS) as a case study. Right now, brokers are predicting negative earnings growth over the next year. But, if you look at its track record, the company has repeatedly delivered significantly higher actual earnings growth than expected.
Go back in time through the last few years (using the rather handy “print” function on StockReports), and you’ll see the same story: earnings growth forecasts were low (less than 4% per year), but realised growth was strong (at nearly 17% annualised). The market was consistently surprised to the upside. It’s those earnings surprises - not the forecasts - that have powered the share price higher.
The StockRanks have long told the same story
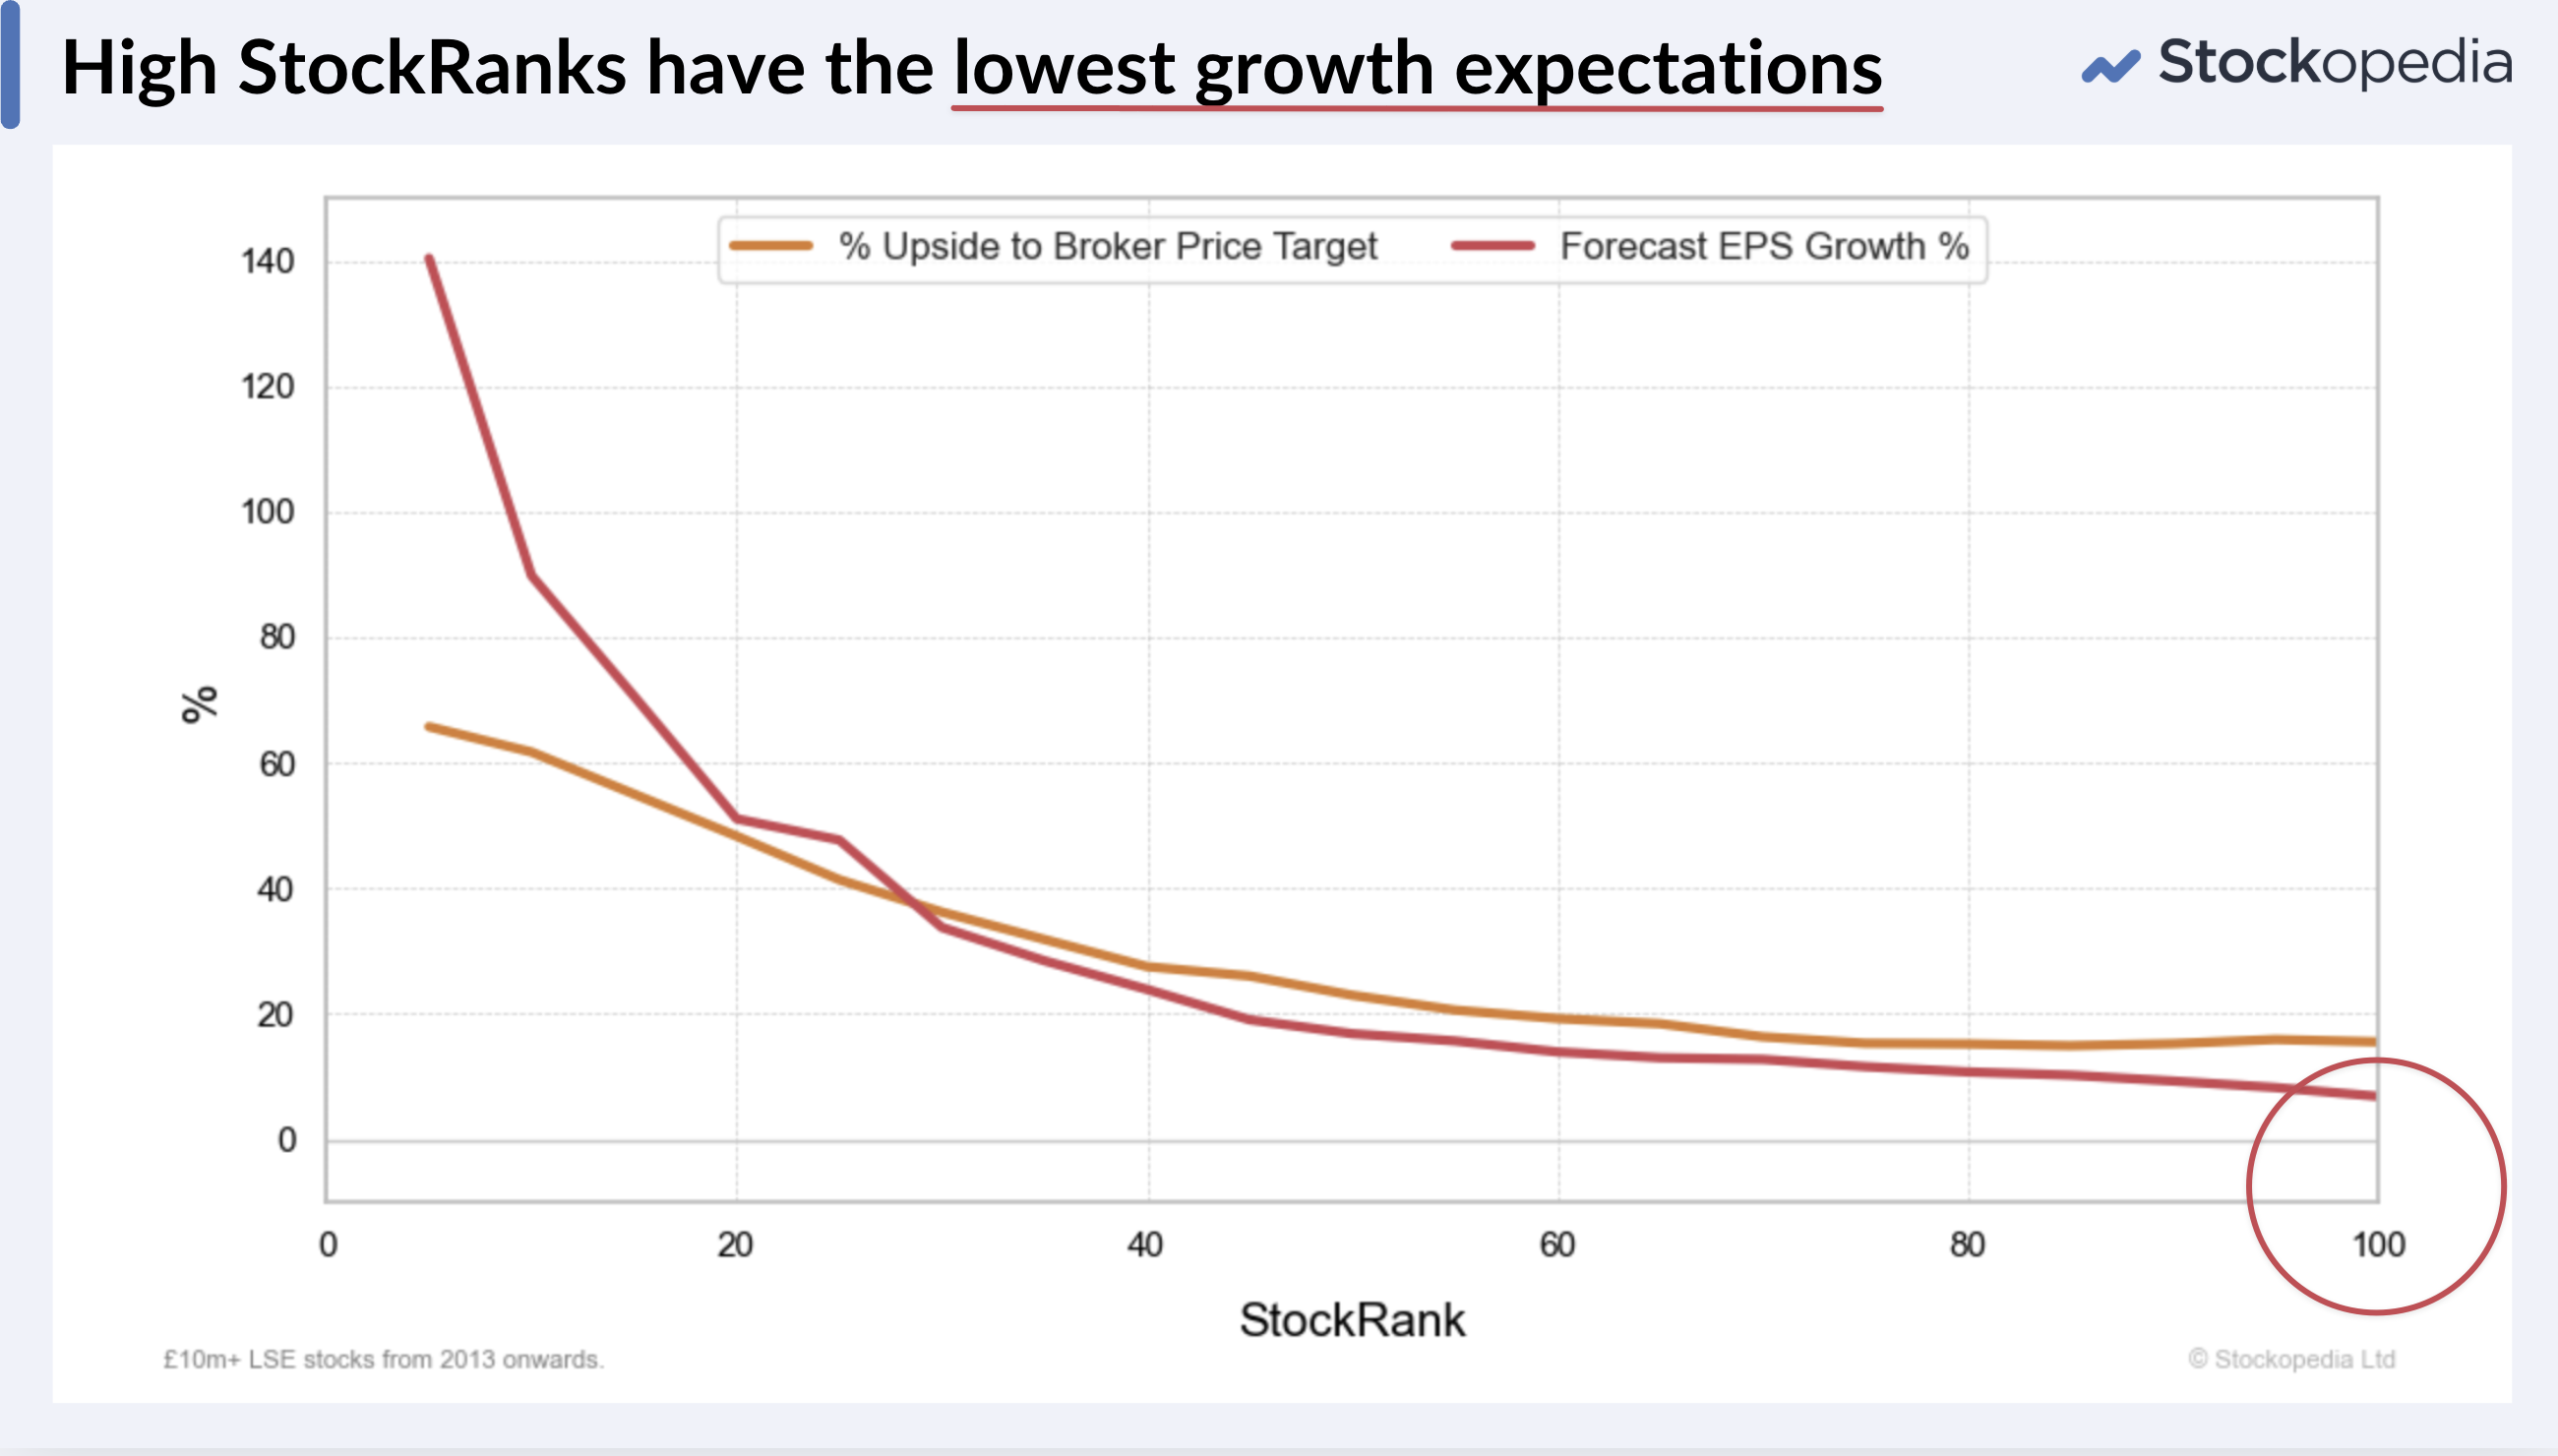
This isn’t just a Morgan Sindall phenomenon. In a broader data study across a decade of UK market data using the StockRanks, we found a consistent pattern - the highest-ranked shares tend to have lowest earnings growth forecasts.
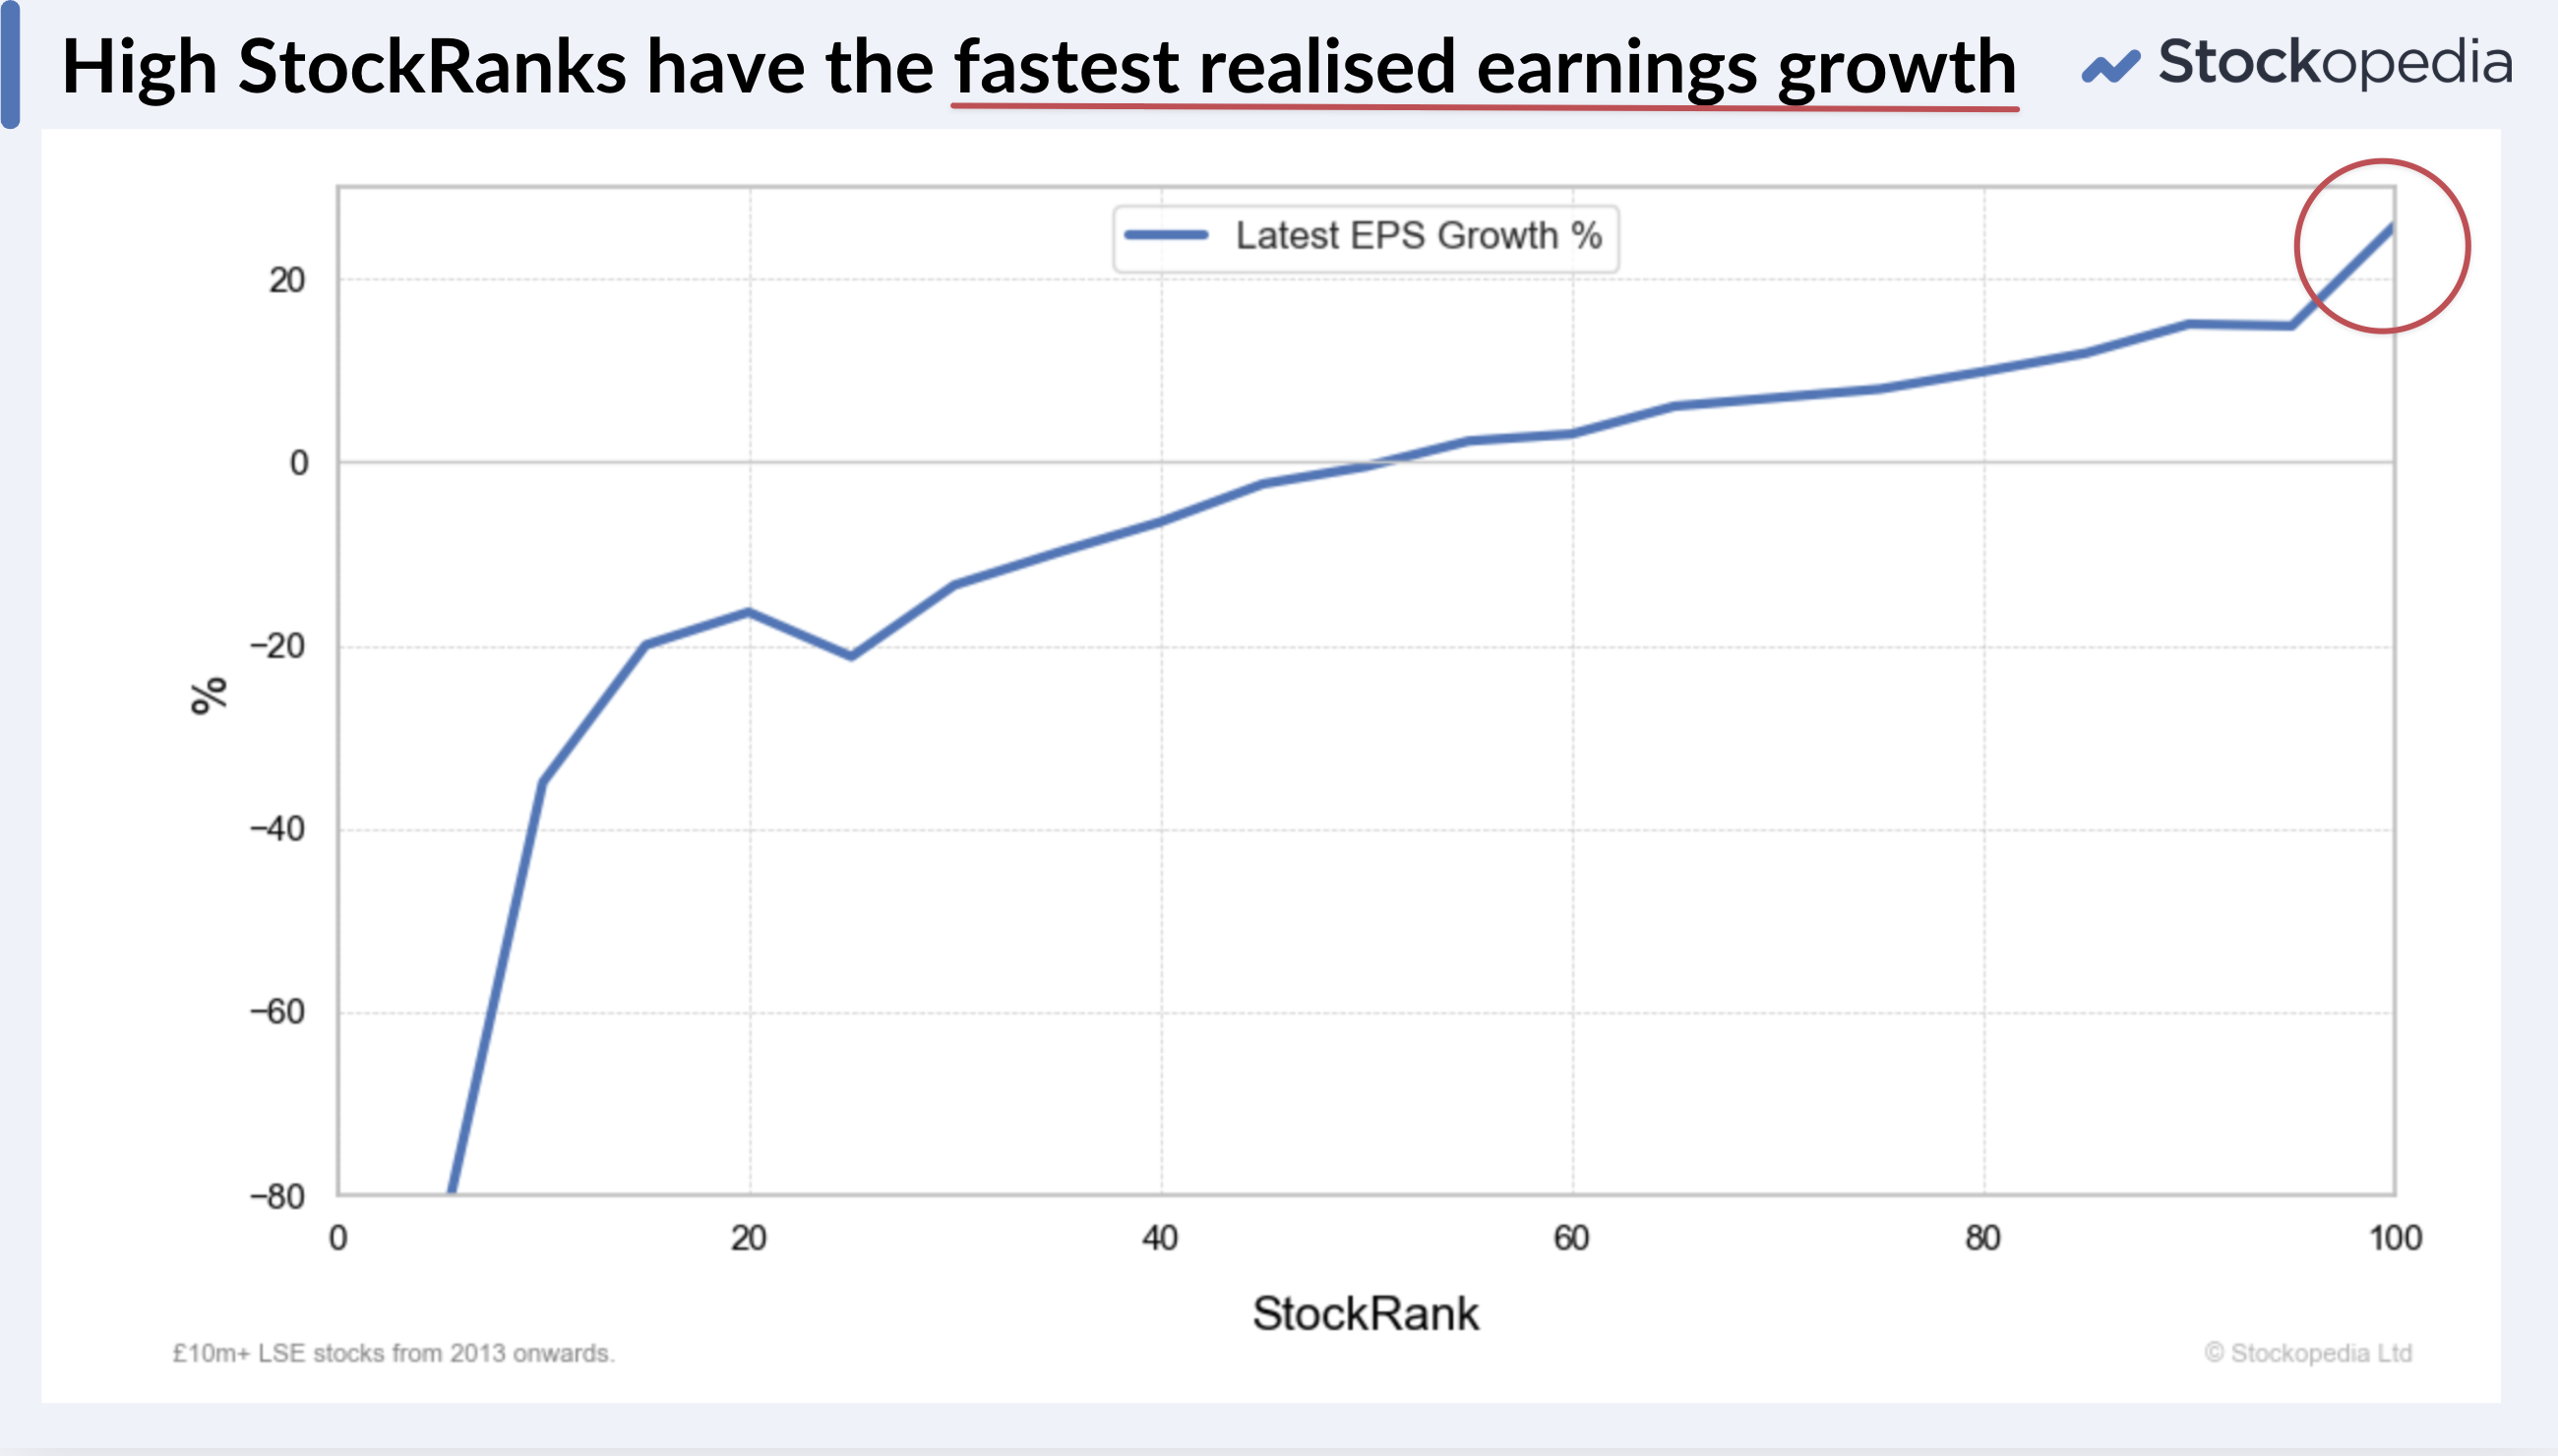
But these stocks show the highest realised growth rates. It’s a baffling phenomenon - the stocks that look least exciting on paper are often the ones that perform the best.
That’s why I like to focus far more on the trend in broker forecasts than their actual value. The question to ask is - are broker forecasts being upgraded or downgraded? The direction of upgrades and the recency of “ahead of expectations” announcements are far more powerful indicators than the level of actual forecasts themselves.
Why broker forecasts are so often wrong
Broker forecasts are notoriously unreliable. Research shared by James Montier in The Little Book of Behavioural Investing showed that when an analyst first makes a two-year forecast for a company’s earnings, they are on average wrong by 94%, and even on a one-year view they are out by an average of 45%!
The problem has been made worse in the UK and Europe since MiFID II, which gutted the equity research industry. Analyst coverage has thinned, become more out of date, and its availability has generally collapsed as research budgets have been cut. What’s worse, as a retail investor you can generally only access research on small caps (via the excellent Research-tree.com) but not on large caps. I can’t access any research on Morgan Sindall at all !
The government knows this - and they commissioned Rachel Kent to create an Investment Research Review of the UK environment which is well worth a read. It recommended the launch of an Investment Research Portal to address this problem.
But even if we do get more timely and higher quality research, it won’t necessarily make forecasts any more predictive. Human bias will still win.
That said, I do still enjoy reading broker research because it helps me understand the narrative - how the market thinks about a company. When I find a stock where the statistics and the story align, that’s when I usually find the best opportunities.
So what actually predicts earnings growth?
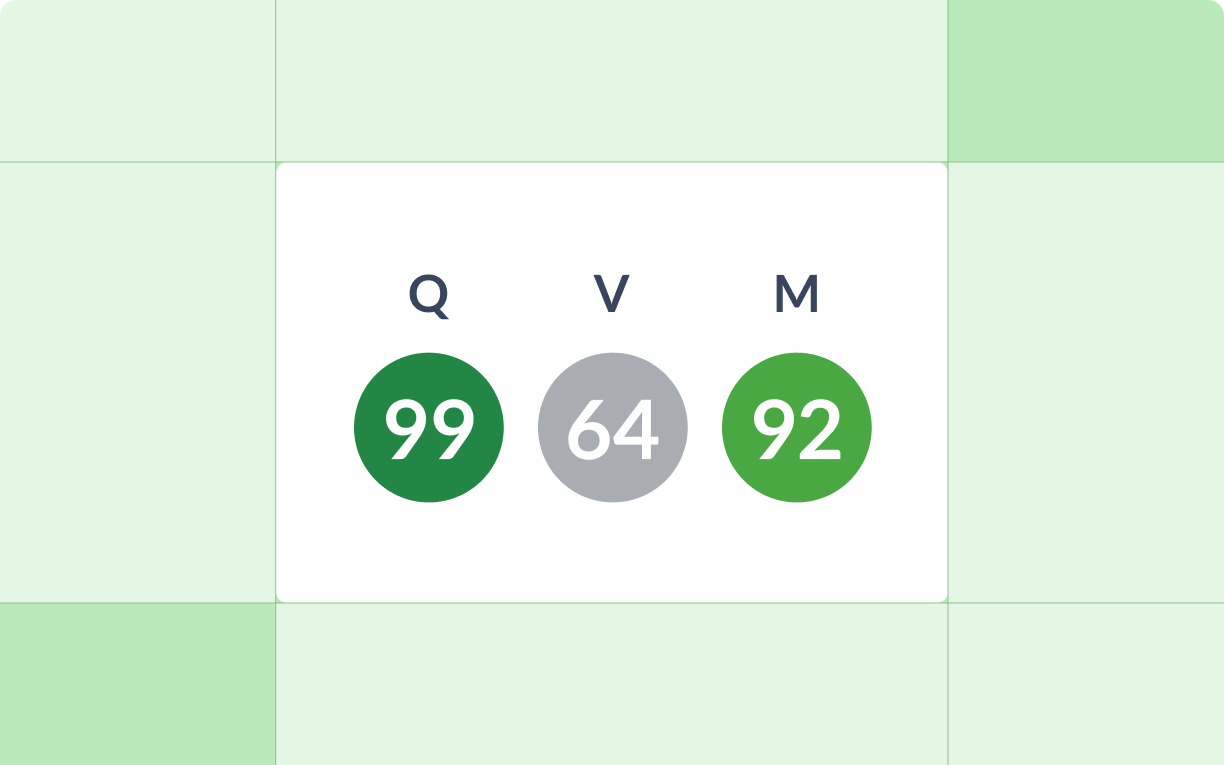
If broker forecasts aren’t useful, what is? You won’t be surprised to hear me say that the StockRanks are. Our own data - and independent research - shows that Quality, Value, and Momentum (QVM) are powerful measures for spotting companies where expectations are lkely to reset.
A brilliant recent paper by Bordalo et al. “Finance without exotic risk” found that roughly 70-80% of returns from value and momentum is explained by expectation errors - where the market has either over or under-reacted.
Why do high QVM stocks so often beat expectations?
- Quality stocks are steady but often overlooked - investors underestimate how easily strong businesses can surprise to the upside.
- Value stocks are often beaten down and expectations are too low - even small improvements can surprise on the upside.
- Momentum stocks are those where expectations are being reset — investors are realising they were too pessimistic and are revising upward, but still lag behind reality.
The key takeaway…
So just to summarise, when it comes to beating the market, it’s actually less important to guess where the puck is going and theorise future growth rates - it’s really about spotting where the market’s expectations are most likely to be wrong, or in the process of catching up.
In a world of thin research coverage and biased forecasts, we need better rules of thumb. And the StockRanks do seem, by design, to be a good proxy for discovering unexpected earnings growth.
So next time you see a company with dismal forecasts but strong rankings, don’t look away. You might just be looking at the next quiet multibagger !
Disclaimer
This is not financial advice. Our content is intended to be used and must be used for information and education purposes only. Please read our disclaimer and terms and conditions to understand our obligations.
26 comments
Interesting read Ed. Looking at one of my biggest earners this year, Thor Explorations (LON:THX), the recent earnings growth was also declining. Going to dig a bit deeper with this looking at the big stock ranks now. Thanks
Excellent article and there's also a chapter dedicated to this phenomenon in Leonard Zacks' "Handbook of Equity Market Anomalies". In order to successfully apply this strategy though, please can Stockopedia EPS and revenue forecasts- particularly for small and microcaps- be updated as soon as possible following news releases and subsequent analyst up/downgrades so we can see the trend? Current Stockopedia forecasts for Spectra Systems (LON:SPSY) and Trufin (LON:TRU) are at least a fortnight out of date and there may be others that I am unaware of.
The ten year graph for Kier should give some sort of an idea why Broker forecasts are cautious...
Tongue in my cheek, Ed -"I can’t access any research on Morgan Sindall at all !" I say try a competitor, Simply Wall Street who reckons it is overvalued by 168.5%. This could well be due to flat and uninspring low-key company forecasts - but there is much more info to reseach on Morgan Sindal in Simply, I admit to using it to cross-reference Stocko reports whever I'm in the buying/selling mood. Other than this, importantly, it looks as if Morgan Sindall (LON:MGNS) which I don't hold held in the past and wish I'd kept it, will lag the Market from hence.
We used to run automated DCFs and valuations here too like SimplyWS - and the valuation you quote essentially proves my point in the article.
If the broker consensus forecasts are unreliable, and predicting negative growth when a company is still on a beat streak... then the DCF will discount a declining earnings trend to some event horizon and the "target price" will be way below the current level.
I'm not sure that's useful at all. MGNS is on a trailing PE of 13.5x... that's a slight discount to the median FTSE All Share P/E of 14.51. If there's a profit warning or economic shakeout - it will fall... but they are guiding upwards a lot right now.
Discounted cash flows do not work for shares.
It's interesting that all 3 have p/e (ttm,forecast and rolling) less than 16. Also sales growth (ttm) is positive. I've put together a screen with one or more type of upgrade and filtered on p/e<16 with sales growth +ve. The resultant folio gives a potential performance of 50% in last year. Perhaps we should be looking at steady growth rather than shooting for the stars!
Can't really see any of the screenshots you've posted just so you know... maybe share or explain how to do it to help others
If you right click the image, you can open it in a new tab and view it there, zoom in, etc. and even save it if you wish.
Ah thanks !
I don't think these are the best performing stocks, depends over which period. Rolls-Royce Holdings (LON:RR.) l think has outperformed them but their forecasts are not great either, so that adds to the theory. Not sure about good miners.
As I`ve mentioned before I have a file which tracks all the above expectation and profit warning updates since December 2024 Shares performing above expectations.xlsx. A couple of weeks ago I tried to work out the eps figures to see if Ed was right about lower broker forecasts leading to better results (column J to L). I also tried to look to see if eps forecasts improved a week later and have improved since the update by looking at them now and whether price rises accompany this. My conclusion from this exercise is its much more complicated than you think, and I struggled to get a clear conclusion (I may have wasted my time!). 70-75% of the time eps and price rose in unison, or stayed flat or fell in unison. But 25% of the time they didnt. I guess due to many reason- broker forecasts not being updated, companies reporting different figures to broker updates (ie those which make them look more favourable), news changing for the company`s prospects since the update, and of course there are hundreds of reasons why a share rises and falls not just earnings and earning prospects. But the most important figures for me are the headline ones displayed in W and Y 234-240. I have a reasonable amount of data now and just buying shares which beat expectations has delivered a return of 12.2% from the close of the day of the trading update, whereas if you bought the profit warnings you would have lost 2.5% , whilst if you bought the FTSE 250 tracker you would have gained 5.7% (note the figures update so they may be different to this when you read this message). My data hasnt shown any advantage from buying shares that rise 10% (to just beating expectations, though they`ve significantly outperformed the market), just a slight advantage from the 3 rules (to beating expectations, again beats the market), and the best performance currently is when shares significantly beat expectations. However I tend to exclude shares below 50m market capitalisation as they`re generally too illiquid for me, so other data may show different percentages, and these are the shares I deemed beat expectations or profit warnings, other people may have different lists.
I think one of the issues with these companies, is the low margins, that has put me off buying them. Some companies are conservative with their forecasts.
great point you are right to be cautious - but companies like this can have great gains in sharepirce when they are running things in disciplined manner adn are on the up. I think the super sketchy pfi load up the profits now to extract maximum bonus and let mug hold the shares areprobably in then past somewhat - but with nay large contract - many of these comp;any may have the risk. I remember losinga packet on one listed company many years ago they were well run conservative outfit for many years and they lost the lot pretty much on one stupid large contract - now what was the ticker again. so dont blame anyone for giving this sector a swerve.
I did include the price to earnings ratio progression over the years in the graphic on Morgan Sindall. Which has risen from 6X to 15 X from 2022 to now. I didn't comment on this for brevity's sake, but it's clear (as with most multi bags) that the majority of the shareprice gains have been due to multiple expansion.
I know many have concerns about low margin contractors, and I have been meaning to write an article about why higher multiples may be justified given their revenue visibility these days - "frameworks" have changed the game somewhat. But it's clear that a lot of the easy gains have been made in a share like Morgan Sindall. But there are other contractors on much lower multiples. I noticed MITIE (LON:MTO) yesterday but I haven't had time to look into it.
Many thanks for this excellent piece Ed, it will be a very useful addition to my learning.
M P Evans (LON:MPE) seems to be a current example of this phenonomen.
Ed never rests in advancing our knowledge. All to great effect. Certainly I have been reluctant to invest in the quoted shares hitherto because of the poor forecasts.
I've never found any correlation between broker forecasts and stock performance; I very rarely look at them; my performance improved dramatically when I started ignoring them and most of the news along with it.
i tend to look at the historical trend on tocky ref eps forecasts. I want to concentrate much more on the direction of trending than anything else. There is a boatload of companies last 24 months that have started high this year and next and chipped away - ok that makes sense in tought times.
we are looking for companies doing well in tough times though - so i think the first time at present that company raises expectations (if trend has eitehr been flat or down) - is potentially the start of good times - the more that is backed up with no later reversal the better.
the most annoying ones are perhaps compaies that say they are on track - but trend has been soldily chipped away at all year - so they have really had a profit warning but done that in 3 6 or 9 chunks so its not a profit warning.
of the companies mentioned here two are eaxtly what i would want to see - eps estimates trending upwards nicely. Kier's is slightly more sketchy with blips - next year trending upwards but this year flat (downa rounding error) - Kier is on the cheaper rating though ref current p/e so that seems factored in. Note kier's range is very narrow so yes 22.4 eps is less than 22.6 12 months ago but thats pretty mucha roudning error.
all seems reasonably solid from al three companies with the lack of the nudges downwards that we see from many companies - note the nudges downward often include companies promising decent growth - for them the excuse that its tough is pretty poor - if you are promising growth much better to keep something in the tank just in case !
Thanks Ed, this is really interesting research. I have morphed into a Swing Trader and this will be very useful to look for high ranked stocks just before results are due. Info which is all available on Stockopedia. Hope this finds you well. Charles
Stock market trading is like playing three-dimensional chess.
Find a company that is making good profits…Maybe, but they probably already have a very high share price.
Find a company that will make higher profits next year…Maybe, but if they have a track record of growth, they probably already have a very high share price.
Find a company that will make higher profits next year, but no one expects this….Bingo.
So, should we be focusing on the Analyst Consensus box in the StockReport, as our best indicator of the movement in the trend of broker forecasts?
Such as below for Polar Capital Holdings (LON:POLR)
OldSchool - yes.. the trend in forecasts is more predictive than the actual level of forecasts. That's why our Momentum Rank includes "earnings forecast upgrades", "recommendation upgrades" and "earnings surprises" as key factors... and why the StockRanks completely ignore the actual level of forecasts.
We knew this a long time ago when we created the StockRanks - but I'm still learning and feel like I'm still peeling back layers of the onion to deepen my own understanding. I do find that writing helps me gain understanding - as Richard Feynman said "if you want to master something, teach it" !
Polar Capital Holdings (LON:POLR) looks good, is good as I like the large dividend but I sold the majority of my holding last week along with 9 poorer companies in order to fund the adding to of 6 small miners. It was a targetted amount I was after, Polar got hurt in the process, and that's just too bad, but a profit was crystallized.
How do you read these graphs? They are showing EPS per week?? into the next two years... so one should be looking for some kind of sudden upturn? thanks