Interim results for six months ended 31 March 2026
9 June 2026
Asia Strategic Holdings Ltd.
("Asia Strategic", the "Group" or the "Company")
Interim results for the six months ended 31 March 2026
The Board of Asia Strategic Holdings Ltd. (LSE: ASIA), an independent developer and operator of consumer businesses in Emerging Asia, is pleased to announce its unaudited interim results for the period ended 31 March 2026 ("6M26").
Financial Highlights
All data for the reporting period refer to the six-month financial period from 1 October 2025 to 31 March 2026 ("6M26") and the Group's financial year ended 30 September 2025 ("FY25"), unless otherwise stated. The comparative six-month financial period from 1 October 2024 to 31 March 2025 is referred to as "6M25".
The year-on-year ("YOY") growth or decline refers to any change that occurred between 6M26 and 6M25, or equivalent periods of one year, as applicable.
All figures are reported in United States Dollars ("$"), unless otherwise specified.
All data pertaining to the student numbers across the report, including tables and charts, are rounded to the nearest ten for clarity and presentation purposes.
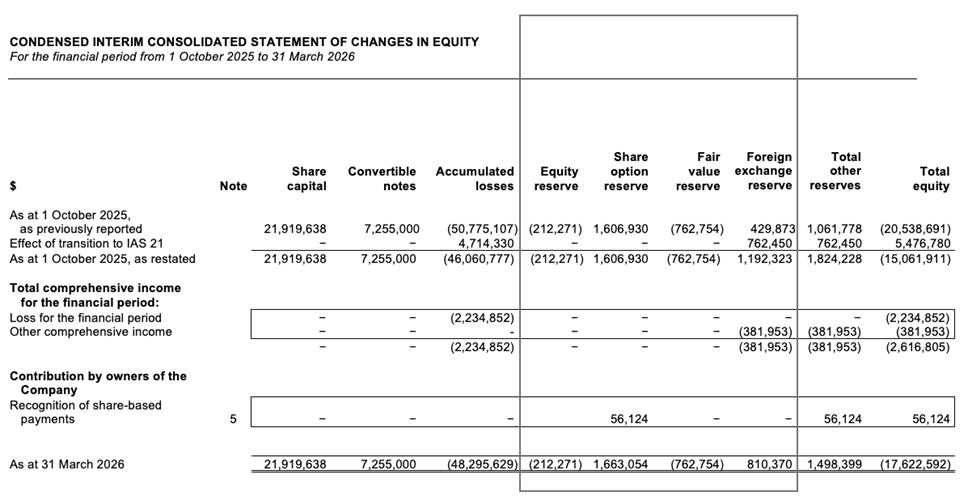
The Group adopted the amendments to "IAS 21: Lack of Exchangeability" from 1 October 2025, applying a market-based exchange rate for the Myanmar Kyat ("MMK") that more closely reflects prevailing conditions. The daily spot exchange rates applied during 6M26 ranged from MMK 3,600 to MMK 3,650 per USD with reference to the market trading rate published by the Central Bank of Myanmar ("MTR"), compared to the reference exchange rate ("RER") published by the Central Bank of Myanmar rate of MMK 2,100 (FY25: MMK 2,100). This change has materially reduced the MMK-denominated revenue, assets and liabilities reported in USD for the Myanmar operations of the Group, despite continued growth in local currency terms, while at the same time materially impacting the realised foreign exchange loss. In accordance with the transitional provisions, comparatives have not been restated. As at 1 October 2025, the cumulative effect of IAS 21 has been recognised in opening accumulated losses and in the foreign currency translation reserve (Refer to Note 2 of the financial statements for further details).
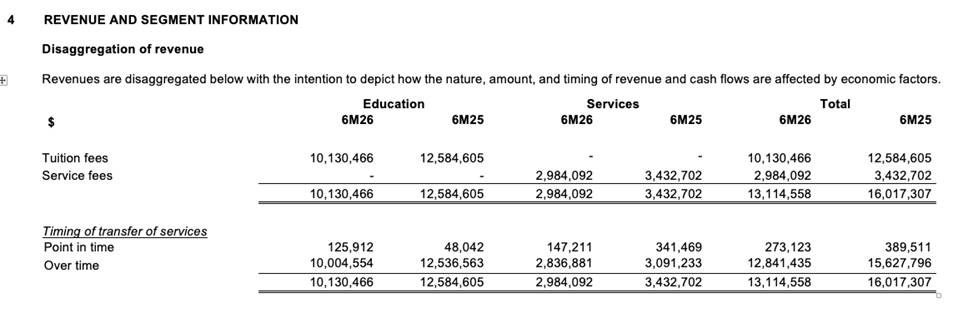
• Group revenue declined 18% YOY to $13.1 million in 6M26 (6M25: $16.0 million), primarily reflecting the IAS 21 translation of MMK-denominated revenues at the MTR. The Education division accounted for 77% of revenue (6M25: 79%), while Services contributed 23% (6M25: 21%). Key revenue movements included:
◦ A 24% decline (22% increase based on RER) in Myanmar's Education division (6M25: 27% increase), driven by contributions from newly launched brands and the continued scaling of existing operations;
◦ A 13% decline (24% increase based on RER) in the Services division (6M25: 2% decline), reflecting the replacement of large USD-denominated contracts by MMK-denominated ones, and the non-renewal of certain risk reporting contracts as the security situation gradually improved; and
◦ A 10% decline in Vietnam's Education division (6M25: 4% decline) driven by a weaker commercial performance at Wall Street English Vietnam. There was a partial offset due to 32% growth at Kids&Us Vietnam and 70% growth at Logiscool Vietnam, although off a smaller base.
• Group gross profit declined 17% YOY to $7.8 million in 6M26 (6M25: $9.4 million), with the Education division contributing 93% (6M25: 94%) and the Services division 7% (6M25: 6%). Gross profit margin remained consistent at 59% (6M25: 59%), supported by an improvement in the Education division's gross margin to 72% (6M25: 70%), reflecting efficiency gains from maturing schools and improved cost management, whilst being partially offset by a marginal decline in the Services division's gross margin to 17% (6M25: 18%) amid pricing pressure in Myanmar.
• The Group recorded a reduced net loss of $2.2 million in 6M26 (6M25: $3.7 million loss). The improvement was supported by a $0.4 million foreign exchange gain (6M25: $1.3 million loss) and a 13% reduction in administrative and other operating expenses to $9.6 million (6M25: $11.1 million), partially offset by a $0.9 million loss allowance on trade and other receivables relating to an affiliated entity (Refer to Note 12).
• Adjusted net losses, excluding the $0.9 million loss allowance on trade and other receivables, were $1.3 million (6M25: $3.2 million adjusted loss, excluding the plant and equipment write-off). The reduction of adjusted net losses reflects the evolution of the Group's new businesses and the ongoing cost optimisation at Wall Street English Vietnam.
• Group adjusted EBITDA was $1.3 million in 6M26 (6M25: $0.3 million LBITDA), a significant achievement in the Group's history, driven by improved operating performance across the Education division and cost reduction initiatives.
• At 31 March 2026, deferred revenue, representing cash received in advance of remaining performance obligations, was $14.5 million, of which $10.7 million was current (1 October 2025, as restated under IAS 21: $10.4 million), and $3.8 million was non-current (1 October 2025, as restated under IAS 21: $2.8 million). On a like-for-like basis against the restated comparatives, current and non-current deferred revenue grew 3% and 34% respectively, reflecting healthy advance bookings particularly across Auston and the franchised brands in Myanmar.
• The Group reported a positive operating cash flow of $2.9 million (6M25: $2.1 million), driven by increased advance payments in the Education division. If repayment of lease liabilities (including principal and interest) were considered, the Group would have recorded a positive adjusted cash flow of $1.0 million (6M25: positive $0.3 million). This improvement reflects a more efficient cash conversion cycle and disciplined working capital management. In parallel, the Group adopted a more strategic approach at Wall Street English Vietnam, implementing targeted cost reductions and commercial adjustments to support its pathway to profitability.
• The Group invested $0.8 million in capital expenditure in 6M26 (6M25: $0.2 million), focusing on two new Kids&Us schools in Vietnam, the expansion of the Yangon American Bahan and Auston Yangon campuses, as well as the renovation of the Auston Mandalay campus post-earthquake in Myanmar in March 2025.
• The Group maintained a $4.5 million loan facility (the "Loan Facility") with MACAN, the Group's largest shareholder. No additional drawdowns were made during 6M26. As of the report date, $0.8 million of the facility remains available.
• Diversification of the Group's operations across multiple countries continues to play an important role in mitigating single-country risk. Management has determined that there are sufficient mitigating actions within the Group's control to ensure liquidity for at least the next twelve months from the date of this report.
Operational Highlights
Education
• Revenue from Education businesses declined 20% YOY to $10.1 million in 6M26 (6M25: $12.6 million), primarily reflecting the IAS 21 translation of MMK-denominated revenues. The Myanmar Education brands grew 22% YOY (excluding Yangon American) in local currency terms.
• At 31 March 2026, deferred revenue from Education businesses, representing cash received in advance of service delivery, comprised:
◦ Current: $10.4 million (1 October 2025: $10.1 million, as restated under IAS 21).
◦ Non-Current: $3.8 million (1 October 2025: $2.8 million, as restated under IAS 21).
• The Education division operates across Vietnam and Myanmar:
Brand
Type
Description
Vietnam
Myanmar
Wall Street English
Franchised
English language education for adults
✓
✓
Kids&Us
Franchised
English language education for children and teens
✓
✓
Logiscool
Franchised
Digital literacy, technology, and coding for children and teens
✓
✓
Yangon American
Owned
K-12 international school
-
✓
Auston
Owned
Tertiary education
-
✓
The number of schools and students at the end of each period were:
Number of Schools
Number of Students
31 Mar 2026
30 Sep 2025
31 Mar 2025
31 Mar 2026
30 Sep 2025
31 Mar 2025
Vietnam
17
16
15
4,860
4,610
4,530
Wall Street English
7
7
7
3,410
3,320
3,450
Kids&Us¹
7
6
6
1,290
1,130
970
Logiscool¹
3
3
2
160
160
110
Myanmar
20
19
17
6,110
5,800
5,380
Wall Street English
5
5
6
3,200
3,290
3,170
Kids&Us¹
4
4
3
780
610
490
Logiscool¹
6
6
4
1,100
850
620
Yangon American
3
2
2
200
190
180
Auston
2
2
2
830
860
920
Group
37
35
32
10,970
10,410
9,910
# of Students Studying Online
1,630
1,600
1,820
¹ New schools opened since 1 April 2026: 1 Kids&Us Vietnam. Schools in the pipeline (i.e., lease agreements signed and under construction) at the reporting date: 1 Logiscool Vietnam, 2 Kids&Us Myanmar, and 2 Logiscool Myanmar.
Vietnam
Total students increased by 5% compared to 30 September 2025, predominantly driven by the increase in Kids&Us.
• Wall Street English Vietnam: Total number of students increased slightly to ca. 3,410 at 31 March 2026, with commercial performance remaining subdued. One centre was relocated to a more cost-efficient location during the period. In response to a continued shift towards online preferences, the Group adjusted staffing, restructured service teams, and recalibrated its commercial strategy.
• Kids&Us Vietnam: Growth continued with financial and operational metrics largely meeting expectations. Student numbers grew 14% to ca. 1,290 at 31 March 2026, driven by stabilising retention rates and the opening of new schools. The Group advanced its growth agenda by refining its site selection strategy and focusing on smaller spaces, while maximising class sizes, optimising space utilisation, and improving margins. Further expansion is planned for 2026, including the potential entry into Hanoi.
• Logiscool Vietnam: Student numbers were broadly stable at ca. 160 at 31 March 2026, as growth was stagnant due to subdued sales at schools in secondary locations. With new leadership installed and planned co-location within existing Kids&Us sites in central areas, performance is expected to improve in the second half of FY26.
Myanmar
The number of students increased by 5% compared to 30 September 2025, driven by growth across all brands except Wall Street English Myanmar.
• Wall Street English Myanmar: Price increases, implemented to hedge against market risks, helped offset the modest decline in student numbers to ca. 3,200 at 31 March 2026. Affordability concerns and increased emigration remain key challenges.
• Kids&Us Myanmar: The business remained resilient, with student enrolment growing 28% to ca. 780 at 31 March 2026, supported by robust demand for early childhood English education. One school is currently under construction, and two additional schools are in the pipeline.
• Logiscool Myanmar: Student enrolment grew 29% from 30 September 2025 to ca. 1,100, representing the strongest student growth rate across the Group's franchised businesses. The commercial success was driven by an experienced commercial team, a strong product offering, and limited competition. One school is under construction and one more is in the pipeline.
• Yangon American: Student enrolment grew to ca. 200 at 31 March 2026. A key milestone in 6M26 was the opening of the new Bahan campus in central Yangon in January 2026, bringing secondary students to a dedicated campus in central Yangon. Yangon American also achieved IB Middle Years Programme ("MYP") authorisation during the period, making it the only IB Primary Years Programme ("PYP") and MYP authorised school in the Myanmar market.
• Auston: Student enrolment was ca. 830 at 31 March 2026, a decline from ca. 860 at 30 September 2025, driven by increased migration and conscription-related uncertainty. Auston signed academic partnership agreements with the University of Wolverhampton in December 2025 and University College Birmingham in February 2026, ensuring continuity and expanded pathways for students. Auston is pursuing an ambitious expansion of its Yangon campus facilities.
Services
• Revenue from Services businesses decreased 13% YOY to $3.0 million in 6M26 (6M25: $3.4 million), reflecting the replacement of certain USD-denominated contracts by MMK-denominated ones, and the non-renewal of certain risk reporting contracts as the security situation improved.
• At 31 March 2026, current deferred revenue from Services businesses, representing cash received in advance of service delivery, was $0.3 million (1 October 2025, as restated: $0.3 million).
• EXERA Vietnam: EXERA Vietnam was launched in FY24 to provide integrated facility management services and generated $29k revenue in 6M26 (6M25: $22k). The business remains an early-stage start-up and is exploring strategic partnerships to increase market penetration.
• EXERA Myanmar: Revenue declined 13% YOY in USD terms to $3.0 million in 6M26 (6M25: $3.4 million). EXERA Myanmar's contracts are denominated in multiple currencies; the decline was partially attributable to a growing proportion of MMK-denominated contracts and the related foreign exchange impact, as well as a net reduction of certain large accounts in a price-sensitive market. EXERA Myanmar employed ca. 2,280 service personnel (comprising primarily of security officers and FM staff) as of 31 March 2026 (30 September 2025: ca. 1,930) across ca. 280 sites in Myanmar (30 September 2025: ca. 250 sites).
SIGNIFICANT AND SUBSEQUENT EVENTS
1) Myanmar general election and political transition
Myanmar held a three-phase general election in December 2025 and January 2026, administered by the Union Election Commission. The Union Solidarity and Development Party secured an overwhelming majority across both chambers of the national legislature and was inaugurated in April 2026. While the completion of the electoral process has introduced a degree of political clarity that the Group cautiously views as a notable development for the operating environment, the transition does not in itself resolve the underlying structural challenges facing Myanmar's economy, including ongoing conflict in parts of the country, constrained FDI, and consumer price pressures. The Group continues to monitor the situation closely and will adjust its operational posture as circumstances evolve.
2) Impact of the Myanmar earthquake
One year after the devastating 7.7 magnitude earthquake that struck central Myanmar on 28 March 2025, recovery efforts have progressed meaningfully but remain fragile. According to the International Federation of Red Cross and Red Crescent Societies, more than 300,000 people have been assisted across earthquake-affected areas with shelter, essential items, and economic support, though thousands of families continue to face challenges accessing stable shelter, safe water, and sustainable livelihoods. Humanitarian organisations have transitioned from emergency relief to early recovery, including infrastructure restoration and livelihood support.
The Group is pleased to report that reinstatement works across its affected Mandalay premises, encompassing Wall Street English, Logiscool, and Auston, have been completed, and the Group has successfully resumed in-person operations at these sites.
3) Global macroeconomic and geopolitical uncertainty
The global macroeconomic and political environment has evolved considerably over the last few months. The escalation of the Iran conflict and the resulting tightening of global oil supply remain the most immediate sources of macroeconomic risk, with the disruption around the Strait of Hormuz elevating energy prices and weighing on import-dependent economies. Compounding this, political turmoil has resurfaced across multiple major economies, with contested elections, leadership transitions, and protectionist trade measures introducing renewed uncertainty into capital flows and consumer sentiment globally. The residual US tariff measures introduced in April 2025 have moderated through subsequent US-China de-escalation and the US-Vietnam Reciprocal Trade Framework, but the broader trade environment remains uneven, and tariffs are now considered a structural feature rather than a transitory shock. Spillover effects from higher energy prices, supply chain reconfiguration, and slowing growth in China and the EU are gradually filtering through to emerging markets, including via softer external demand and tighter financing conditions. In Vietnam, the trade outlook remains relatively constructive, anchored by stable bilateral arrangements with the US and continued FDI momentum, although exporter margins are likely to face pressure as the year progresses.
The broader Southeast Asian outlook is more moderate as the World Bank now expects regional growth to slow to 4.2% in 2026 from 5.0% in 2025; however, Vietnam continues to be among the better-positioned economies in the region. The Group has no direct exposure to the United States, and the direct impact of the residual tariff measures on its operations remains limited. It continues to exercise prudence in capital expenditure planning and to optimise its cost base in response to the evolving macroeconomic backdrop.
COUNTRY ECONOMIC UPDATES
The most recent forecast by the Asian Development Bank ("ADB") is for developing Southeast Asia's GDP growth of 4.7% in 2026. Inflation in developing Southeast Asia is expected to rise to 3.2% in 2026, up from 2.3% in 2025, driven by strengthening domestic demand and higher energy prices linked to the Middle East conflict.
Vietnam
The years stated below refer to the calendar year, which runs from 1 January to 31 December unless otherwise stated.
• According to the General Statistics Office of Vietnam ("GSO"), GDP growth for Q1 2026 was 7.8% YOY, the fastest Q1 growth since 2018, exhibiting strong economic fundamentals and a sustained long-term positive outlook. The full-year 2025 GDP growth was 8.0%, while the ADB forecasts 7.2% growth in 2026. Average CPI for March 2026 increased by 4.7% YOY, while education CPI rose by 3.3%, providing ca.135 basis points of defensible pricing room for education operators. Key inflation drivers included rising costs in education, transportation, food & beverage, and housing.
• Vietnam's exports in Q1 2026 are estimated at $126.6 billion, while imports reached $112.9 billion. The US implemented a 20% reciprocal tariff on Vietnamese imports, locked in through Executive Order 14257 of April 2025, and remains a structural H2 risk. However, the US-Vietnam Reciprocal Trade Framework signed in October 2025 has stabilised the picture, and the bilateral relationship continues to evolve constructively. The most disruptive scenarios have not materialised to date.
• Vietnam's industrial sector continued to strengthen in Q1 2026, with the Index of Industrial Production rising 9.0% YOY, according to the GSO. Meanwhile, Vietnam's S&P Global Manufacturing PMI stood at 51.2, remaining in expansion territory, though the trajectory has moderated from the highs of H2 2025. Manufacturing sub-sectors with relevance to the Group's services operations continued to perform strongly, including motor vehicles (+14.7%), chemicals (+18.2%), and iron and steel (+22.9%).
• Vietnam maintained strong foreign direct investment ("FDI") momentum. In Q1 2026, newly registered FDI was $17.9 billion, with Thai Nguyen alone attracting $5.4 billion through the Samsung ecosystem. Realised FDI of $5.0 billion continued at pace. Public investment disbursement reached VND 110.3 trillion, up 37% YOY, supporting infrastructure capacity and the Long Thanh Airport Phase 1 opening in June 2026. FDI is concentrating in the northern corridor, with Thai Nguyen ($5.4 billion), Nghe An ($2.3 billion), and Bac Ninh ($358 million) among the top recipients. Singapore ($5.3 billion) and South Korea ($3.7 billion) were the largest source countries of FDI.
• The Vietnamese Dong depreciated ca.1.5% YTD against the USD, with the spot rate at ca.VND 26,340 at 31 March 2026, managed within the State Bank of Vietnam's ±5% band. System credit growth of 3.2% in Q1 2026 is already on pace to overshoot the 15% annual target. Interbank rates have risen to ca.7.4%, up from a 4.5% trough in late 2025, signalling tightening conditions from the bottom up.
• New business registrations rose 58% YOY in Q1 2026, while education firm registrations declined 74%, suggesting a consolidation trend that favours established operators. The macro environment is supportive for the Group's education businesses, with education sector GDP growing 8.3%, the fastest rate since 2023. Key regulatory developments include the Personal Data Protection Law (effective January 2026), Decree 69 on fire safety (effective April 2026), the Social Insurance Law (effective July 2026), and the Law on Teachers (effective 2026). The Decree 293 minimum wage increase, effective from January 2026, is limited to workers without vocational certificates and has bounded impact on the Group's operations.
• Over the past two decades, Vietnam has evolved from a low-income to an upper-middle-income band (from $4,466 to $13,845) according to the World Bank, with 2024 GDP per capita estimated at $4,700. With a population of ca.102.2 million in 2025 and a median age of 33.4 years old, Vietnam is the third most populous country in Southeast Asia, after Indonesia and the Philippines. According to the EF English Proficiency Index in 2024, Vietnam was still classified as "Low proficiency".
Myanmar
The years stated below refer to the calendar year, which runs from 1 January to 31 December, and the financial year below refers to the Myanmar financial period, which runs from 1 April to 31 March.
• Myanmar's economy remains fragile, with the ADB forecasting GDP growth of 2.4% in 2026, recovering from a 2.2% contraction in 2025 that was exacerbated by the March 2025 earthquake. However, this growth is largely statistical, reflecting recovery off a depressed base, and does not indicate genuine rebuilding of investment, trade, or consumer demand. The ADB estimates per capita GDP contracted by 2.9% in 2025 and 1.5% in 2024, with a modest recovery to 1.7% growth forecast for 2026 - implying continued severe erosion of living standards through the forecast horizon.
• Inflationary pressures remain acute: headline CPI was 25.2% in 2025, the highest in Southeast Asia, and a March 2026 fuel spike added an estimated 2-3 percentage points to Q1 2026 CPI. The ADB projects inflation to ease to 24.0% in 2026 as a result of a stabilising currency and weakening domestic demand. Affordability continues to compress across consumer segments. The escalation of the Iran conflict and the resulting tightening of global oil supply have exacerbated fuel rationing in parts of Myanmar.
• Manufacturing PMI posted its strongest reading since Q3 2023 at 51.5 in March 2026, driven by stable electricity supply and local substitution amid import restrictions. However, surging input costs, now at an 18-month high, risk arresting the upturn. Employment contraction has returned, signalling a deeper structural constraint as outmigration erodes the skilled workforce. The People's Military Service Law continues to be actively enforced for ages 18-35 (men) and 18-27 (women), accelerating skilled labour outmigration and heightening staff retention risk.
• According to the World Bank, Myanmar recorded a trade surplus of ca.$1.0 billion (ca.1.3% of GDP) in FY25, driven mainly by import compression amid tighter licensing and border disruptions. The fiscal deficit widened to 4.1% of GDP in FY25 and is expected to increase further to 4.9% in FY26, reflecting rising reconstruction and humanitarian spending. The current account shifted to a surplus of 3.2% of GDP in FY25, supported by import compression and remittances, but is expected to narrow to 0.4% of GDP in FY26.
• The Central Bank of Myanmar's ("CBM") Notification 2/2026 reduced the mandatory export earnings conversion requirement from 25% to 15%, providing meaningful relief for export-oriented operations. The official CBM reference rate remains pegged at MMK 2,100 per USD, maintaining a multiple rates market with significant spreads.
• FDI remained at a fraction of pre-crisis levels, with Q1 2026 commitments of $62.9 million across 72 approvals generating ca.10,900 jobs. The new Union Government's FY2026-2027 budget of MMK 195 trillion targets 3.4% growth, with priority spending directed toward agriculture, MSMEs, and infrastructure. Key legislative developments include the Union Tax Law 2026, the Construction Development Law, and a signalled SEZ regulatory review.
• Myanmar faces persistent infrastructure and energy challenges, worsened by reduced FDI, limited external support, and widespread power shortages. Seasonal hydropower dependence and earthquake-related grid damage continue to drive frequent outages. Moreover, ca.80% of natural gas production is committed through long-term contracts to neighbouring nations.
• Political uncertainty and rising internal displacement continue to destabilise the labour market, hinder economic recovery, and shift consumer behaviour. Coupled with inflationary pressures, these factors have led to a significant rise in price sensitivity across the population. According to the World Bank, 3.7 million people were internally displaced and ca.16.0 million people required humanitarian assistance as of January 2026. Meanwhile, the World Bank's State of Education in Myanmar report noted a significant rise in household spending on private tutoring in 2023, as families sought to support their children's education amid uncertain times, a trend that is expected to remain stable.
Enrico Cesenni (OSI), Chief Executive Officer of Asia Strategic, commented:
"The first half of FY26 has been a period of stabilisation and strategic repositioning for the Group. While reported revenue declined to $13.1 million, this primarily reflects the adoption of a market-based exchange rate for the Myanmar Kyat under IAS 21, which more accurately reflects the economic reality on the ground and the lack of exchangeability of the Myanmar Kyat. In local currency terms, our Myanmar operations continued to grow strongly, with the franchised Education brands collectively up 22% YOY in MMK terms, and I am particularly pleased that the Group achieved positive adjusted EBITDA of $1.3 million, the first time a positive adjusted EBITDA has been achieved, representing a significant milestone that demonstrates the underlying operational strength of our portfolio.
"In Vietnam, our priority has been to streamline operations and install the right leadership. Wall Street English Vietnam continues its restructuring, with one centre relocated to a more cost-efficient site. At Kids&Us Vietnam, we opened a new school and another in April, with further expansion planned nationwide. We have also installed new leadership at Logiscool Vietnam, and I am optimistic about the brand's trajectory.
"In Myanmar, the Group has moved decisively from post-earthquake recovery into expansion mode. All Mandalay premises impacted have been restored and reopened. Across our newer brands, we have two schools under construction and three more locations secured, in addition to the ambitious expansions underway at both Auston and Yangon American. Each campus is pursuing its own growth agendas: Auston through new UK university partnerships and campus development, and Yangon American through the opening of its Bahan campus in central Yangon. The Group has ambitious plans to expand the Bahan campus to include Early Years and Elementary from the academic year 2026/27.
"We remain committed to long-term value creation and believe strongly in the potential of Emerging Asia. On behalf of the Board, I thank our shareholders for their continued trust and extend heartfelt appreciation to the Asia Strategic team for their resilience and dedication."
For more information, please visit asia-strategic.com or contact:
Asia Strategic Holdings Ltd.
Richard Greer, Independent Non-Executive Chairman
Enrico Cesenni (OSI), Founder and CEO
richard@asia-strategic.com
enrico@asia-strategic.com
Allenby Capital Limited (Broker)
Nick Athanas / Nick Naylor (Corporate Finance)
Amrit Nahal / Lauren Wright (Sales and Corporate Broking)
+44 (0)20 3328 5656
Yellow Jersey PR (Financial PR)
Shivantha Thambirajah
+44 (0) 20 3004 9512
Notes to editors
Asia Strategic Holdings Ltd. (LSE: ASIA) is an independent developer and operator of consumer businesses focused on Education and Services in Emerging Asia, specifically Vietnam and Myanmar.
Education Division: The Group operates a diverse portfolio of education brands, encompassing English language learning, coding, K-12, and tertiary education. As of 31 March 2026, the Education division consisted of 37 schools, serving over 10,970 students.
Services Division: The Group operates two brands: (i) EXERA, an integrated risk and facilities management services provider in Myanmar and Vietnam; and (ii) Ostello Bello, a boutique hostel chain. As of 31 March 2026, EXERA employed ca. 2,280 service personnel (comprising primarily of security officers and IFM staff) across ca. 280 sites.
Asia Strategic Holdings utilises an asset-light strategy to scale its operations and capitalises on emerging opportunities in Vietnam and Myanmar.
OPERATIONAL REVIEW
Education
The Group's objective for its Education division is to become a leading operator and retailer of tech-enabled education services in Emerging Asia.
Revenue from Education businesses declined 20% YOY to $10.1 million in 6M26 (6M25: $12.6 million), primarily reflecting the IAS 21 translation of MMK-denominated revenues. The Myanmar Education brands (excluding Yangon American) grew 22% YOY in local currency terms.
At 31 March 2026, deferred revenue from Education businesses, representing cash received in advance of service delivery, was:
• Current: $10.4 million (1 October 2025: $10.1 million, as restated under IAS 21)
• Non-Current: $3.8 million (1 October 2025: $2.8 million, as restated under IAS 21)
Within its Education division, the Group provides educational products for children, teens, and adults through five brands across Vietnam and Myanmar.
Franchised Brands
Wall Street English is a leading English language education provider for adults with over 180,000 students enrolled in 29 countries. Its flexible and integrated blended learning solution is offered online or through a hybrid online/in-centre approach.
Kids&Us is a leading English language education provider for children and teens starting at age one and operates in ten countries with over 180,000 students enrolled across 600 schools. Its unique teaching method focuses on natural language acquisition, personalised for each student's age and experiences.
Logiscool is an enrichment programme that teaches children coding and digital literacy. Logiscool operates in 30 countries across more than 360 locations with over 320,000 students enrolled and graduated.
Own Brands
Yangon American offers an international K-12 education and is an authorised International Baccalaureate Primary Years Programme and Middle Years Programme school, the only PYP and MYP authorised school in Myanmar. It is also a candidate to be accredited as a Western Association of Schools and Colleges ("WASC") school.
Auston is a private higher education provider in Myanmar offering internationally recognised engineering and IT diplomas and degrees through (i) partnerships with the University of Wolverhampton (since December 2025), and University College Birmingham (since February 2026), and (ii) Pearson Edexcel and BTEC certifications.
Vietnam
Revenue from Education businesses in Vietnam decreased 10% YOY to $3.6 million in 6M26 (6M25: $4.0 million).
At 31 March 2026, deferred revenue from Education businesses in Vietnam, representing cash received in advance of service delivery, was:
• Current: $3.6 million (1 October 2025: $3.5 million)
• Non-Current: $0.6 million (1 October 2025: $0.7 million)
Wall Street English Vietnam
• Revenue from Wall Street English Vietnam decreased 16% YOY to $3.0 million in 6M26 (6M25: $3.5 million). The decline is attributable to the continued shift in product mix toward lower-priced online delivery.
• Student enrolment increased slightly to ca.3,410 at 31 March 2026.
• Cost reduction measures, including school rightsizing and staff restructuring, continue to be implemented to restore profitability. One centre was relocated to a more cost-efficient location during the period.
• At 31 March 2026, Wall Street English Vietnam operated seven schools, with six in Ho Chi Minh City and one in Binh Duong.
Kids&Us Vietnam
• Revenue from Kids&Us Vietnam increased 32% YOY to $0.6 million in 6M26 (6M25: $0.4 million), reflecting accelerating commercial traction as the brand continues to establish itself in the market.
• Student enrolment grew 14% from 30 September 2025 to ca.1,290 at 31 March 2026, driven by stabilising retention rates and new sales from the continued opening of new schools.
• The Group advanced its growth agenda by refining its site selection strategy, focusing on smaller, more efficient spaces, while enhancing service team efficiency. One new school opened in April 2026, with further expansion planned nationwide.
• At 31 March 2026, Kids&Us Vietnam operated seven schools in Ho Chi Minh City.
Logiscool Vietnam
• Revenue from Logiscool Vietnam increased 70% YOY to $77k in 6M26 (6M25: $45k), off a small base.
• Student enrolment was broadly stable at ca.160 at 31 March 2026. Growth was slower than expected in 6M26, driven by subdued sales at schools in secondary locations.
• With new leadership installed and planned co-location within existing Kids&Us sites in central areas, performance is expected to improve in the second half of FY26.
• At 31 March 2026, Logiscool Vietnam operated three schools, with two in Ho Chi Minh City and one in Binh Duong.
Myanmar
Revenue from Education businesses in Myanmar declined 24% YOY to $6.5 million in 6M26 (6M25: $8.6 million), primarily reflecting the IAS 21 translation of MMK-denominated revenues. The Myanmar Education brands (excluding Yangon American) grew 22% YOY in local currency terms, reflecting continued underlying expansion across the portfolio.
At 31 March 2026, deferred revenue from Education businesses in Myanmar, representing cash received in advance of service delivery, was:
• Current: $6.8 million (1 October 2025: $6.7 million, as restated under IAS 21)
• Non-Current: $3.2 million (1 October 2025: $2.2 million, as restated under IAS 21)
Wall Street English Myanmar
• Revenue from Wall Street English Myanmar grew 15% YOY in local currency, while declined 34% YOY in USD to $2.7 million in 6M26 (6M25: $4.1 million) due to the IAS 21 translation.
• Student enrolment declined 3% from 30 September 2025 to ca.3,200 at 31 March 2026. Price increases, implemented to hedge against market risks, helped offset affordability concerns and increased emigration.
• At 31 March 2026, Wall Street English Myanmar operated five schools with four in Yangon and one in Mandalay.
Kids&Us Myanmar
• Revenue from Kids&Us Myanmar grew 64% YOY in local currency, while declined 5% YOY in USD to $0.4 million in 6M26 (6M25: $0.4 million) due to the IAS 21 translation.
• Student enrolment grew 28% from 30 September 2025 to ca.780 at 31 March 2026. With stabilised leadership in place, the business is on an upward trajectory, supported by robust demand for early childhood English education.
• At 31 March 2026, Kids&Us Myanmar operated four schools in Yangon. One school is currently under construction in Mandalay, and one additional school has been secured and shall open by August 2026.
Logiscool Myanmar
• Revenue from Logiscool Myanmar grew 141% YOY in local currency, the strongest among the Group's franchised businesses, while also grew 39% YOY in USD to $0.5 million in 6M26 (6M25: $0.4 million), as strong enrolment growth outpaced the translation impact under IAS 21.
• Student enrolment grew 29% from 30 September 2025 to ca.1,100 at 31 March 2026, representing the strongest student growth rate among the Group's franchised businesses.
• The commercial success was driven by an experienced commercial team, a strong product offering, and limited competition. One school is under construction, and one more is in the pipeline.
• At 31 March 2026, Logiscool Myanmar operated six schools, with five in Yangon and one in Mandalay. One school is under construction in Yangon, and one additional school has been secured and shall open by August 2026.
Yangon American International School
• Revenue from Yangon American increased 27% YOY to $1.1 million in 6M26 (6M25: $0.9 million), the strongest growth in USD terms across the Group's Myanmar Education businesses.
• Student enrolment grew to ca.200 at 31 March 2026. A key milestone in 6M26 was the opening of the new Bahan campus in January 2026, providing a dedicated Secondary campus in central Yangon.
• Yangon American also achieved IB Middle Years Programme ("MYP") authorisation during the period, making it the only IB Primary Years Programme ("PYP") and MYP authorised school in the Myanmar market. This reinforces its premium positioning and credentialling pathway for students progressing from elementary through to upper secondary.
• Looking ahead, the Group has ambitious plans to expand the Bahan campus to include Early Years and Elementary from the 2026/2027 academic year. Its central location near embassies, UN agencies, and city landmarks enhances accessibility and reinforces Yangon American's premium positioning.
• At 31 March 2026, Yangon American operated two campuses in Yangon: The Hlaing campus (Early Years and Elementary) and the Bahan campus (Secondary only for the 2025-2026 academic year).
Auston
• Revenue from Auston grew 10% YOY in local currency, while declined 37% YOY in USD to $1.8 million in 6M26 (6M25: $2.8 million) due to the translation under IAS 21.
• Student enrolment was ca.830 at 31 March 2026, with a small decline from 860 at 30 September 2025, driven by increased migration and conscription-related uncertainty.
• Auston signed new academic partnership agreements with the University of Wolverhampton in December 2025 and University College Birmingham in February 2026, ensuring continuity and expanded pathways for students.
• Auston is pursuing an ambitious expansion of its Yangon campus facilities. At 31 March 2026, Auston operated campuses in Mandalay and Yangon.
Services
The Group's objective is to become a leading risk management partner for organisations operating in Emerging Asia, focusing on integrated security and facility management services..
Revenue from Services businesses decreased 13% YOY to $3.0 million in 6M26 (6M25: $3.4 million).
At 31 March 2026, deferred revenue from Services businesses, representing cash received in advance of service delivery, was:
• Current: $0.3 million (1 October 2025: $0.3 million, as restated under IAS 21)
• Non-Current: $ Nil (1 October 2025: $ Nil, as restated under IAS 21)
Within its Services division, the Group operates two brands across Myanmar and Vietnam:
EXERA is a leading provider of risk management, consulting, integrated security, manned guarding, secure logistics, and integrated facility management services. It serves a wide range of international and local clients across Myanmar and holds ISO 18788, ISO 9001, ANSI/ASIS PSC.1 certifications, and ICoCA membership. In Vietnam, it is a start-up focused on integrated facility management services.
Ostello Bello is a boutique Italian hostel brand known for its vibrant social atmosphere and exceptional hospitality. Ostello Bello operates a boutique hostel in Bagan, Myanmar.
EXERA Vietnam
• EXERA Vietnam was launched in FY24 to provide integrated facility management ("IFM") services and generated $29k revenue in 6M26 (6M25: $22k). The business remains an early-stage start-up and is exploring strategic partnerships to increase market penetration.
EXERA Myanmar
• Revenue from EXERA Myanmar decreased 13% YOY to $3.0 million in 6M26 (6M25: $3.4 million), reflecting the non-recurrence of a large USD-denominated account, the non-renewal of certain risk reporting contracts as the security situation improved, and ongoing pricing pressure in the market, partially offset by new local client wins, particularly in financial services.
• EXERA Myanmar employed ca.2,280 service personnel as of 31 March 2026 (30 September 2025: ca.1,930) across ca.280 sites in Myanmar (30 September 2025: ca.250 sites).
FINANCIAL REVIEW
Results of Operations
Revenue declined 18% YOY to $13.1 million in 6M26 (6M25: $16.0 million), largely driven by the translation of MMK-denominated revenues at the Market Exchange Rate. Revenues would have increased by 3% if the Reference Exchange Rate had been applied.
$
6M26
6M25
6M24
FY25
FY24
Education - Vietnam
3,619,056
4,012,554
4,183,035
7,720,079
8,229,656
Wall Street English
2,980,763
3,543,518
3,929,484
6,686,568
7,631,372
Kids&Us
561,306
423,819
249,524
923,229
575,519
Logiscool
76,987
45,217
4,027
110,282
22,765
Education - Myanmar
6,511,410
8,572,051
6,741,082
17,250,190
14,441,789
Wall Street English
2,710,645
4,111,979
3,767,997
8,198,732
7,744,204
Kids&Us
367,636
388,733
142,739
854,603
416,064
Logiscool
546,741
394,277
15,922
1,003,583
148,726
Yangon American
1,124,850
884,802
600,891
1,795,032
1,230,966
Auston
1,761,538
2,792,260
2,213,533
5,398,240
4,901,829
Education
10,130,466
12,584,605
10,924,117
24,970,269
22,671,445
Services
EXERA Vietnam
28,940
22,477
-
60,787
3,576
EXERA Myanmar
2,955,152
3,410,225
3,496,937
7,071,011
6,988,643
Ostello Bello
-
-
10,351
-
10,351
Services
2,984,092
3,432,702
3,507,288
7,131,798
7,002,570
Total
13,114,558
16,017,307
14,431,405
32,102,067
29,674,015
Revenue from Education businesses in Myanmar declined 24% YOY to $6.5 million in 6M26 (6M25: $8.6 million), primarily reflecting the IAS 21 translation of MMK-denominated revenues. The Myanmar Education brands (excluding Yangon American) grew 22% YOY in local currency terms, reflecting continued underlying expansion across the portfolio. The reported revenue decline against last year's high base across these businesses reflects a one-off translation effect rather than underlying operational weakness.
The Services division declined in 6M26, reflecting the replacement of large USD-denominated accounts by local Myanmar Kyat-denominated clients and the non-renewal of certain risk reporting contracts as the security situation improved, resulting in a net reduction of contracts amid a price-sensitive market. EXERA Vietnam has begun generating revenue but remains an early-stage start-up.
Group gross profit declined 17% YOY to $7.8 million in 6M26 (6M25: $9.4 million), with the Education division contributing 93% (6M25: 94%) and the Services division 7% (6M25: 6%). The Group's gross profit margin remained stable at 59% (6M25: 59%), supported by an improvement in the Education division's gross margin to 72% (6M25: 70%), whilst being partially offset by a marginal decline in the Services division's gross margin to 17% (6M25: 18%) amid pricing pressure in Myanmar.
The Group's net loss narrowed to $2.2 million in 6M26 (6M25: $3.7 million loss). The improvement was primarily driven by a $0.4 million foreign exchange gain (6M25: $1.3 million loss) and a 13% reduction in administrative and other operating expenses to $9.6 million (6M25: $11.1 million), reflecting ongoing cost optimisation across the Group. These improvements were partially offset by a $0.9 million loss allowance on trade and other receivables relating to the affiliated entity (6M25: nil), following the consolidation and rationalisation of the Group's leased portfolio managed through that entity (see Note 12 of the financial statements).
$
6M26
6M25
6M24
FY25
FY24
Revenue
13,114,558
16,017,307
14,431,405
32,102,067
29,674,015
Cost of services
(5,335,787)
(6,601,338)
(6,107,945)
(13,207,615)
(12,689,487)
Gross profit
7,778,771
9,415,969
8,323,460
18,894,452
16,984,528
Gross profit margin
59%
59%
58%
59%
57%
Other income
40,141
8,708
37,549
57,951
16,495
Foreign exchange gain/(loss)
379,023
(1,267,015)
(584,505)
(2,794,062)
(1,455,135)
Loss allowance on receivables
(937,426)
(9,095)
-
(3,008)
-
Impairment on intangible assets
-
-
-
-
(4,561,645)
Plant & equipment write-off
-
(521,029)
-
(522,237)
-
Administrative & other operating expenses
(8,679,015)
(10,533,868)
(9,722,868)
(20,496,642)
(20,350,864)
Loss from operations
(1,418,506)
(2,906,330)
(1,946,364)
(4,863,546)
(9,366,621)
Finance cost
(780,746)
(711,845)
(617,946)
(1,493,155)
(1,341,391)
Loss before income tax
(2,199,252)
(3,618,175)
(2,564,310)
(6,356,701)
(10,708,012)
Income tax
(35,600)
(62,591)
-
79,821
(245,674)
Loss after income tax
(2,234,852)
(3,680,766)
(2,564,310)
(6,276,880)
(10,953,686)
Selected non-cash items:
Depreciation of P&E
503,357
684,023
580,733
1,301,998
1,207,028
Amortisation of ROU assets
1,231,737
1,316,818
1,402,364
2,683,325
2,786,093
Amortisation of intangibles
39,346
54,660
49,522
102,741
100,718
Plant & equipment write-off
-
521,029
-
522,237
-
Impairment on intangible assets
-
-
-
-
4,561,645
Loss allowance on receivables
937,426
9,095
-
3,008
-
Finance costs (excl lease)
155,779
114,463
94,550
224,802
220,416
Interest on lease liabilities
624,967
597,382
523,396
1,268,353
1,120,975
Total non-cash items
3,492,612
3,297,470
2,650,565
6,106,464
9,996,875
Adjusted EBITDA*
1,293,360
(320,705)
86,255
(250,237)
(711,137)
Adjusted EBITDA after impact of ROUs*
(563,344)
(2,234,905)
(1,839,505)
(4,201,915)
(4,618,205)
* Key performance indicators for the Group, based on earnings before interest, income tax, depreciation and amortisation ("EBITDA"), are (i) Adjusted EBITDA (as presented above) and (ii) Adjusted EBITDA less amortisation of right-of-use assets and interest on lease liabilities ("Adjusted EBITDA after impact of ROUs").
Group adjusted EBITDA turned positive at $1.3 million in 6M26 (6M25: $0.3 million loss), a significant milestone for the Group, driven by improved operating performance across the Education division and cost reduction initiatives. Marketing expenses, which consist predominantly of USD-denominated digital spend, decreased 18% YOY to $1.4 million (6M25: $1.7 million), reflecting improved spending discipline and more targeted campaigns.
Adjusted net losses, excluding the $0.9 million loss allowance on trade and other receivables relating to the affiliated entity, were $1.3 million in 6M26 (6M25: $3.2 million adjusted loss, excluding the plant and equipment write-off). The narrowing of adjusted net losses reflects the increasing maturity of the Group's new businesses and ongoing cost optimisation at Wall Street English Vietnam.
Cash Flow Evolution
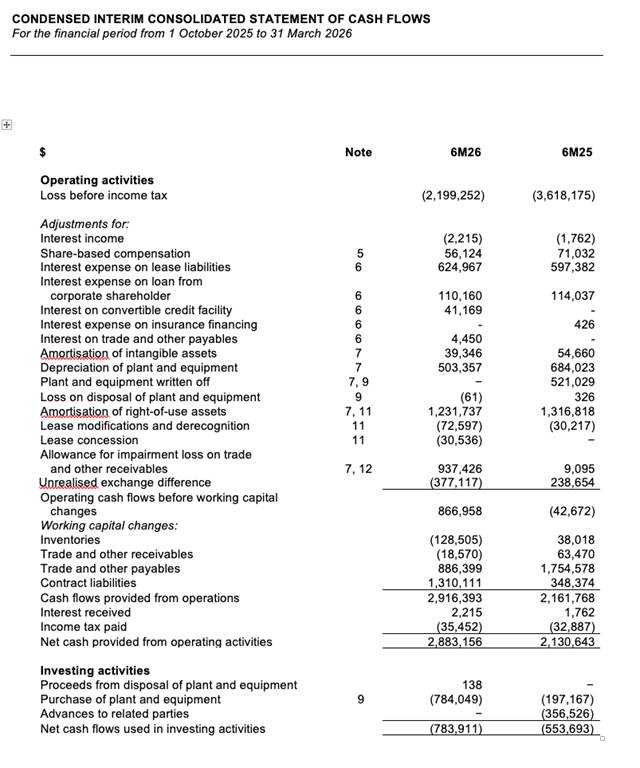
At 31 March 2026, the Group's cash and cash equivalents position was $1.2 million (1 October 2025: $1.2 million, as restated under the IAS 21). The position resulted from the combination of (i) a $2.9 million inflow from operating activities, (ii) a $0.8 million outflow from investing activities, and (iii) a $2.1 million outflow from financing activities.
The Group generated cash inflow from operating activities of $2.9 million in 6M26 (6M25: inflow $2.1 million). Operating cash flow before working capital changes in 6M26 was positive $0.9 million (6M25: negative $43,000). If repayment of lease liabilities of $1.9 million (6M25: $1.8 million) were considered, adjusted cash inflow from operating activities would be positive $1.0 million (6M25: positive $0.3 million).
The Group incurred cash outflow from investing activities of $0.8 million in 6M26 (6M25: $0.6 million), of which $0.8 million (6M25: $0.2 million) was spent on capital expenditure in plant and equipment, primarily directed towards the opening of new Kids&Us schools in Vietnam and the expansion of the Yangon American Bahan Secondary Campus and Auston Yangon campus in Myanmar.
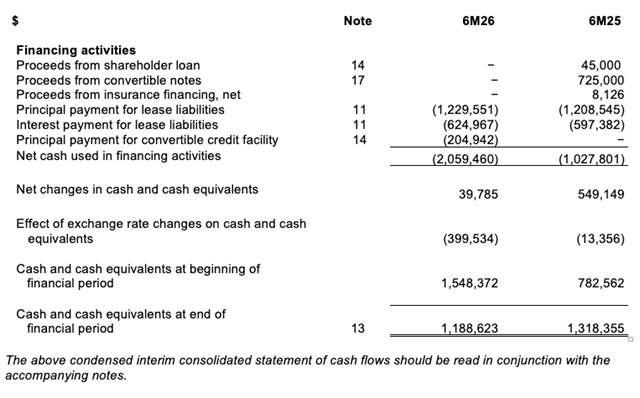
Cash outflow from financing activities amounted to $2.1 million in 6M26 (6M25: $1.0 million) for the repayments of (i) lease liabilities, totalled $1.9 million (6M25: $1.8 million) and convertible credit facility $0.2 million (6M25: $ Nil). There were no new shareholder loan drawdowns or convertible note proceeds in 6M26 (6M25: $45,000 shareholder loan and $0.7 million convertible notes).
Dividends
The Board of Directors does not recommend paying dividends for 6M26 as the Group needs to conserve cash for working capital and future expansion.
Liquidity Management And Going Concern
The Board of Directors has carried out a detailed review of the Group's cash flow forecast and specifically considered a going concern review period of twelve months from the date of this report.
The Board of Directors determined management has control over sufficient mitigating actions to manage cash outflow, including:
• Monitoring and adjusting any Myanmar business expansion against the political and economic environment. The Myanmar businesses have been expanding and are self-sustaining since FY23, with any capital expenditures funded through excess capital earned locally;
• Leveraging the negative cash conversion cycle, as tuition fees and certain risk management services are generally collected up to twelve months in advance of service delivery;
• Support by franchise partners through flexible payment plans in relation to franchise fees and didactic materials;
• Accessing the unutilised Loan Facility as disclosed in the financial statements.
At the date of this report, the Directors have concluded that the Group has adequate financial resources to cover its working capital needs for at least the next twelve months.
OUTLOOK
Asia Strategic Holdings is committed to leveraging its integrated operating model and in-house shared service functions to deliver sustainable returns to shareholders.
Capital Allocation and Strategic Focus
The Group maintains a disciplined asset-light approach to capital, with the existing businesses financing growth through organic cash flow generation. Expansionary capital expenditures are approached carefully, ensuring that multi-brand locations are privileged to maximise the economies of scale. Any expansion into new geographies and/or sectors would leverage the strength of the Group's shared service function.
Continued Development of Existing Brands
Turning around Wall Street English Vietnam remains a top priority, with efforts focused on operational maturity, cost rightsizing, and commercial recalibration. In Myanmar, the Group's newer brands (e.g. Kids&Us and Logiscool) have already established market-leading positions and are well positioned for continued expansion, with two schools under construction and three more in the pipeline.
The Group is also actively enhancing the programmes at Auston and Yangon American, ensuring students receive the best-in-class education. Auston's new university partnerships with the University of Wolverhampton and University College Birmingham, and Yangon American's new Bahan campus, strengthen both institutions' competitive edge.
Navigating Macroeconomic Conditions
The Group expects the operating environment to remain complex but manageable. In Myanmar, the completion of the general election and the formation of a new government provide a degree of political clarity, though structural economic challenges persist. The Group continues to actively manage its cost base to protect margins. In Vietnam, the macroeconomic fundamentals remain supportive, with strong GDP growth, rising education demand, and a consolidating competitive landscape that favours established operators. The Group is well-positioned to capitalise on these dynamics.


NOTES TO THE CONDENSED INTERIM CONSOLIDATED FINANCIAL STATEMENTSFor the financial period from 1 October 2025 to 31 March 2026
1 CORPORATE INFORMATION
Asia Strategic Holdings Limited (the "Company" or "Asia Strategic") (Registration Number 201302159D) is a public company limited by shares incorporated and domiciled in Singapore with its principal place of business and registered office at 80 Raffles Place #32-01, UOB Plaza, Singapore 048624. The Company's ordinary shares are traded on the Main Market of the London Stock Exchange under the equity ticker ASIA.
The consolidated financial statements of the Group and the statement of financial position of the Company are presented in United States dollar ("US$" or "$") which is the functional currency of the Company and the presentation currency for the consolidated financial statements.
The condensed interim consolidated financial statements as at and for the six-month financial period ended 31 March 2026 comprise the Company and its subsidiaries (collectively, the "Group").
For management purposes, the Group is organised into business units based on its services, and has three reportable operating segments as follows:
a) Education - Operation of education businesses ranging from early years to tertiary education and including vocational training, consultancy, advisory and project management services in the education sector in Vietnam and Myanmar;
b) Services - Provision of integrated services, consultancy, advisory and project management services in the security, facility management and hospitality sectors in Vietnam and Myanmar. This reportable segment has been formed by aggregating the relevant operating entities, which are regarded by management to exhibit similar economic characteristics; and
c) Corporate - Corporate services, management support and certain shared services to subsidiaries of the Group.
These operating segments are reported in a manner consistent with internal reporting provided to the chief operating decision-maker responsible for allocating resources and assessing the performance of the operating segments.
1.1 BASIS OF PREPARATION
The condensed interim consolidated statement of financial position as at 31 March 2026 and the related condensed interim consolidated statement of other comprehensive income, condensed interim consolidated statement of changes in equity and condensed interim consolidated statement of cash flows for the six-month financial period ended 31 March 2026 and the explanatory notes have not been audited or reviewed by the Group's Independent Auditors. The condensed interim consolidated financial statements for the financial period ended 31 March 2026 have been prepared in accordance with International Accounting Standards ("IAS") 34 Interim Financial Reporting as adopted by the European Union.
The condensed consolidated interim financial statements do not include all disclosures that would otherwise be required in a complete set of financial statements and should be read in conjunction with the annual report for the financial year ended 30 September 2025. However, selected explanatory notes are included to explain events and transactions that are significant to understanding the changes in the Group's financial position and performance since the last annual financial statements for the financial year ended 30 September 2025, which can be found on the Company's website at www.asia-strategic.com.
The consolidated financial statements of the Group are presented in United States dollars ("$"), which is the presentation currency for the consolidated financial statements.
2 MATERIAL ACCOUNTING POLICIES
The accounting policies adopted are consistent with those of the previous financial year which were prepared in accordance with International Financial Reporting Standards ("IFRS") as adopted by the European Union, except for the adoption of new and amended standards as set out below.
Changes in accounting policy
On 1 October 2025, the Group adopted the new or amended IFRS and interpretations to IFRS that are mandatory for application for the financial year. The adoption of these standards did not result in significant changes to the Group's accounting policies and had no material impact to the Group's financial statements, except as detailed below:
Amendments to IAS 21: Lack of Exchangeability
The amendments to IAS 21, effective for the Group from 1 October 2025, set out how an entity assesses whether a currency is exchangeable and how it estimates a spot exchange rate when it is not, and requires disclosure of the nature and financial effects of the exchangeability issue, the spot rate applied, the estimation approach, and the carrying amount of items exposed.
Since its inception, the Group has developed significant operations in Myanmar. Since February 2021, the Central Bank of Myanmar ("CBM") has maintained administrative controls over foreign currency transactions, including restrictions on the conversion of the Myanmar Kyat ("MMK") and on the transfer of funds. The Group has therefore concluded that the MMK is not freely exchangeable into USD, its presentation currency, within a reasonable time frame at the reporting date.
Exposure arises from (i) monetary items held in a non-functional currency within Myanmar subsidiaries, whose remeasurement affects profit or loss, and (ii) the translation of MMK functional subsidiaries into the Group's USD presentation currency, whose effect is recognised in the foreign currency translation reserve.
As the CBM reference rate is not reasonably accessible, the Group has estimated the spot rates using the Market Trading Rate ("MTR"), applied without adjustment. The MTR, is a weighted average of interbank and bank-customer trades executed by authorised dealers, and is published daily by the CBM. The MTR is considered an appropriate basis because it is market-driven, reflects prevailing supply and demand, and is accessible to market participants, and represents the rate at which an orderly exchange transaction would take place at the measurement date between market participants under prevailing economic conditions.
Estimation of the spot rate involves significant judgement. In reaching this conclusion, the Group also considered rates observable in active cross-border markets, rates on the Group's own recent arm's length transactions, and published indices and observable data. The daily spot rates applied during 6M26 ranged from MMK 3,600 to MMK 3,650 per USD. Changes in the underlying assumptions could materially affect the translation of monetary items and the results of the Myanmar operations.
Effect of Transition
In accordance with the transitional provisions, comparatives have not been restated. The cumulative effect of applying the amendments has been recognised at 1 October 2025 as adjustments to:
(a) opening accumulated losses: exchange differences arising on the remeasurement of foreign currency monetary items in the underlying records of the Myanmar subsidiaries; and
(b) foreign currency translation reserve: exchange differences arising from the translation of financial performance and financial position of foreign operations whose functional currency is MMK into the Group's USD presentation currency.
The carrying amount of items exposed and the transition effect are summarised below.
Group
$
1 Oct 2025,
as previously reported
Effect of
IAS 21 transition
1 Oct 2025,
as restated
under IAS 21
Assets
Plant and equipment
2,910,672
(594,232)
2,316,440
Intangible assets
1,974,736
(57,859)
1,916,877
Right-of-use assets
16,040,875
(3,719,383)
12,321,492
Trade and other receivables
3,310,080
(1,363,362)
1,946,718
Non-current assets
24,236,363
(5,734,836)
18,501,527
Inventories
437,715
(57,214)
380,501
Tax recoverable
47,809
(20,215)
27,594
Trade and other receivables
2,401,956
(520,672)
1,881,284
Cash and cash equivalents
1,548,372
(396,884)
1,151,488
Current assets
4,435,852
(994,985)
3,440,867
Total assets
28,672,215
(6,729,821)
21,942,394
Liabilities
Contract liabilities
4,399,689
(1,561,200)
2,838,489
Lease liabilities
15,422,395
(4,894,041)
10,528,354
Borrowings
4,225,975
-
4,225,975
Non-current liabilities
24,048,059
(6,455,241)
17,592,818
Contract liabilities
14,480,878
(4,069,461)
10,411,417
Trade and other payables
8,158,155
(1,246,919)
6,911,236
Lease liabilities
2,523,814
(434,980)
2,088,834
Current liabilities
25,162,847
(5,751,360)
19,411,487
Share capital
21,919,638
-
21,919,638
Accumulated losses
(50,775,107)
4,714,330
(46,060,777)
Reserve
8,316,778
762,450
9,079,228
Equity
(20,538,691)
5,476,780
(15,061,911)
28,672,215
6,729,821
21,942,394
The foreign exchange regime in Myanmar remains fluid. The Group will reassess exchangeability and the estimated spot rate at each reporting date. Changes in regulations, approval processes or market conditions may have a material impact on the Group's financial statements in future periods.
Foreign currency risks and sensitivity analysis
Foreign exchange risk arises when individual entities within the Group enters into transactions denominated in a currency other than their functional currency. The currency that gives rise to material risk for the Group is primarily the MMK. The Group has not entered into any currency forward exchange contracts as at the end of the reporting period.
The following table sets out the Group's sensitivity to a 20 per cent (30 Sep 2025: 20 per cent) change in the MMK against the USD, reflecting the limited observable liquidity in the MMK/USD market and the potential divergence between the MTR applied by the Group and alternative rate sources available to market participants. The analysis assumes an instantaneous change in the exchange rate at the reporting date, with all other variables held constant.
Gain/(Loss)
before tax
$
31 Mar 2026
30 Sep 2025
$
Myanmar Kyat
Strengthen against United States Dollar
382,000
293,000
Weaken against United States Dollar
(382,000)
(293,000)
IFRSs issued but not yet effective
Certain new accounting standards and interpretations have been issued but are not yet effective for the current financial year ending 30 September 2026 and have not been adopted early by the Group. The Group expects that the adoption of these IFRSs, if applicable, will have no material impact on the financial statements in the period of initial application except for the IFRS 18 Presentation and Disclosure in Financial Statements as disclosed in the last annual report for the financial year ended 30 September 2025.
3 USE OF JUDGEMENTS AND ESTIMATES
In preparing the condensed interim financial statements, management has made judgments, estimates and assumptions that affect the application of accounting policies and the reported amounts of assets and liabilities, income and expenses. These estimates are based on management's best knowledge of current events and market environment in the respective countries the Group operates as at the reporting date. Actual results may differ from these estimates. Estimates and underlying assumptions are reviewed on an ongoing basis. Revisions to accounting estimates are recognised in the period in which the estimates are revised and in any future periods affected.
The significant judgments made by management in applying the Group's accounting policies and the key sources for estimating uncertainty were the same as those that applied to the consolidated financial statements as at and for the financial year ended 30 September 2025, except as disclosed in Note 2 to the financial statements.
3.1 SEASONAL OPERATIONS
The Group's businesses were not affected significantly by seasonal or cyclical factors during the financial period ended 31 March 2026.
The timing of revenue recognition would affect the amount of revenue and deferred revenue recognised as at the reporting date in the condensed consolidated statement of financial position.
$
31 Mar 2026
30 Sep 2025
Contract liabilities
Current
10,746,043
14,480,878
Non-current
3,813,974
4,399,689
14,560,017
18,880,567
Significant changes in contract liabilities are as detailed below:
$
6M26
FY25
At 1 October 2025, as previously reported
18,880,567
14,424,989
Effect of transition to IAS 21
(5,630,661)
-
As at 1 October 2025, as restated
13,249,906
14,424,989
Cash received in advance of performance
and not recognised as revenue
11,787,645
30,357,376
Revenue recognised during the financial
period/year:
- On contract liabilities at beginning of financial period/year
(7,290,450)
(11,643,390)
- On cash received in advance during financial period/year
(3,165,563)
(13,957,360)
(10,456,013)
(25,600,750)
Foreign exchange difference
(21,521)
(301,048)
At end of financial period/year
14,560,017
18,880,567
Remaining performance obligations
Deferred revenue is in respect of cash received in advance of performance, which will be recognised based on the following:
(i) Tuition fees: collected 1 to 12 months (30 Sep 2025: same), and more than 12 months for certain students who prepaid in advance of course period with reference to the individual terms of the student contracts.
(ii) Security risk management services: generally collected 6 to 24 months (30 Sep 2025: same) in advance of risk management services to the customer.
6M26
$
Education
Services
Corporate
Total
Revenue
10,130,466
2,984,092
-
13,114,558
Cost of services
(2,864,630)
(2,471,157)
-
(5,335,787)
Gross profit
7,265,836
512,935
-
7,778,771
Other income
4,363
744
35,034
40,141
Foreign exchange gain, net
349,030
27,643
2,350
379,023
Administrative and other operating expenses
(7,227,438)
(856,395)
(1,532,608)
(9,616,441)
Loss from operations
391,791
(315,073)
(1,495,224)
(1,418,506)
Finance cost
(667,162)
(3,424)
(110,160)
(780,746)
Segment loss
(275,371)
(318,497)
(1,605,384)
(2,199,252)
Income tax expense
(35,600)
-
-
(35,600)
Loss after income tax
(310,971)
(318,497)
(1,605,384)
(2,234,852)
Other non-cash items:
Total depreciation of plant and equipment
461,556
41,618
183
503,357
Total amortisation of right-of-use asset
1,203,242
28,495
-
1,231,737
Total amortisation of intangible assets
39,346
-
-
39,346
Loss allowance on trade and other receivables
883,379
54,047
-
937,426
Finance costs (excluding interest on lease liabilities)
45,619
-
110,160
155,779
Total interest on lease liabilities
621,543
3,424
-
624,967
3,254,685
127,584
110,343
3,492,612
Adjusted EBITDA
2,979,314
(190,913)
(1,495,041)
1,293,360
Adjusted EBITDA after
impact of ROU
1,154,529
(222,832)
(1,495,041)
(563,344)
Reportable segment assets
as at 31 March 2026
17,008,807
3,223,134
245,233
20,477,174
Total Group's assets
Included in the segment assets:
Additions:
Plant and equipment
773,320
10,729
-
784,049
Right-of-use assets
608,384
-
-
608,384
Reportable segment liabilities as at 31 March 2026
(32,043,607)
(1,023,737)
(5,032,422)
(38,099,766)
6M25
$
Education
Services
Corporate
Total
Revenue
12,584,605
3,432,702
-
16,017,307
Cost of services
(3,777,289)
(2,824,049)
-
(6,601,338)
Gross profit
8,807,316
608,653
-
9,415,969
Other income
7,532
565
611
8,708
Foreign exchange loss, net
(1,190,361)
(67,847)
(8,807)
(1,267,015)
Administrative and other operating expenses
(8,756,407)
(938,967)
(1,368,618)
(11,063,992)
Loss from operations
(1,131,920)
(397,596)
(1,376,814)
(2,906,330)
Finance cost
(588,468)
(8,920)
(114,457)
(711,845)
Segment loss
(1,720,388)
(406,516)
(1,491,271)
(3,618,175)
Income tax expense
(76,802)
14,211
-
(62,591)
Loss after income tax
(1,797,190)
(392,305)
(1,491,271)
(3,680,766)
Other non-cash items:
Total depreciation of plant and equipment
639,805
44,127
91
684,023
Plant and equipment
written off
521,029
-
-
521,029
Total amortisation of right-of-use asset
1,270,855
45,963
-
1,316,818
Total amortisation of intangible assets
54,660
-
-
54,660
Impairment loss on other receivables
9,095
-
-
9,095
Finance costs (excluding interest on lease liabilities)
-
-
114,463
114,463
Total interest on lease liabilities
588,462
8,920
-
597,382
3,083,906
99,010
114,554
3,297,470
Adjusted EBITDA
1,363,518
(307,506)
(1,376,717)
(320,705)
Adjusted EBITDA after
impact of ROU
(495,799)
(362,389)
(1,376,717)
(2,234,905)
Reportable segment assets
as at 31 March 2025
Total Group's assets
18,122,741
4,168,955
85,130
22,376,826
Included in the segment assets:
Additions:
Plant and equipment
186,819
9,253
1,095
197,167
Right-of-use assets
92,132
-
-
92,132
Reportable segment liabilities as at
31 March 2025
(34,631,683)
(1,202,378)
(4,641,031)
(40,475,092)
Geographic information
The Group operates in three main geographical areas. Revenue is based on the country in which the customers are located and services were delivered. Segment non-current assets consist primarily of non-current assets other than financial instruments and deferred tax assets. Segment non-current assets are shown by geographic area in which the assets are located.
Revenue
Non-current assets
$
6M26
6M25
31 Mar
2026
30 Sep 2025
Singapore
11,194
19,352
14,139
15,821
Vietnam
3,647,996
4,035,031
4,266,524
4,781,647
Myanmar
9,455,368
11,962,924
11,562,290
16,128,815
13,114,558
16,017,307
15,842,953
20,926,283
Non-current assets consist of plant and equipment, intangible assets and right-of-use assets in the Group's condensed consolidated statement of financial position.
5 EMPLOYEE BENEFIT EXPENSES
$
6M26
6M25
Wages, salaries and allowances*
6,710,282
8,483,424
Share-based compensation*
56,124
71,032
Staff insurance and medical expenses
146,258
124,866
Staff accommodation and welfare
256,742
210,257
Termination benefits
13,164
23,846
Others
54,537
130,590
7,237,107
9,044,015
Total employee benefit expenses:
- Cost of services
3,318,397
4,240,883
- Administrative and other operating expenses
3,918,710
4,803,132
7,237,107
9,044,015
* Included in these expenses are Director fees and remuneration.
6 FINANCE COST
$
6M26
6M25
Interest expenses:
- Shareholder loan (Note 14)
110,160
114,037
- Lease liabilities
624,967
597,382
- Interest on convertible credit facility
41,169
-
- Others
4,450
426
780,746
711,845
7 LOSS BEFORE INCOME TAX
Depreciation and amortisation expenses relating to plant and equipment, right-of-use assets and intangible assets directly attributable to provision of services and for operating activities are included in the "cost of services" and "administrative and other operating expenses", respectively in the condensed consolidated statement of comprehensive income.
In addition to the charges and credits disclosed elsewhere in the financial statements, the loss before income tax includes the following charges/(credits):
$
6M26
6M25
Cost of services
Academic expenses
700,054
1,141,580
Student enrolment and support fees
670,205
696,717
Expenses relating to student instalment plans
111,080
66,396
Security service expenses
269,232
281,443
Hotel related operating expenses
142,749
-
Depreciation expense
41,653
69,702
Amortisation of intangible assets
-
1,573
Administrative and other operating expenses:
Selling and marketing expenses
1,356,686
1,651,448
Professional fees
500,545
380,230
Travelling and transportation expenses
184,449
185,147
Amortisation of right-of-use assets
1,231,737
1,316,818
Amortisation of intangible assets
39,346
53,087
Depreciation expense
461,704
614,321
Impairment loss on trade and other
receivables (Note 12)
937,426
-
Plant and equipment written off (Note 9)
-
521,029
8 INCOME TAX EXPENSE
The corporate income tax rate applicable to the Company and its subsidiaries in Singapore is 17% (6M25: 17%). The Group has significant operations in Myanmar and Vietnam, for which the applicable corporate income tax rates are 22% (6M25: 22%) and 20% (6M25: 20%), respectively.
Income tax expense of $35,600 (6M25: $62,591) are mainly from profitable Education businesses. Other subsidiaries of the Group with operating losses have no chargeable income and/or unutilised tax losses for set-off.
9. PLANT AND EQUIPMENT
$
Leasehold improvements
Furniture
and fittings
Computers
and books
Motor
vehicles
Construction-
in-progress
Total
Cost
At 1 October 2025, as previously reported
3,958,846
1,427,265
1,390,494
61,769
35,328
6,873,702
Effect of transition to IAS 21
(635,473)
(239,496)
(252,689)
(17,026)
(1,001)
(1,145,685)
As at 1 October 2025, as restated
3,323,373
1,187,769
1,137,805
44,743
34,327
5,728,017
Additions
466,451
119,330
64,859
-
133,409
784,049
Transfers
37,573
1,887
-
-
(39,460)
-
Write-off
-
(2,578)
-
-
-
(2,578)
Foreign exchange difference
400
(217)
(628)
(42)
(74)
(561)
At 31 March 2026
3,827,797
1,306,191
1,202,036
44,701
128,202
6,508,927
Accumulated depreciation
At 1 October 2025, as previously reported
1,968,452
937,622
1,018,599
38,357
-
3,963,030
Effect of transition to IAS 21
(237,164)
(136,048)
(165,302)
(12,939)
-
(551,453)
As at 1 October 2025, as restated
1,731,288
801,574
853,297
25,418
-
3,411,577
Depreciation for the year
307,688
97,995
94,874
2,800
-
503,357
Write-off
-
(2,501)
-
-
-
(2,501)
Foreign exchange difference
552
13
(391)
(66)
-
108
At 31 March 2026
2,039,528
897,081
947,780
28,152
-
3,912,541
Net carrying amount
At 31 March 2026
1,788,269
409,110
254,256
16,549
128,202
2,596,386
$
Leasehold improvements
Furniture
and fittings
Computers
and books
Motor
vehicles
Construction-
in-progress
Total
Cost
At 1 October 2024
4,312,885
1,423,845
1,353,564
63,253
56,709
7,210,256
Additions
452,860
144,936
58,003
-
54,231
710,030
Transfers
72,667
-
-
-
(72,667)
-
Disposals
-
(12,231)
(1,870)
-
-
(14,101)
Write-off
(781,416)
(100,490)
(661)
-
-
(882,567)
Foreign exchange difference
(98,150)
(28,795)
(18,542)
(1,484)
(2,945)
(149,916)
At 30 September 2025
3,958,846
1,427,265
1,390,494
61,769
35,328
6,873,702
Accumulated depreciation
At 1 October 2024
1,621,001
706,562
737,917
31,590
-
3,097,070
Depreciation for the year
704,729
297,487
292,655
7,127
-
1,301,998
Disposals
-
(7,731)
(1,545)
-
-
(9,276)
Write-off
(318,394)
(41,532)
(404)
-
-
(360,330)
Foreign exchange difference
(38,884)
(17,164)
(10,024)
(360)
-
(66,432)
At 30 September 2025
1,968,452
937,622
1,018,599
38,357
-
3,963,030
Net carrying amount
At 30 September 2025
1,990,394
489,643
371,895
23,412
35,328
2,910,672
10 INTANGIBLE ASSETSThe carrying amounts of significant intangible assets allocated to the respective cash-generating units ("CGU") have been grouped into the following segments:
Education
Services
Vietnam
Myanmar
Myanmar
$
31 Mar 2026
30 Sep 2025
31 Mar 2026
30 Sep 2025
31 Mar 2026
30 Sep 2025
Goodwill
−
−
−
−
1,438,990
1,438,990
Area development and opening fees
337,875
365,652
89,588
155,094
−
−
As of the reporting date, there are no new additions to intangible assets. Amortisation was $39,346 for 6M26 vs $54,660 for 6M25.
11 LEASES
(a) Right-of-use assets ("ROU")
$
International school
Offices and schools
Total
At 1 October 2025, as previously reported
3,643,808
12,397,067
16,040,875
Effect of transition to IAS 21
-
(3,719,383)
(3,719,383)
At 1 October 2025, as restated
3,643,808
8,677,684
12,321,492
Additions
-
608,384
608,384
Amortisation charge
(248,193)
(983,544)
(1,231,737)
Lease modification and derecognition
-
(318,139)
(318,139)
Foreign exchange difference
-
(11,886)
(11,886)
At 31 March 2026
3,395,615
7,972,499
11,368,114
At 1 October 2024
861,096
10,606,234
11,467,330
Additions
3,036,201
4,965,630
8,001,831
Amortisation charge
(253,489)
(2,429,836)
(2,683,325)
Lease modification
-
(414,027)
(414,027)
Foreign exchange difference
-
(330,934)
(330,934)
At 30 September 2025
3,643,808
12,397,067
16,040,875
(b) Lease liabilities
$
International school
Offices and schools
Total
At 1 October 2025, as previously reported
4,108,983
13,837,226
17,946,209
Effect of transition to IAS 21
(1,343,717)
(3,985,304)
(5,329,021)
At 1 October 2025, as restated
2,765,266
9,851,922
12,617,188
Additions
-
608,384
608,384
Interest expense (Note 6)
149,550
475,417
624,967
Lease modification and derecognition
-
(390,736)
(390,736)
Lease concession
-
(30,536)
(30,536)
Lease payments in cash:
- Principal portion
(297,739)
(931,812)
(1,229,551)
- Interest portion
(149,550)
(475,417)
(624,967)
Foreign exchange differences
(6,543)
(2,904)
(9,447)
At 31 March 2026
2,460,984
9,104,318
11,565,302
$
International school
Offices and schools
Total
At 1 October 2024
1,238,210
11,520,113
12,758,323
Additions
3,036,201
4,965,630
8,001,831
Interest expense (Note 6)
164,094
1,104,259
1,268,353
Lease modification and derecognition
-
(433,873)
(433,873)
Lease concession
-
(39,899)
(39,899)
Lease payments in cash
- Principal portion
(165,428)
(1,791,244)
(1,956,672)
- Interest portion
(164,094)
(1,104,259)
(1,268,353)
Foreign exchange differences
-
(383,501)
(383,501)
At 30 September 2025
4,108,983
13,837,226
17,946,209
$
31 Mar 2026
30 Sep 2025
United States Dollar
739,855
924,557
Myanmar Kyat
7,031,817
12,722,769
Vietnamese Dong
3,793,630
4,298,883
11,565,302
17,946,209
(c) Amount recognised in profit or loss
$
6M26
6M25
Amortisation of right-of-use assets
1,231,737
1,316,818
Interest expense on lease liabilities
624,967
597,382
Lease modification and derecognition costs
60,525
(19,846)
Lease expense relating to short-term leases, not capitalised in lease liabilities
47,227
289,172
Total amount recognised in profit or loss
1,964,456
2,183,526
As at 31 March 2026, the net carrying amounts of ROU and lease liabilities arising from lease of offices and schools from an affiliated entity (refers to an entity with a common Director of certain subsidiaries of the Group) amounted to $2,332,023 and $2,483,278 (30 Sep 2025: $4,830,491 and $5,127,196), respectively. These transactions were at terms agreed between the respective parties.
12 TRADE AND OTHER RECEIVABLES
31 Mar 2026
30 Sep 2025
Current
Trade receivables
Third parties, gross
624,668
787,530
Less: Loss allowances
(8,947)
(8,947)
Third parties, net
615,721
778,583
Accrued receivables
154,884
82,795
Total trade receivables
770,605
861,378
Other receivables:
Deposits
33,660
49,413
Prepayments for enrolment expenses
439,292
505,938
Other prepayments
661,975
977,722
Sales tax
26,594
7,505
Total other receivables
1,161,521
1,540,578
Total trade and other receivables (current)
1,932,126
2,401,956
Non-current
Affiliated company (Non-trade)
3,788,319
6,757,126
Less: Loss allowances
(3,472,729)
(4,400,124)
315,590
2,357,002
Rental deposits
661,430
915,280
Prepayments for enrolment expenses
-
37,798
Total trade and other receivables (non-current)
977,020
3,310,080
Total trade and other receivables
2,909,146
5,712,036
Less: Prepayments
(1,101,267)
(1,521,458)
Less: Sales tax
(26,594)
(7,505)
1,781,285
4,183,073
Add: Cash and cash equivalents
(Note 13)1,188,623
1,548,372
Financial assets at amortised cost
2,969,908
5,731,445
Trade and other receivables
Trade receivables are non−interest bearing and are generally on 15 to 90 (30 Sep 2025: same) days credit terms. They are measured at their original invoice amount, which represent their fair value on initial recognition.
The non-current amount due from affiliated entity is unsecured and interest free, and it is not expected to be repaid within the next twelve months.
Expected credit loss allowances
i) Trade receivables - Third party
Loss allowance were made for third-party trade debtors determined to be credit-impaired as the likelihood of recovery is remote.
ii) Non-current receivables - Affiliated entity
For the purpose of these financial statements, an affiliated entity refers to an entity that shares a common director with certain subsidiaries of the Group, where that director also holds a beneficial interest in the affiliated entity.
The non-current receivable due from the affiliated entity relates to payments made by the Group on behalf of the affiliated entity and advances extended to fund the managed operations of Wall Street English and Auston in Myanmar. The outstanding balance is not expected to be recovered within twelve months from the reporting date and has accordingly been classified as non-current.
Expected credit loss assessment for trade and other receivables due from an affiliated entity
Movement in the loss allowance for trade and other receivables are as follows:
$
31 Mar 2026
30 Sep 2025
At 1 October 2025, as previously reported
4,400,124
4,400,124
Effect of transition to IAS 21
(1,850,581)
-
At 1 October 2025, as restated
2,549,543
4,400,124
Loss allowance for the period/year
937,426
-
Foreign exchange differences
(14,240)
-
At 31 March 2026/
30 September 2025
3,472,729
4,400,124
The loss allowance has been measured at lifetime expected credit losses, reflecting the Board of Directors' assessment that credit risk on this balance has increased significantly since initial recognition. In arriving at this assessment, the Board of Directors considered the affiliated entity's past and current financial performance, projected cash flows and any indicators of default on external debt obligations, assessed at each reporting date.
Loss allowances of $4,400,124 (30 Sep 2025: same) were recognised in prior financial years on the above balance, determined based on a review of the affiliated entity's financial information and the expected recoverability of the outstanding balance through property management services rendered by the affiliated entity to the Group at cost plus a mark-up (Note 11). Due to the reduction in portfolio of properties under management, this resulted in an additional loss allowance of $937,426 (6M25: Nil) on the amount due from affiliated entity.
The Group's trade and other receivables balances (excluding prepayments and sales tax) are denominated in the following currencies:
$
31 Mar 2026
30 Sep 2025
United States Dollar
326,988
1,288,787
Vietnamese Dong
334,158
421,341
Singapore dollar
5,719
-
Myanmar Kyat
1,114,420
2,472,945
1,781,285
4,183,073
13 CASH AND CASH EQUIVALENTS
$
31 Mar 2026
30 Sep 2025
Cash at bank
983,490
1,204,805
Cash with financial institutions
13,675
4,561
Cash on hand
191,458
339,006
Cash and cash equivalents
1,188,623
1,548,372
Cash at bank earns interest at floating rates based on daily bank deposit rates. Cash and cash equivalents are denominated in the following currencies:
$
31 Mar 2026
30 Sep 2025
United States Dollar
309,166
458,072
Vietnamese Dong
145,879
101,027
Myanmar Kyat
655,720
938,633
Singapore Dollar
77,428
50,181
Euro
430
459
1,188,623
1,548,372
14 BORROWINGS (UNSECURED)
The changes in shareholder loan balances and convertible credit facility (principal and interest) arising from financing activities are listed below:
Non-cash changes
$
1 Oct 2025
Trade payables transferred
(Note 15)
Interest
Expense
(Note 6)
Exchange Differences
Payments
31 Mar 2026
6M26
Shareholder loan
4,225,975
-
110,160
-
-
4,336,135
Convertible credit
facility
-
2,333,996
41,169
774
(419,595)
1,956,344
4,225,975
2,333,996
151,329
774
(419,595)
6,292,479
* Includes cash and non-cash payment of $204,942 and $214,653 respectively.
Non-cash changes
FY25
1 Oct 2024
Drawdown
of loan
Subscription of convertible notes
(Note 17)
Interest
Expense
(Note 6)
Exchange differences
30 Sep 2025
Shareholder loan
4,756,173
45,000
(800,000)
224,802
-
4,225,975
Convertible credit facility
On 1 October 2025, outstanding trade balances totalling $2,333,996 were reorganised into a convertible credit facility maturing on 30 September 2027. The facility bears interest at 4% per annum.
At maturity and at the vendor's discretion, a portion or the full outstanding balance (principal and accrued interest) may be settled in cash, in a variable number of shares of a subsidiary, or a combination thereof.
The facility is classified as a financial liability measured at amortised cost using the effective interest method in accordance with IFRS 9. The fair value of the facility at the reporting date approximates its carrying amount.
Shareholder loan
The loan is repayable on 10 days notice and matures no later than 31 December 2027 and bears interest at 6% per annum. As at the date of approval of the financial statements, the Group has a remaining unutilised loan facility of $818,000 (loan facility of $4,500,000).
As at reporting date, MACAN has provided a written undertaking not to demand repayment of the shareholder loan within twelve months. At the date of approval of the financial statements, the Group has a remaining unutilised loan facility of $818,000.
15 TRADE AND OTHER PAYABLES
$
31 Mar 2026
30 Sep 2025
Trade payables
Third parties
881,728
2,980,479
Accrued enrolment expenses
674,287
393,885
Total trade payables
1,556,015
3,374,364
Other payables
Third parties
1,157,694
1,118,225
Accruals - others
1,600,832
1,737,256
Accruals - wages and salaries
643,987
751,455
Refundable deposits from customers
646,800
1,146,494
Sales tax
76,640
30,361
Total other payables
4,125,953
4,783,791
Total trade and other payables
5,681,968
8,158,155
Less: Sales tax
(76,640)
(30,361)
5,605,328
8,127,794
Add: Lease liabilities
11,565,302
17,946,209
Add: Borrowings (Note 14)
6,292,479
4,225,975
Financial liabilities carried at amortised cost
23,463,109
30,299,978
Trade payables are unsecured and non-interest bearing, except for a balance of $380,000 (30 Sept 2025: $ Nil) which bears interest at 4% per annum. All trade payables are on credit terms of 15 to 90 days (30 Sept 2025: 15 to 90 days).
The non-trade amounts due to third parties are unsecured, interest−free and repayable on demand
Trade and other payables (excluding sales tax) are denominated in the following currencies:
$
31 Mar 2026
30 Sep 2025
United States Dollar
1,863,067
3,356,932
Vietnamese Dong
1,349,525
878,603
Myanmar Kyat
1,413,291
2,620,343
Singapore Dollar
147,149
171,920
Euro
282,110
529,235
Pound Sterling
550,186
570,761
5,605,328
8,127,794
16 SHARE CAPITAL
6M26
FY25
6M26
FY25
# of shares
# of shares
$
$
Issued and fully paid
ordinary shares:
At beginning and end of financial period/year
3,021,920
3,021,920
21,919,638
21,919,638
The holders of ordinary shares are entitled to receive dividends as and when declared by the Company. All ordinary shares have no par value and carry one vote per share without restriction.
The Company declared neither any dividends during 6M26 (6M25: Nil) nor in the preceding financial year ended 30 September 2025.
17 CONVERTIBLE NOTES
$
6M26
FY25
At beginning of financial period/year
7,255,000
5,730,000
Cash
-
725,000
Shareholder loan (Note 14)
-
800,000
At end of financial period/year
7,255,000
7,255,000
The annual financial statements for the financial year ended 30 September 2025, provides the original salient features of the convertible notes. The convertible notes are denominated in United States Dollar.
18 LOSS PER SHARE
The calculation of the basic and diluted loss per share attributable to the ordinary equity holders of the Company is based on the following data:
6M26
6M25
Numerator
Loss for the financial period attributable to the
owners of the parent ($)
(2,234,852)
(3,680,766)
Denominator
Weighted average number of ordinary shares for the purposes of basic and diluted loss per share
3,021,920
3,021,920
Loss per share ($)
Basic and diluted
(0.74)
(1.22)
Diluted loss per share and basic loss per share are the same as neither the exercise of the share option nor the conversion of mandatory convertible notes would result in an increase in the loss per share.
19 FAIR VALUE MEASUREMENT
Financial instruments and measurements
Financial instruments not measured at fair value
Financial instruments not measured at fair value include cash and cash equivalents, current trade and other receivables (excluding advances, prepayments and sales tax), long term rental deposits and trade and other payables. Due to their short−term nature, the carrying amount of these current financial assets and financial liabilities measured at amortised costs approximate their fair values.
The carrying amount of the non−current loan due to a shareholder approximates their fair value as the fixed interest rate approximates market interest rates for such liabilities. The carrying amount of non-current receivables and non-current rental deposits approximates their fair value due to insignificant effects of discounting.
This information is provided by RNS, the news service of the London Stock Exchange. RNS is approved by the Financial Conduct Authority to act as a Primary Information Provider in the United Kingdom. Terms and conditions relating to the use and distribution of this information may apply. For further information, please contact rns@lseg.com or visit www.rns.com.
RNS may use your IP address to confirm compliance with the terms and conditions, to analyse how you engage with the information contained in this communication, and to share such analysis on an anonymised basis with others as part of our commercial services. For further information about how RNS and the London Stock Exchange use the personal data you provide us, please see our Privacy Policy.ENDIR UPURAQUPQPGR