Interim Results
2 June 2026
GOOCH & HOUSEGO PLC
("G&H", the "Company" or the "Group")
Interim Results
Gooch & Housego PLC (AIM: GHH), the specialist manufacturer of optical components and systems, today announces its interim results for the six months ended 31 March 2026 ('H1 2026' or the 'Period').
Key Financials
Period ended 31 March
H1 2026
H1 2025
Change
Revenue
£81.9m
£70.9m
+15.5%
Adjusted profit before tax*
£5.8m
£5.1m
+13.9%
Adjusted basic earnings per share*
16.4p
15.0p
+9.3%
Net debt excluding IFRS 16
£36.6m
£24.1m
+£12.5m
Net debt including IFRS 16
£49.8m
£35.5m
+£14.3m
Statutory profit before tax
£3.3m
£2.9m
+15.8%
Statutory basic earnings per share
9.2p
8.1p
+13.6%
Interim dividend per share
4.9p
4.9p
-
*Adjusted for amortisation of acquired intangible assets and non-recurring items.
Key Highlights
§ Revenue increased by 15.5% to £81.9m, or 9.1% on an organic, constant currency basis.
§ Aerospace & Defence revenue increased by 51.7% to £35.6m (H1 2025: £23.5m), reflecting strong demand, enhanced capabilities and benefits from recent acquisitions.
§ Adjusted operating profit increased by 16.9% to £7.2m, with operating profit margins improving slightly to 8.8% (H1 2025: 8.7%).
§ A&D segment profitability significantly improved to £3.6m, demonstrating the benefits of the Group's strategic focus and operational improvement programme.
§ Order book increased to record £167.3m (Sept 2025: £142.4m), up 16.5% on a constant currency basis, providing near full cover for expected FY2026 revenue.
§ Net debt leverage at 1.5x (Sept 2025: 1.3x). Committed debt facility increased to $70m.
§ Phoenix Optical and Global Photonics integration now largely complete, with capacity expanded supporting customer demand.
§ FY2026 expectations unchanged; Board remains confident in further profitable growth and progress towards mid-teens returns over the medium-term.
Charlie Peppiatt, Chief Executive Officer of Gooch & Housego, commented: "I am pleased with the positive progress that G&H has made in the first half of the financial year. The record order book growth in the period demonstrates the increased confidence our customers have in G&H to provide them with their most complex photonics and optical systems requirements. This enlarged order book gives us stronger forward visibility than we have had historically and reflects the benefits of our strengthened positions in structurally attractive end-markets. We remain focused on converting this demand through disciplined capacity expansion, improved operational execution and continued supply-chain resilience. The strategic actions taken over the last few years, including important speed-to-value acquisitions, have started to translate into improved financial and operational performance, and the Group is well-positioned to meet this increased demand.
"While we continue to navigate the significant macroeconomic uncertainties, the recovery in our Industrial and Semiconductor markets, coupled with record demand from US and European Aerospace and Defence sectors, firmly supports our path to achieving mid-teens returns over the medium term."
Analyst meeting
A meeting for analysts will be held at 9.30 a.m. today at the offices of Burson Buchanan, Rose Court, 2 Southwark Bridge Road, London SE1 9HS. To register attendance, please contact Burson Buchanan at: G&H@buchanan.uk.com.
An audiocast of the presentation will be made available via the Group's website at 9.30am today https://gandh.com/investors/.
For further information please contact:
Gooch and Housego PLC
Charlie Peppiatt, Chief Executive Officer
Tel: +44 (0) 1460 256 440
James Corte, Chief Financial Officer
Burson Buchanan (Financial Communications)
Henry Harrison-Topham / Sophie Wills / Abby Gilchrist
Tel: +44 (0) 20 7466 5000
Investec Bank plc (NOMAD and Broker)
Chris Baird / Charles Craven / Carlton Nelson
Tel: +44 (0) 20 7597 5970
Notes to editors:
Gooch & Housego is a photonics technology business with operations in the USA and Europe. A world leader in its field, the company researches, designs, engineers and manufactures advanced photonic systems, components and instrumentation for applications in the Aerospace and Defence, Industrial and Telecom, and Life Sciences sectors. World-leading design, development and manufacturing expertise is offered across a broad range of complementary technologies. It is headquartered in Ilminster, Somerset, UK. For more information please visit www.gandh.com.
This announcement contains certain forward-looking statements that are based on management's current expectations or beliefs as well as assumptions about future events. These are subject to risk factors associated with, amongst other things, the economic and business circumstances occurring from time to time in the countries and sectors in which G&H operates. It is believed that the expectations reflected in these statements are reasonable but they may be affected by a wide range of variables which could cause actual results, and G&H's plans and objectives, to differ materially from those currently anticipated or implied in the forward-looking statements. Investors should not place undue reliance on any such statements. Nothing in this announcement should be construed as a profit forecast.
Operating and Financial Review
Performance Overview
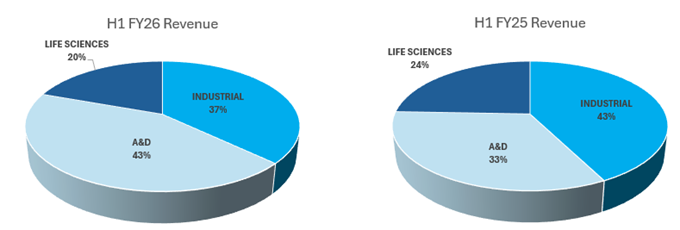
The Group's revenue for the period totalled £81.9m (H1 2025: £70.9m) representing 15.5% growth over the prior year comparator period, or 9.1% on an organic, constant currency basis. Demand from the Group's Aerospace & Defence ('A&D') market has remained strong and continues to grow. Revenue from the Group's industrial laser and semiconductor markets also improved with encouraging signs that the recovery in semiconductors is now underway.
Revenue in the Group's Industrial segment was broadly flat on prior year or 4.6% higher on an organic, constant currency basis. We saw some improvement in our industrial laser and semiconductor markets in the period. Encouragingly, order intake across this sector has increased significantly and demand from our subsea data cable market remains strong.
Revenue into the Group's A&D markets grew by 51.7% or 26.0% on an organic, constant currency basis, helped by our refocused go-to-market strategy combined with the commercial synergy benefits arising from recent acquisitions of Global Photonics and Phoenix Optical. Operational improvements and our enhanced germanium processing capabilities drove margin improvement, and, for the first time, this sector was a major contributor to the Group's profitability in H1 2026.
Revenue in the Group's Life Sciences segment was down by 7.7% or 5.8% on an organic, constant currency basis. We saw continued disruption to our Pockels Cells production from materials availability particularly in the first quarter. Production increased in the second quarter as we qualified alternative materials suppliers and is expected to continue to ramp up in the second half. Revenues from our medical diagnostics products were lower due to phasing of customer demand and are expected to improve throughout H2 2026.
Overall, due to the volume growth and the benefits of our operational efficiency and supply chain actions, underlying operating profit increased by 16.9% to £7.2m (H1 2025: £6.2m). This represents a return on sales of 8.8% (H1 2025: 8.7%).
The integration of the Phoenix Optical and Global Photonics businesses is now largely complete and the enhanced offering the Group now provides has been key in helping secure new orders from defence customers in the US, UK and Europe.
The Group's order book increased to £167.3 million (30 September 2025: £142.4 million). The growth on an organic constant currency basis was 16.5%. The level of enquiries for the Group's products and services remains high, especially in defence, from both existing and new customers.
Order book growth was not limited to one end-market. Aerospace & Defence remained particularly strong, supported by customer demand for advanced optical systems and regional supply assurance. Industrial order intake also improved, aligned to the recovery in semiconductor-related markets, while Life Sciences performance remained affected by customer phasing and legacy product transition activity.
The geopolitical and macroeconomic background remains volatile with fluid tariff policies, retaliatory measures and continued unrest in Ukraine and the Middle East. G&H's direct exposure to those countries that have been subjected to the current most significant tariff increases on imports to the US is limited, but we remain vigilant to the more general market instability, potential for order delays and inflationary impacts of increasing global tariffs. We have been able to re-source our supply of certain key raw materials where availability has been restricted and continue to hold higher stock levels. We are passing on cost base increases arising from these developments through higher pricing where possible. The Group has also continued to strengthen its position in germanium-related products, which are important to a number of Aerospace & Defence and Semiconductor applications. While raw material availability remains variable, actions taken to optimise sourcing and increase resilience have improved the Group's ability to support customer demand.
Revenue
Six months ended 31 March
2026
2025
From continuing operations
£'M
£'M
% Change
Industrial
30.3
30.1
0.7%
Aerospace & Defence
35.6
23.5
51.7%
Life Sciences
16.0
17.3
(7.7%)
Group Revenue
81.9
70.9
15.5%
Products and Markets - Industrial
Gooch & Housego's principal industrial markets are industrial lasers, telecommunications, sensing and semiconductor manufacturing. Industrial lasers are used in a diverse range of high precision material processing applications ranging from microelectronics and semiconductors to automotive manufacturing.
Overall, sales of products by the Group into our industrial markets in the six months ended 31 March 2026 increased by 0.7%, or 4.6% when measured on an organic, constant currency basis, compared with the equivalent period last year. The semiconductor market is now showing strengthening signs of a recovery and we are seeing increased order intake from the semiconductor processing, sensing and advanced microelectronics markets. The scale and phasing of this recovery remains under review, but the improvement in order activity provides greater confidence in the medium-term outlook for the segment.
Adjusted operating profit was slightly ahead of the prior year at £3.8m, and the adjusted return on sales percentage was 12.7% (H1 2025: 12.6%).
Products and Markets - Aerospace & Defence ('A&D')
In A&D the Group continues to strengthen and grow well-established positions in periscopes and sighting systems, target designation and range finding, ring laser gyroscope navigational systems, advanced opto-mechanical subsystems and space-based optical communications. The Group is also seeing increasing involvement in laser directed energy weapon ('LDEW') programmes, where our precision optical and subsystem capabilities are supporting the development of next generation defensive technologies for allied naval and land-based defence applications.
Demand across the sector remains strong as key allied nations continue to prioritise the enhancement of defensive capabilities in response to the evolving global security environment. This has resulted in increased demand for the Group's infrared lens systems and optical assemblies for counter-unmanned aerial systems ('C-UAS'), short-range air defence ('SHORAD'), near-Earth orbit and naval applications, areas where our precision optical expertise and vertically integrated manufacturing capabilities provide a differentiated offering.
The continued recovery and production ramp within the commercial aviation market is also driving increased demand for the Group's ring laser gyroscope ('RLG') products, with customers seeking reliable supply partners capable of supporting higher build rates and long-term programme requirements. Operational improvements across the Group's precision optics facilities have enabled increased throughput and enhanced production efficiency to support this growing demand.
The defence focused investments made through the acquisitions of Artemis Optical, Phoenix Optical Technologies and Global Photonics (Meopta US) combined with our existing enhanced capabilities have further strengthened the Group's defence market position and demonstrated our commitment to expanding manufacturing capacity and technical capability across multiple regions. Aligned to the Group's strategy launched in June 2023, these acquisitions have enhanced our ability to provide customers with a broader integrated optical solutions offering whilst also supporting increasingly regionalised supply chain requirements of allied nations. G&H now has manufacturing and technical capability aligned to UK and European customer requirements as well as dedicated US-based capability supporting North America's growing demand. The combination of these businesses with the Group's existing capabilities continues to support new customer opportunities and reinforces our position as a strategic supplier within the A&D market. Customers are increasingly prioritising security of supply, regional manufacturing capability and vertically integrated optical fabrication, areas where G&H's strengthened UK, European and US footprint provides a differentiated proposition.
Group revenue into the A&D market grew by 51.7%, or 26.0% on an organic constant currency basis compared with the first half of FY 2025. Additional volumes in this segment together with our operational efficiency improvements resulted in the segment generating an adjusted operating profit in the period of £3.6m (H1 2025: £0.6m).
Products and Markets - Life Sciences
G&H has established itself as a trusted supplier in the Life Sciences market, delivering advanced optical components that enhance the performance and reliability of life science instruments. Our contributions span applications such as microscopy, medical diagnostics, biomedical imaging, and laser surgery, where our reputation as a leading provider of advanced optics, fibre optics, acousto-optics, and electro-optics is well recognised globally.
Revenues from our medical diagnostic markets reduced compared with the first half of FY2025. This was principally due to customer demand phasing, with certain customers having procured systems from G&H in FY2025 and moved into installation and qualification phases during H1 of FY2026. A number of customer programmes also remain in clinical trial and regulatory approval phases, with volume production now expected to contribute from FY2027.
As reported in G&H's 2025 Annual Report, the Group has made the decision to end-of-life the majority of its Pockels Cells product lines for the medical lasers market. Last-time-buy activity created elevated short-term demand in these products during the period, which coincided with material supply constraints and production yield challenges at the Group's Cleveland facility.
Management has taken action to qualify alternative material sources and improve in-house production performance. Production increased through the second quarter and is expected to continue to recover in the second half. While these factors affected margins in H1 2026, the Board expects Life Sciences margins to improve as production normalises and customer demand strengthens.
Revenue from the Group's Life Sciences market reduced by 7.7% or 5.8% on an organic, constant currency basis in H1 2026, compared with H1 2025. The reduction in revenue combined with the production and supply chain challenges outlined above, meant that operating profit returns in this segment declined to 4.6% (H1 2025: 12.0%).
Strategy
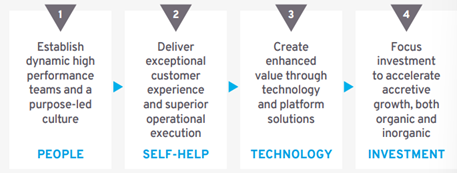
G&H's strategy to become an 'innovative customer focused technology company' delivered responsibly by making a 'better world with photonics', continues to progress positively and we are now seeing the benefits of having refocused the whole business on delivering sustainable margin growth in the medium term. The successful execution of this value creation strategy will ensure that G&H remains the 'first choice' for all our stakeholders whether that's for our employees, our customers, our shareholders, our eco-system partners or the communities in which we operate. We will offer differentiated performance through four key strategic priorities.
Key Strategic Priorities:
The first-half performance provides clear evidence of progress against the Group's strategy: stronger exposure to structurally growing A&D markets, improved operational execution, enhanced regional manufacturing capability, increased supply-chain resilience, active capacity and efficiency improvements, and a higher-quality order book.
Financial Review
Group revenue grew by 15.5% or 9.1% on an organic, constant currency basis. Operating margins progressed slightly to 8.8% from 8.7% in H1 2026, reflecting the benefits of additional volume and the delivery of the strategic actions we are implementing, which were partially offset by the impact of certain supply chain and production challenges particularly in our Life Sciences business.
The Group's spend on R&D totalled £3.9m, up 10.6% on the first half of FY 2025 (H1 2025: £3.5m). We continue to focus on our six vital few R&D workstreams and progress in these areas has been positive. We have invested in engineering resource where necessary and continue to expect these projects to generate in excess of £50m of margin-accretive revenue in the medium term.
The growth in the Group's overheads to £13.0m (H1 2025: £11.9m) reflected the inclusion of the Global Photonics business and, to a lesser extent, the full period effect of Phoenix Optical, combined with inflationary increases to staff salaries.
Underlying operating profit increased by 16.9% to £7.2m (H1 2025: £6.2m). Reported operating profit grew to £4.9m (H1 2025: £4.2m). Further details of the adjustments made between underlying and reported profit measures are set out below.
The Group's interest charges totalled £1.6m (H1 2025: £1.3m). The increased charge was largely due to additional borrowing taken to fund the acquisition of the Global Photonics business in June 2025.
The Group's adjusted effective tax rate was 22.4% (H1 2025: 22.9%). Adjusted earnings per share was 16.4p (H1 2025: 15.0p)
Alternative Performance Measures
In the analysis of the Group's financial performance, alternative performance measures are presented to provide readers with additional information. The interim report includes both statutory and adjusted non-GAAP financial measures. The Directors believe the latter reflect the underlying performance of the business. Items excluded from the adjusted results, together with their prior period comparatives, are set out below.
Reconciliation of adjusted performance measures
Operating profit
Net finance costs
Profit before tax
Taxation
Profit after tax from continuing operations
Earnings per share
Half Year to 31 March
2026
£000
2025
£000
2026
£000
2025
£000
2026
£000
2025
£000
2026
£000
2025
£000
2026
£000
2025
£000
2026
Pence
2025
Pence
Reported
4,874
4,156
(1,552)
(1,288)
3,322
2,868
(825)
(776)
2,497
2,092
9.2p
8.1p
Amortisation of acquired intangible assets
1,519
1,097
-
-
1,519
1,097
(321)
(234)
1,198
863
4.4p
3.3p
Restructuring and other costs
385
412
-
-
385
412
(67)
(80)
318
332
1.2p
1.3p
Acquisition and integration costs
193
426
-
-
193
426
(26)
(17)
167
409
0.6p
1.6p
Site closure costs
-
64
-
-
-
64
-
-
-
64
-
0.2p
Local employment litigation costs
227
-
-
-
227
-
(23)
-
204
-
0.7p
-
Interest on deferred consideration
-
-
108
184
108
184
(27)
(50)
81
134
0.3p
0.5p
Adjusted
7,198
6,155
(1,444)
(1,104)
5,754
5,051
(1,289)
(1,157)
4,465
3,894
16.4p
15.0p
Cash Flow and Financing
In the six months ended 31 March 2026, G&H generated net cash from operations of £3.9m, compared with £2.6m in the same period of FY2025. Working capital levels increased by £4.9m from the end of FY 2025. This was driven by growth in receivables following high levels of invoicing in March which have since largely been converted to cash. The Group's inventory also grew by £1.3m although this was offset by higher trade creditor balances at the end of March. The Group has chosen to increase its inventory of some materials such as Germanium in response to continued uncertainty in their availability as a result of export restrictions imposed by the Chinese government.
In October 2025, deferred consideration of £1m was paid in respect of the Artemis Optical business, which was acquired in July 2023. No further deferred consideration is payable in respect of this acquisition.
Capital expenditure on property, plant and equipment was £3.4m in the period (H1 2025: £2.5m). The principal areas of investment in H1 2026 were in increasing capacity in our Tampa, Florida facility by the installation of a new clean room and optical systems assembly equipment and on additional production equipment for fibre optic modules in Torquay.
On 12 March 2026, the Group extended its revolving credit facility, which now comprises a committed facility of US$70m. As at 31 March 2026 the Group had drawn US$54.8m on its revolving credit facility (September 2025: US$50.2m).
At 31 March 2026 the Group's net debt totalled £49.8m (30 September 2025: £43.9m) including lease liabilities of £13.2m (30 September 2025: £14.0m). Consistent with the Group's borrowing agreements, which exclude the impact of IFRS 16, Leases, our leverage ratio was 1.5 times at 31 March 2026 (30 September 2025: 1.3 times).
Environmental, Social and Governance
In H1 2026, the Group's carbon intensity measure increased by 15.7% due to the recent acquisitions of Phoenix Optical in North Wales and Global Photonics in Tampa, Florida. However, on an organic basis the Group achieved a like for like reduction of 6.4%.
During the period, and as part of the integration of these acquisitions, we will transition these sites' electricity supplies to renewable sources during the second half of the year in line with the Group's stated aim of reducing emissions by 10% per annum.
The Group continues to invest to support its target of being net zero for Scope 1 and 2 emissions by 2035 and Scope 3 by 2050. We are working with the landlord of our facility in Tampa, Florida to explore the installation of solar panels for the onsite generation of electricity.
Our programme to extend ISO 14001 - Environmental Management - to all the Group's sites continues to schedule. We expect our Moorpark, California and Tampa, Florida sites to achieve accreditation in the second half of this financial year and to have all Group's facilities accredited ahead of plan by the end of FY 2027.
The Group manages its activities in this area through the Sustainability Committee of the Board. This Committee is chaired by our non-executive director, Susan Searle. This Committee is supported in its work by a Sustainability subcommittee staffed with representatives from across the Group. The remit of the Sustainability Committee includes oversight of the Group's activities to ensure appropriate adherence to the Group's Ethics & Anti-Corruption, Equality, Diversity & Inclusion, Trade Compliance and Cyber Security policies. We are using the Group's new HR Information System to deliver training content electronically and to use the system to record course completion by employees.
Dividends
An interim dividend of 4.9p per share (H1 2025: 4.9p) has been declared. This dividend will be payable to shareholders on the register as at 19 June 2026 on 24 July 2026.
Prospects and Outlook
The Group's strong H1 2026 performance demonstrates the positive progress the Group continues to make with the deployment of its strategy and highlights the resilience and depth of experience across our leadership team in navigating complex market dynamics. Our growing order book, strengthening market positions and differentiated photonics expertise aligned to structural growth drivers from megatrends, mean we remain confident in our ability to deliver further progress on our journey to mid-teens returns over the medium term and generate value for all our stakeholders.
The Group enters H2 2026 with a record order book, near full revenue cover for FY2026 and strong demand in Aerospace & Defence. Industrial and Semiconductor markets are showing encouraging signs of growth, whilst Life Sciences production disruption is expected to ease through H2 2026.
Although global geopolitical uncertainty and macroeconomic challenges remain, the Group is proactively managing this increased complexity and volatility in global supply chains and remains vigilant regarding operations and inventory planning. Despite these challenges, the Board's expectations for FY2026 are unchanged, and the Group's strengthened market positions, improved operational performance and differentiated photonics capabilities reinforce our confidence in further profitable growth and continued progress to mid-teens returns over the medium term.
Principal Risks and Uncertainties
The principal risks and uncertainties to which G&H is exposed and our approach to managing those risks are unchanged from those identified in the Group's 2025 Annual Report. At the end of 2025 we identified geopolitical risks and raw materials supply as the two most significant for the Group and with the rapidly changing geopolitical landscape those risks have affected the Group in H1 2026.
We continue to strive to limit as much as possible our direct exposure to supply from China. However, in the first half, as explained above, we needed to qualify several Chinese suppliers for certain raw materials which has meant the Group incurred higher tariffs on certain material purchases.
Security of material supply continues to be an important risk for the Group. Our supply chain team has taken actions to mitigate the impact of export restrictions imposed by the Chinese government on certain raw materials. This has ensured continuity of supply overall, although delivery timing has remained variable in certain instances.
Group Income Statement
Unaudited interim results for the 6 months ended 31 March 2026
Half Year to 31 March 2026 (Unaudited)
Half Year to 31 March 2025 (Unaudited)
Full Year to 30 September 2025
(Audited)
Note
Underlying
Non-underlying
Total
Underlying
Non-underlying
Total
Total
£'000
£'000
£'000
£'000
£'000
£'000
£'000
Revenue
4
81,876
-
81,876
70,878
-
70,878
150,485
Cost of revenue
(57,816)
-
(57,816)
(49,310)
-
(49,310)
(103,821)
Gross profit
24,060
-
24,060
21,568
-
21,568
46,664
Research and development
(3,911)
-
(3,911)
(3,535)
-
(3,535)
(7,296)
Sales and marketing
(4,720)
-
(4,720)
(4,344)
-
(4,344)
(8,870)
Administration
(9,097)
(2,324)
(11,421)
(7,857)
(1,999)
(9,856)
(23,910)
Other income and expenses
866
-
866
323
-
323
1,546
Operating profit / (loss)
4
7,198
(2,324)
4,874
6,155
(1,999)
4,156
8,134
Net finance costs
(1,444)
(108)
(1,552)
(1,104)
(184)
(1,288)
(2,807)
Profit / (loss) before income tax expense
5,754
(2,432)
3,322
5,051
(2,183)
2,868
5,327
Income tax expense
6
(1,289)
464
(825)
(1,157)
381
(776)
(1,791)
Profit / (loss) for the period
4,465
(1,968)
2,497
3,894
(1,802)
2,092
3,536
Earnings / (loss) per share
From continuing operations
Basic earnings per share
7
16.4p
(7.2p)
9.2p
15.0p
(6.9p)
8.1p
13.7p
Diluted earnings per share
7
16.1p
(7.1p)
9.0p
14.8p
(6.8p)
8.0p
13.3p
Group Statement of Comprehensive Income
Half Year to
31 Mar 2026
(Unaudited)Half Year to
31 Mar 2025
(Unaudited)Full Year to
30 Sep 2025
(Audited)
£'000
£'000
£'000
Profit for the period
2,497
2,092
3,536
Other comprehensive (expense) / income
(Losses) / gains on cash flow hedges
(149)
18
8
Currency translation differences
683
1,737
137
Other comprehensive income for the period
534
1,755
145
Total comprehensive income for the period
3,031
3,847
3,681
Group Balance Sheet
Unaudited interim results for the 6 months ended 31 March 2026
31 Mar 2026
(Unaudited)31 Mar 2025
(Unaudited)
30 Sep 2025
(Audited)
£'000
£'000
£'000
Non-current assets
Property, plant and equipment
37,450
38,370
36,518
Right of use assets
12,135
10,395
12,956
Intangible assets
65,828
55,495
66,561
115,413
104,260
116,035
Current assets
Inventories
42,380
37,597
40,794
Trade and other receivables
48,625
37,860
42,068
Current asset investments
761
-
761
Cash and cash equivalents
4,423
5,546
7,198
96,189
81,003
90,821
Current liabilities
Trade and other payables
(29,223)
(22,010)
(28,542)
Lease liabilities
(2,214)
(1,881)
(2,234)
Tax liabilities
(1,233)
(1,992)
(2,420)
Deferred consideration
-
(2,074)
-
(32,670)
(27,957)
(33,196)
Net current assets
63,519
53,046
57,625
Non-current liabilities
Borrowings
(41,049)
(29,604)
(37,066)
Lease liabilities
(10,998)
(9,591)
(11,755)
Provision for other liabilities and charges
(2,014)
(1,100)
(2,031)
Deferred consideration
(1,899)
(1,682)
(959)
Deferred tax liabilities
(3,913)
(4,809)
(4,412)
(59,873)
(46,786)
(56,223)
Net assets
119,059
110,520
117,437
Shareholders' equity
Called up share capital
5,474
5,159
5,423
Share premium account
16,051
16,051
16,051
Merger reserve
19,589
11,561
19,109
Cumulative translation reserve
5,921
6,838
5,238
Hedging reserve
-
159
149
Retained earnings
72,024
70,752
71,467
Total equity
119,059
110,520
117,437
Statement of Changes in Equity
Unaudited interim results for the 6 months ended 31 March 2026
Share capital account
Share premium account
Merger reserve
Retained earnings
Hedging reserve
Cumulative translation reserve
Total equity
£000
£000
£000
£000
£000
£000
£000
At 1 October 2024
5,159
16,051
11,561
70,375
141
5,101
108,388
Profit for the period
-
-
-
2,092
-
-
2,092
Other comprehensive income for the period
-
-
-
-
18
1,737
1,755
Total comprehensive (expense) / income for the period
-
-
-
2,092
18
1,737
3,847
Dividends
-
-
-
(2,140)
-
-
(2,140)
Share based payments
-
-
-
425
-
-
425
At 31 March 2025 (unaudited)
5,159
16,051
11,561
70,752
159
6,838
110,520
At 1 October 2025
5,423
16,051
19,109
71,467
149
5,238
117,437
Profit for the period
-
-
-
2,497
-
-
2,497
Other comprehensive (expense) / income for the period
-
-
-
-
(149)
683
534
Total comprehensive income / (expense) for the period
-
-
-
2,497
(149)
683
3,031
Issue of new shares
51
-
480
-
-
-
531
Dividends
-
-
-
(2,272)
-
-
(2,272)
Share based payments
-
-
-
150
-
-
150
Tax on share based payments in equity
-
-
-
182
-
-
182
At 31 March 2026 (unaudited)
5,474
16,051
19,589
72,024
-
5,921
119,059
Group Cash Flow Statement
Unaudited interim results for the 6 months ended 31 March 2026
Half Year to 31 Mar 2026 (Unaudited)
Half Year to 31 Mar 2025 (Unaudited)
Full Year to 30 Sep 2025 (Audited)
£'000
£'000
£'000
Cash flows from operating activities
Cash generated from operations
6,035
3,590
11,167
Income tax paid
(2,110)
(1,040)
(1,811)
Net cash generated from operating activities
3,925
2,550
9,356
Cash flows from investing activities
Acquisition of subsidiaries, net of cash acquired
(989)
(2,716)
(10,060)
Purchase of property, plant and equipment
(3,428)
(2,463)
(4,565)
Sale of property, plant and equipment
75
325
340
Purchase of intangible assets
(860)
(1,218)
(1,744)
Interest received
7
8
14
Net cash used in investing activities
(5,195)
(6,064)
(16,015)
Cash flows from financing activities
Drawdown of borrowings
3,920
7,874
20,662
Repayment of borrowings
(560)
(1,585)
(5,474)
Repayment of lease liabilities
(1,162)
(794)
(1,875)
Interest paid
(1,451)
(1,112)
(2,528)
Dividends paid to ordinary shareholders
(2,272)
(2,140)
(3,469)
Net cash (used in) / generated by financing activities
(1,525)
2,243
7,316
Net (decrease) / increase in cash
(2,795)
(1,271)
657
Cash at beginning of the period
7,198
6,622
6,622
Exchange gains / (losses) on cash
20
195
(81)
Cash at the end of the period
4,423
5,546
7,198
Notes to the Group Cash Flow Statement
Half Year to 31 Mar 2026 (Unaudited)
Half Year to 31 Mar 2025 (Unaudited)
Full Year to 30 Sep 2025 (Audited)
£'000
£'000
£'000
Profit before income tax from continuing operations
3,322
2,868
5,327
Adjustments for:
- Amortisation of acquired intangible assets
1,519
1,097
2,500
- Amortisation of other intangible assets
654
758
1,451
- Loss on disposal of property, plant and equipment
21
-
133
- Depreciation
3,965
4,046
8,220
- Share based payments
150
425
1,025
- Release of deferred consideration creditor
-
-
(658)
- Non-cash consideration received from customer contracts
-
-
(761)
- Amounts claimed under the RDEC
(225)
(200)
(391)
- Finance income
(7)
(8)
(14)
- Finance costs
1,451
1,112
2,821
- Non cash interest charge included in finance costs
109
184
-
Total adjustments
7,637
7,414
14,326
Changes in working capital
- Inventories
(1,284)
(5,299)
(7,616)
- Trade and other receivables
(6,376)
(4,884)
(8,963)
- Trade and other payables
2,736
3,491
8,093
Total changes in working capital
(4,924)
(6,692)
(8,486)
Cash generated from operating activities
6,035
3,590
11,167
Reconciliation of net cash flow to movements in net debt
Half Year to
31 Mar 2026
(Unaudited)Half Year to
31 Mar 2025
(Unaudited)Full Year to 30 Sep 2025
(Audited)
£'000
£'000
£'000
Decrease in cash in the period
(2,795)
(1,271)
657
Drawdown of borrowings
(3,920)
(7,874)
(20,662)
Repayment of borrowings
2,096
2,647
7,958
Changes in net debt resulting from cash flows
(4,619)
(6,498)
(12,047)
New leases
(215)
(414)
(2,241)
Acquired leases
-
(1,631)
609
Translation differences
(750)
(830)
(456)
Non cash movements including leases disposed
(397)
(347)
(3,912)
Movement in net debt in the period / year
(5,981)
(9,720)
(18,047)
Net debt at start of period
(43,857)
(25,810)
(25,810)
Net debt at end of period
(49,838)
(35,530)
(43,857)
Analysis of net debt
At 1 Oct 2025
New leases
Cash flow
Exchange movement
Non-cash movement
At 31 Mar
2026
£'000
£'000
£'000
£'000
£'000
£'000
Cash at bank and in hand
7,198
-
(2,795)
20
-
4,423
Debt due after one year
(37,066)
-
(3,360)
(596)
(27)
(41,049)
Lease liabilities
(13,989)
(215)
1,536
(174)
(370)
(13,212)
Net debt
(43,857)
(215)
(4,619)
(750)
(397)
(49,838)
Notes to the Interim Report
1. Basis of Preparation
The unaudited Interim Report has been prepared under the historical cost convention as modified by financial assets and financial liabilities at fair value and in accordance with UK adopted International Accounting Standards and with the requirements of the Companies Act 2006 as applicable to companies reporting under those standards.
The Interim Report was approved by the Board of Directors on 2 June 2026. The Interim Report does not constitute statutory financial statements within the meaning of the Companies Act 2006 and has not been audited.
Comparative figures in the Interim Report for the year ended 30 September 2025 have been taken from the Group's audited statutory financial statements on which the Group's auditors, PricewaterhouseCoopers LLP, expressed an unqualified opinion. The comparative figures to 31 March 2025 are unaudited.
The Interim Report will be announced to all shareholders on the London Stock Exchange and published on the Group's website on 2 June 2026. Copies will be available to members of the public upon application to the Company Secretary at Dowlish Ford, Ilminster, Somerset, TA19 0PF.
There were no changes to accounting policies described in the annual financial statements for the year ended 30 September 2025 that had a material effect on the financial statements.
Cash flow projections show that the Group has sufficient funding available to withstand plausible downside scenarios, and therefore the financial statements have been prepared on a going concern basis.
2. Estimates
The preparation of interim financial statements requires management to make estimates and assumptions that affect the application of accounting policies and the reported amounts of assets and liabilities, income and expense. Actual results may differ from these estimates.
In preparing these condensed consolidated interim financial statements, the significant judgments made by management in applying the Company's accounting policies and the key sources of estimation uncertainty were the same as those that applied to the consolidated financial statements for the year ended 30 September 2025.
3. Financial risk management
The Company's activities expose it to a variety of financial risks, market risk (including currency risk, cash flow interest rate risk and price risk), credit risk and liquidity risk.
The interim condensed consolidated financial statements do not include all financial risk management information and disclosures required in the annual financial statements and should be read in conjunction with the Company's annual financial statements as at 30 September 2025. There have been no changes to the risk management policies since the year end.
4. Segmental analysis
Aerospace & Defence
Life Sciences / Biophotonics
Industrial
Corporate
Total
For half year to 31 March 2026
£'000
£'000
£'000
£'000
£'000
Revenue
Total revenue
42,326
16,434
33,007
-
91,767
Inter and intra-division
(6,739)
(471)
(2,681)
-
(9,891)
External revenue
35,587
15,963
30,326
-
81,876
Divisional expenses
(30,498)
(14,809)
(25,178)
(379)
(70,864)
EBITDA¹
5,089
1,154
5,148
(379)
11,012
EBITDA %
14.3%
7.2%
17.0%
-
13.4%
Depreciation and amortisation
(1,861)
(548)
(1,551)
(659)
(4,619)
Operating profit / (loss) before amortisation of acquired intangible assets
3,228
606
3,597
(1,038)
6,393
Amortisation of acquired intangible assets
-
-
-
(1,519)
(1,519)
Operating profit / (loss)
3,228
606
3,597
(2,557)
4,874
Operating profit / (loss) margin %
9.1%
3.8%
11.9%
-
6.0%
Add back non-recurring items
417
136
249
1,522
2,324
Operating profit / (loss) excluding non-recurring items
3,645
742
3,846
(1,035)
7,198
Adjusted operating profit / (loss)
margin %
10.2%
4.6%
12.7%
-
8.8%
Aerospace & Defence
Life Sciences / Biophotonics
Industrial
Corporate
Total
For half year to 31 March 2025
£'000
£'000
£'000
£'000
£'000
Revenue
Total revenue
25,147
17,760
31,463
74,370
Inter and intra-division
(1,681)
(470)
(1,341)
-
(3,492)
External revenue
23,466
17,290
30,122
-
70,878
Divisional expenses
(21,385)
(14,529)
(25,325)
418
(60,821)
EBITDA¹
2,081
2,761
4,797
418
10,057
EBITDA %
8.9%
16.0%
15.9%
14.2%
Depreciation and amortisation
(1,748)
(927)
(1,382)
(747)
(4,804)
Operating (loss) / profit before amortisation of acquired intangible assets
333
1,834
3,415
(329)
5,253
Amortisation of acquired intangible assets
-
-
-
(1,097)
(1,097)
Operating (loss) / profit
333
1,834
3,415
(1,426)
4,156
Operating (loss) / profit margin %
1.4%
10.6%
11.3%
-
5.9%
Add back non-recurring items
266
245
391
1,097
1,999
Operating (loss) / profit excluding non-recurring items
599
2,079
3,806
(329)
6,155
Adjusted operating (loss)/profit
margin %
2.6%
12.0%
12.6%
-
8.7%
¹EBITDA = Earnings before interest, tax, depreciation and amortisation.
All of the amounts recorded are in respect of continuing operations.
4. Segmental analysis continued
Analysis of revenue from continuing operations by destination
Half year to
31 Mar 2026
(Unaudited)
Half year to
31 Mar 2025
(Unaudited)
£'000
£'000
United Kingdom
21,807
24,064
North and South America
34,023
22,864
Continental Europe
16,419
13,107
Asia-Pacific
9,627
10,843
81,876
70,878
5. Non-underlying items
Half Year to
31 Mar 2026
(Unaudited)Half Year to
31 Mar 2025
(Unaudited)Full Year to
30 Sep 2025
(Audited)
£'000
£'000
£'000
Profit before tax from continuing operations
3,322
2,868
5,327
Amortisation of and impairment of acquired intangible assets
1,519
1,097
2,500
Restructuring and other costs
385
412
3,169
Acquisition and integration costs
193
426
995
Release of deferred contingent consideration
-
-
(658)
Site closure costs
-
64
78
Local employment litigation
227
-
200
Interest on deferred consideration
108
184
293
Adjusted profit before tax
5,754
5,051
11,904
The restructuring costs in the period ended 31 March 2026 relate to non-recurring costs arising from our manufacturing streamlining activities.
6. Tax expense
Analysis of tax charge in the period
Half Year to
31 Mar 2026
(Unaudited)Half Year to
31 Mar 2025
(Unaudited)Full Year to 30 Sep 2025 (Audited)
£'000
£'000
£'000
Current taxation
UK Corporation tax
1,396
1,368
2,819
Overseas tax
(94)
(181)
(467)
Adjustments in respect of prior year tax charge
-
-
257
Total current tax
1,302
1,187
2,609
Deferred tax
Origination and reversal of temporary differences
(477)
(411)
(161)
Adjustments in respect of prior years
-
-
(657)
Total deferred tax
(477)
(411)
(818)
Tax expense / (credit) per income statement
825
776
1,791
The tax charge for the six months ended 31 March 2026 is based on the estimated effective rate of the tax for the Group for the full year to 30 September 2026. The estimated rate is applied to the profit before tax.
The adjusted effective tax rate on profit from continuing activities is 22.4% (H1 2025: 22.9%).
7. Earnings per share
The calculation of earnings per 20p Ordinary Share is based on the profit for the period using as a divisor the weighted average number of Ordinary Shares in issue during the period. The weighted average number of shares is given below.
Half Year to
31 Mar 2026
(Unaudited)Half Year to
31 Mar 2025
(Unaudited)Full Year to 30 Sep 2025
(Audited)
No.
No.
No.
Number of shares used for basic earnings per share
27,228,141
25,786,397
25,897,092
Dilutive shares
490,600
487,379
608,376
Number of shares used for dilutive earnings per share
27,718,741
26,273,776
26,505,468
A reconciliation of the earnings used in the earnings per share calculation is set out below:
Half Year to
31 Mar 2026 (Unaudited)Half Year to
31 Mar 2025
(Unaudited)Full Year to
30 Sep 2025
(Audited)
£'000
p per
share£'000
p per
share£'000
p per
shareBasic earnings per share from continuing operations
2,497
9.2p
2,092
8.1p
3,536
13.7p
Adjustments net of income tax expense:
Amortisation of acquired intangible assets
1,198
4.4p
863
3.3p
1,969
7.6p
Acquisition costs
167
0.6p
410
1.6p
951
3.7p
Site closure costs
-
-
64
0.2p
78
0.3p
Restructuring costs
318
1.2p
331
1.3p
2,882
11.0p
Unwind of discount on deferred consideration
81
0.3p
134
0.5p
220
0.8p
Release of deferred consideration creditor
-
-
-
-
(658)
(2.5p)
Litigation costs
204
0.7p
-
-
200
0.8p
Total adjustments net of income tax expense
1,968
7.2p
1,802
6.9p
5,642
21.7p
Adjusted basic earnings per share
4,465
16.4p
3,894
15.0p
9,178
35.4p
Basic diluted earnings per share
2,497
9.0p
2,092
8.0p
3,536
13.3p
Adjusted diluted earnings per share
4,465
16.1p
3,894
14.8p
9,178
34.6p
Adjusted earnings per share before amortisation of acquired intangible assets and adjustments has been shown because, in the opinion of the Directors, it more accurately reflects the trading performance of the Group.
8. Dividend
The Directors have declared an interim dividend of 4.9p per share for the half year ended 31 March 2026 (2025: 4.9p).
Half Year to
31 Mar 2026
(Unaudited)Half Year to
31 Mar 2025
(Unaudited)Full Year to
30 Sep 2025
(Audited)
£'000
£'000
£'000
Final 2025 dividend: 8.3p per share (Final 2024 dividend paid in 2025: 8.3p)
2,272
2,140
2,140
2025 Interim dividend of 4.9p per share (2024: 4.9p per share)
-
-
1,329
2,272
2,140
3,469
9. Borrowings
31 March 2026
£00031 March 2025 £000
30 September 2025
£'000
Current:
Leases
2,214
1,881
2,234
2,214
1,881
2,234
Non-current:
Bank borrowings
41,049
29,604
37,066
Leases
10,998
9,591
11,755
52,047
39,195
48,821
Total borrowings
54,261
41,076
51,055
G&H's primary lending bank is NatWest Bank. The Group's facilities were extended on 12 March 2026 and now comprise a US$70m (£52.9m) dollar revolving credit facility. At 31 March 2026, the balance drawn on the revolving credit facility was US$54.8m (£41.3m) (September 2025: US$50.2m (£37.3m)).
The revolving credit facility is committed until 31 March 2030 and attracts an interest rate of between 1.45% and 1.95% above rates specified by the bank dependent upon the Company's leverage ratio, payable on rollover dates.
The Group's banking facilities are secured on certain of its assets including land and buildings, property plant and equipment and inventory.
Maturity profile of bank borrowings
31 March
2026
£00031 March
2025
£00030 September 2025
£'000Between one and five years
41,049
29,604
36,536
41,049
29,604
36,536
Maturity profile of lease liabilities
31 March
2026
£00031 March
2025
£00030 September 2025
£'000Within one year
2,874
2,442
2,926
Between two and five years
9,247
7,602
10,635
After five years
3,621
3,263
3,225
15,742
13,307
16,786
10. Called up share capital
31 Mar 2026
No.
30 Sep 2025
No.
31 Mar 2026
£'000
30 Sep 2025
£'000
Allotted, issued and fully paid
Ordinary share of 20p each
27,370,726
27,115,033
5,474
5,423
- ENDS -
This information is provided by RNS, the news service of the London Stock Exchange. RNS is approved by the Financial Conduct Authority to act as a Primary Information Provider in the United Kingdom. Terms and conditions relating to the use and distribution of this information may apply. For further information, please contact rns@lseg.com or visit www.rns.com.
RNS may use your IP address to confirm compliance with the terms and conditions, to analyse how you engage with the information contained in this communication, and to share such analysis on an anonymised basis with others as part of our commercial services. For further information about how RNS and the London Stock Exchange use the personal data you provide us, please see our Privacy Policy.ENDIR FFFSIREILIIR