

Diploma, the specialist distributor of seals, cables and controls, has never looked cheap. Its Value Rank sat around 17 for most of the past decade, which put it in the most expensive fifth of the market. A value investor screening for low P/E ratios would never have bought it. And yet, from the moment it became a High Flyer (a high-quality share with strong momentum, but never cheap) in February 2016 at 715p, the shares went on to reach 7,870p by October 2026, eleven times the price.
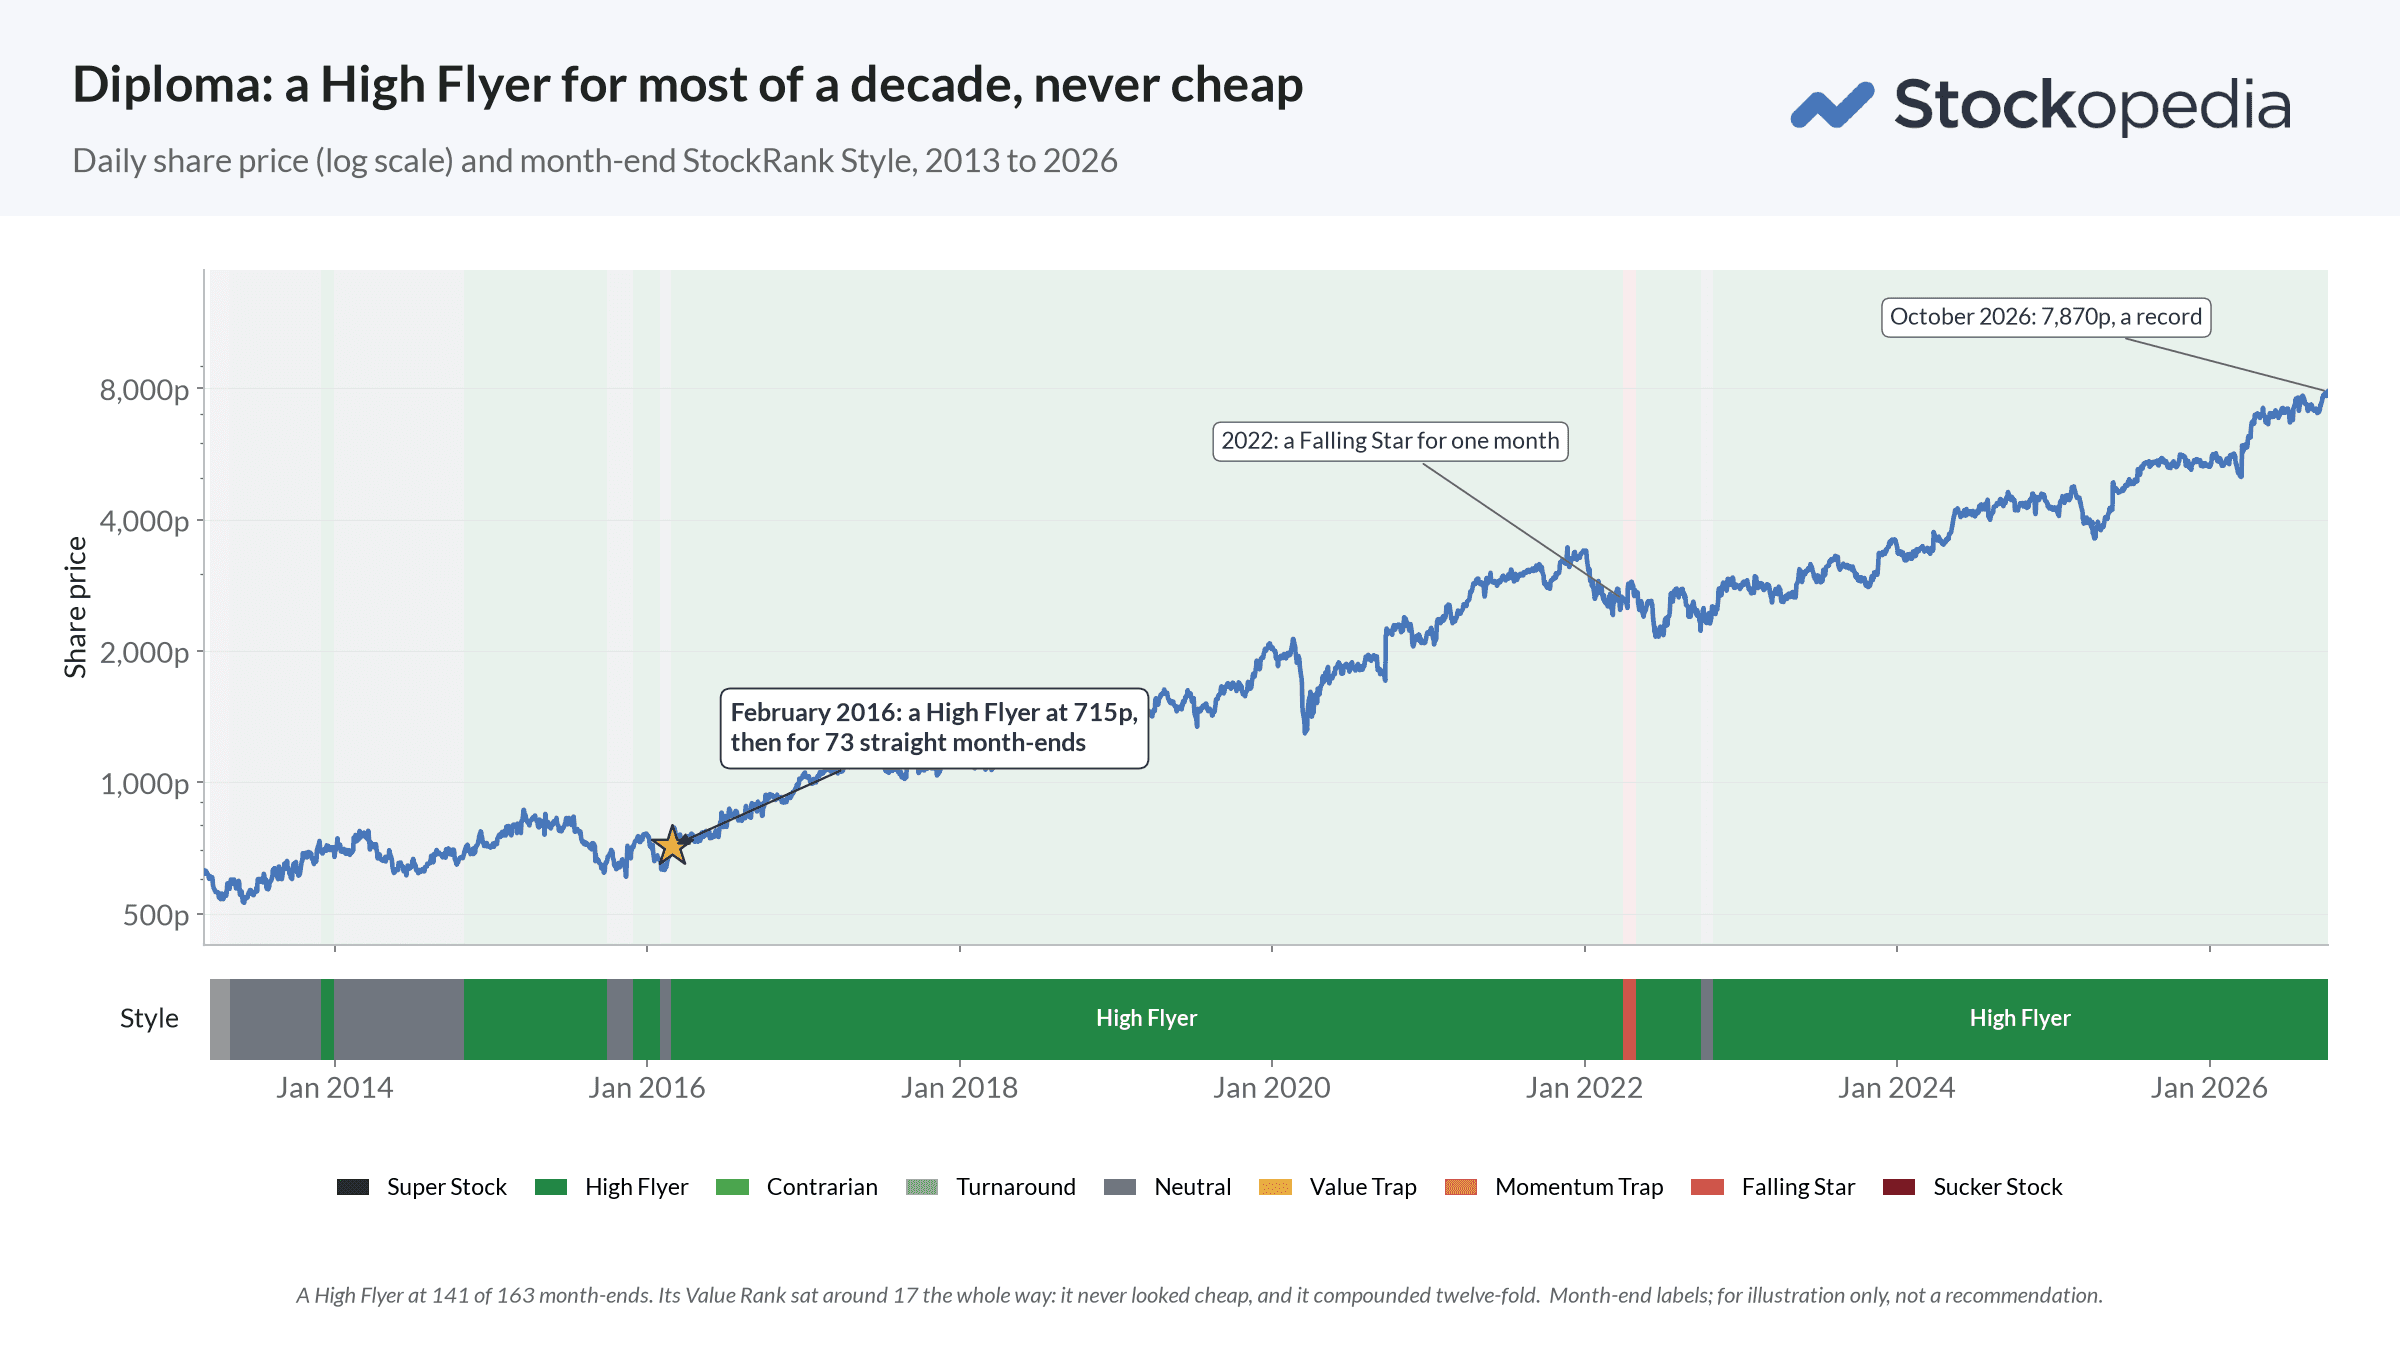
Diploma was a High Flyer for 73 straight month-ends, and for 141 of the 163 month-ends since 2013. There was no point on that journey where a value investor could have bought it, and almost no point where a High Flyer investor couldn't. It isn't a one-off, either. Many of the great US tech giants have spent years as High Flyers, and worldwide it has been one of the best-paid Styles: +11.3% a year across about 10,000 global shares over the ten years to September 2026, against +8.5% for the average share. That's the counterintuitive part. The shares that look most expensive are often the ones still worth owning.
What is a High Flyer?
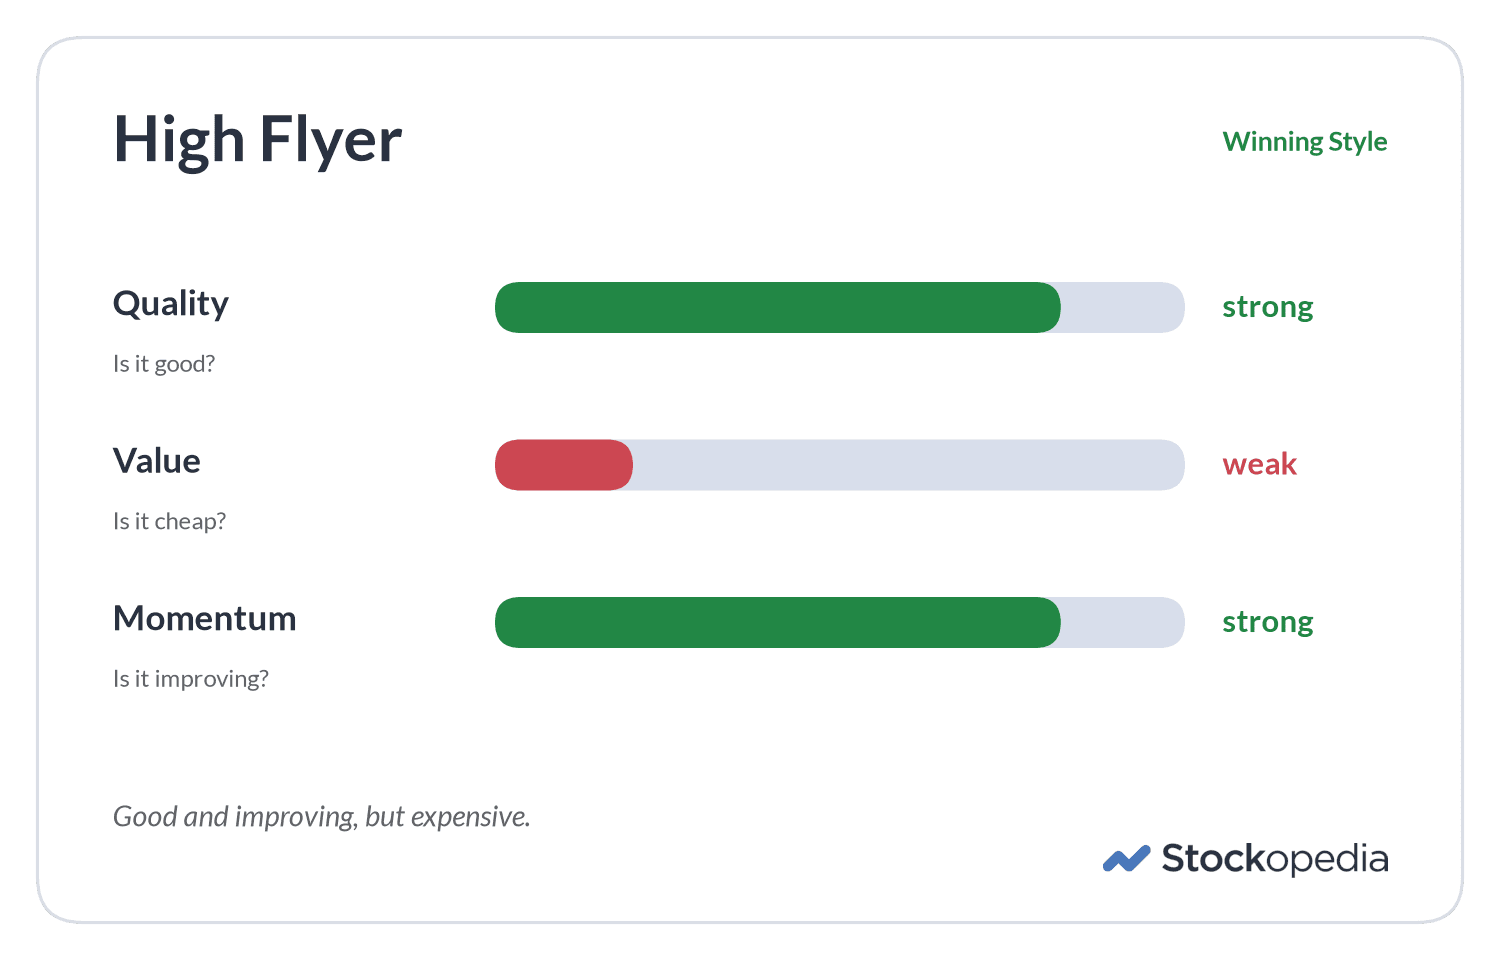
A High Flyer is good and improving, but expensive. Each of those words has a specific meaning in the StockRanks:
Good means a high Quality Rank. The company is profitable, with high returns on capital and healthy margins, and its sales and earnings have been growing.
Improving means a high Momentum Rank. The share price is strong relative to the market, and the company is usually beating expectations and seeing analysts upgrade their earnings forecasts.
Expensive means a low Value Rank. The share trades on a high multiple of its earnings, cash flow or assets, because the market already knows it's a good business.
A share is a High Flyer when its Quality and Momentum ranks are both above 50, the top half of the market, and its Value Rank is below. That makes it one of the four winning StockRank Styles, with two strong factors out of three. The rule that falls out of thirteen years of data is simple: never buy a share with fewer than two strong factors.
What High Flyers paid
Take every UK share that was a High Flyer, hold them all at equal weight and rebalance once a year. From April 2013 to September 2026 that basket returned +8.8% a year, against +5.7% for the average UK share. Before dividends, £100 became £256, against £157 in the average share. About 150 shares qualified at any one time, so this was never a handful of lucky picks.
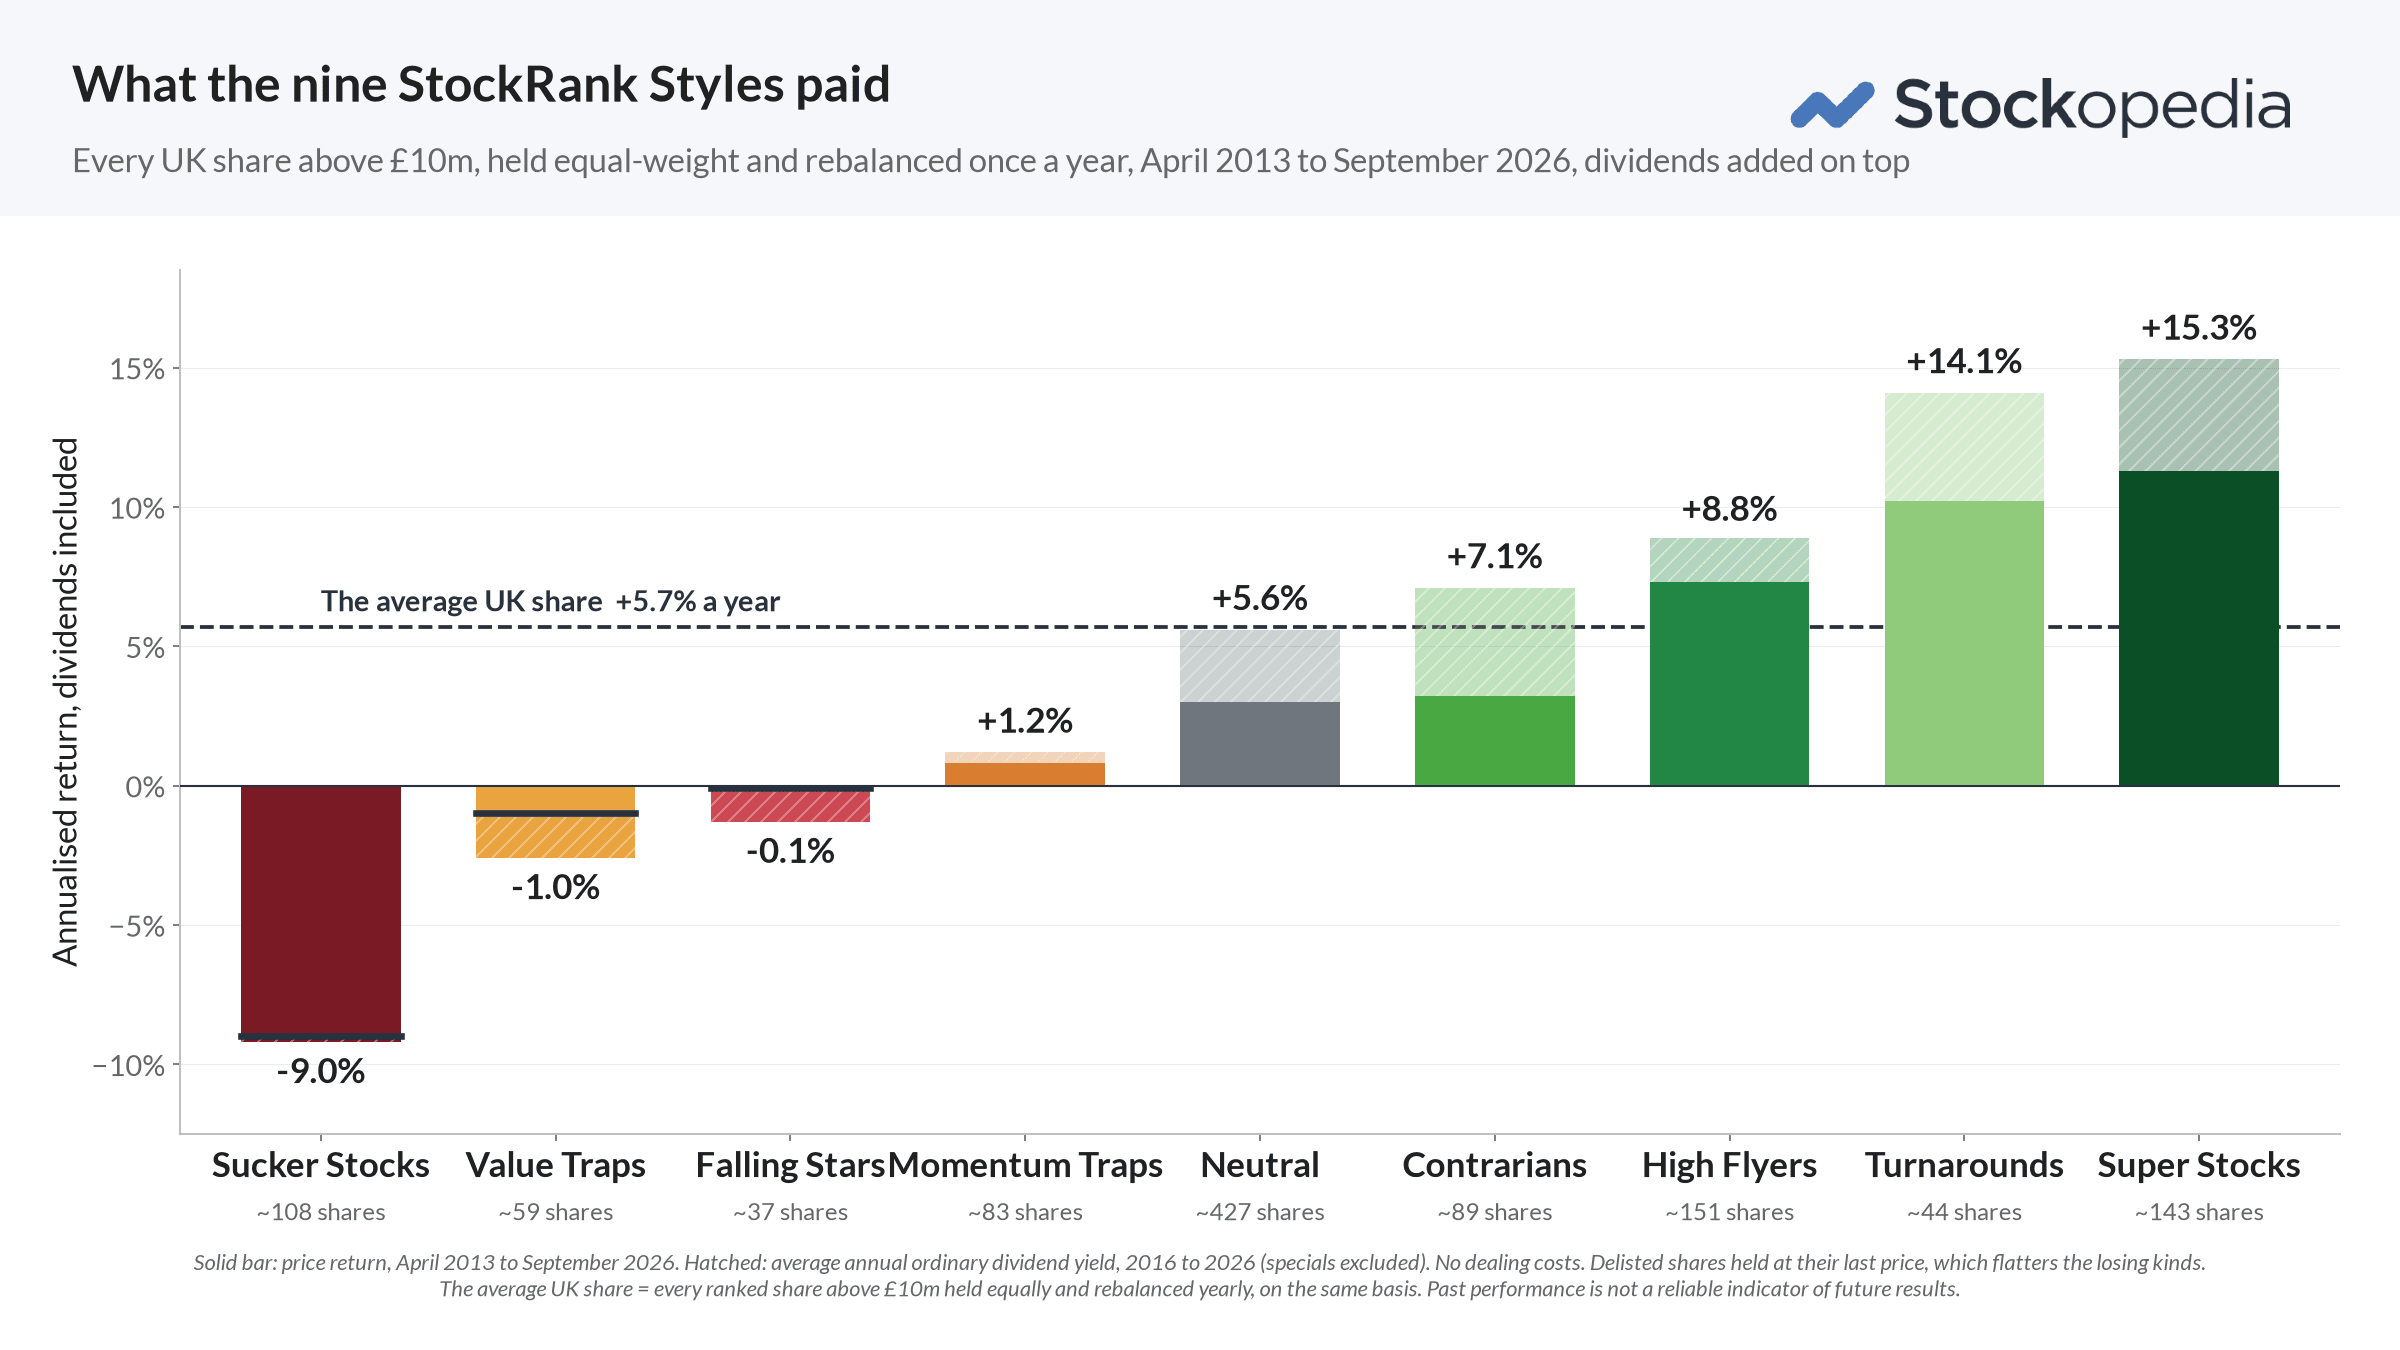
UK shares above £10m, held equal-weight and rebalanced once a year, April 2013 to September 2026, price return plus the average ordinary dividend yield measured 2016 to 2026, no dealing costs. Past performance is not a reliable indicator of future results.
Look at where that return came from. High Flyers made +7.3% a year from the share price and only 1.6% from dividends. Contrarians, the good-and-cheap shares value investors prefer, are the mirror image: +3.2% from price and 3.9% from dividends. A Contrarian pays you to wait. A High Flyer pays you to keep up.
In the US, High Flyers really pay. Over the ten years to September 2026 they were the best-paid of all nine Styles there: +13.4% a year in dollars, against +9.4% for the average ranked US share, from about 570 shares at a time.
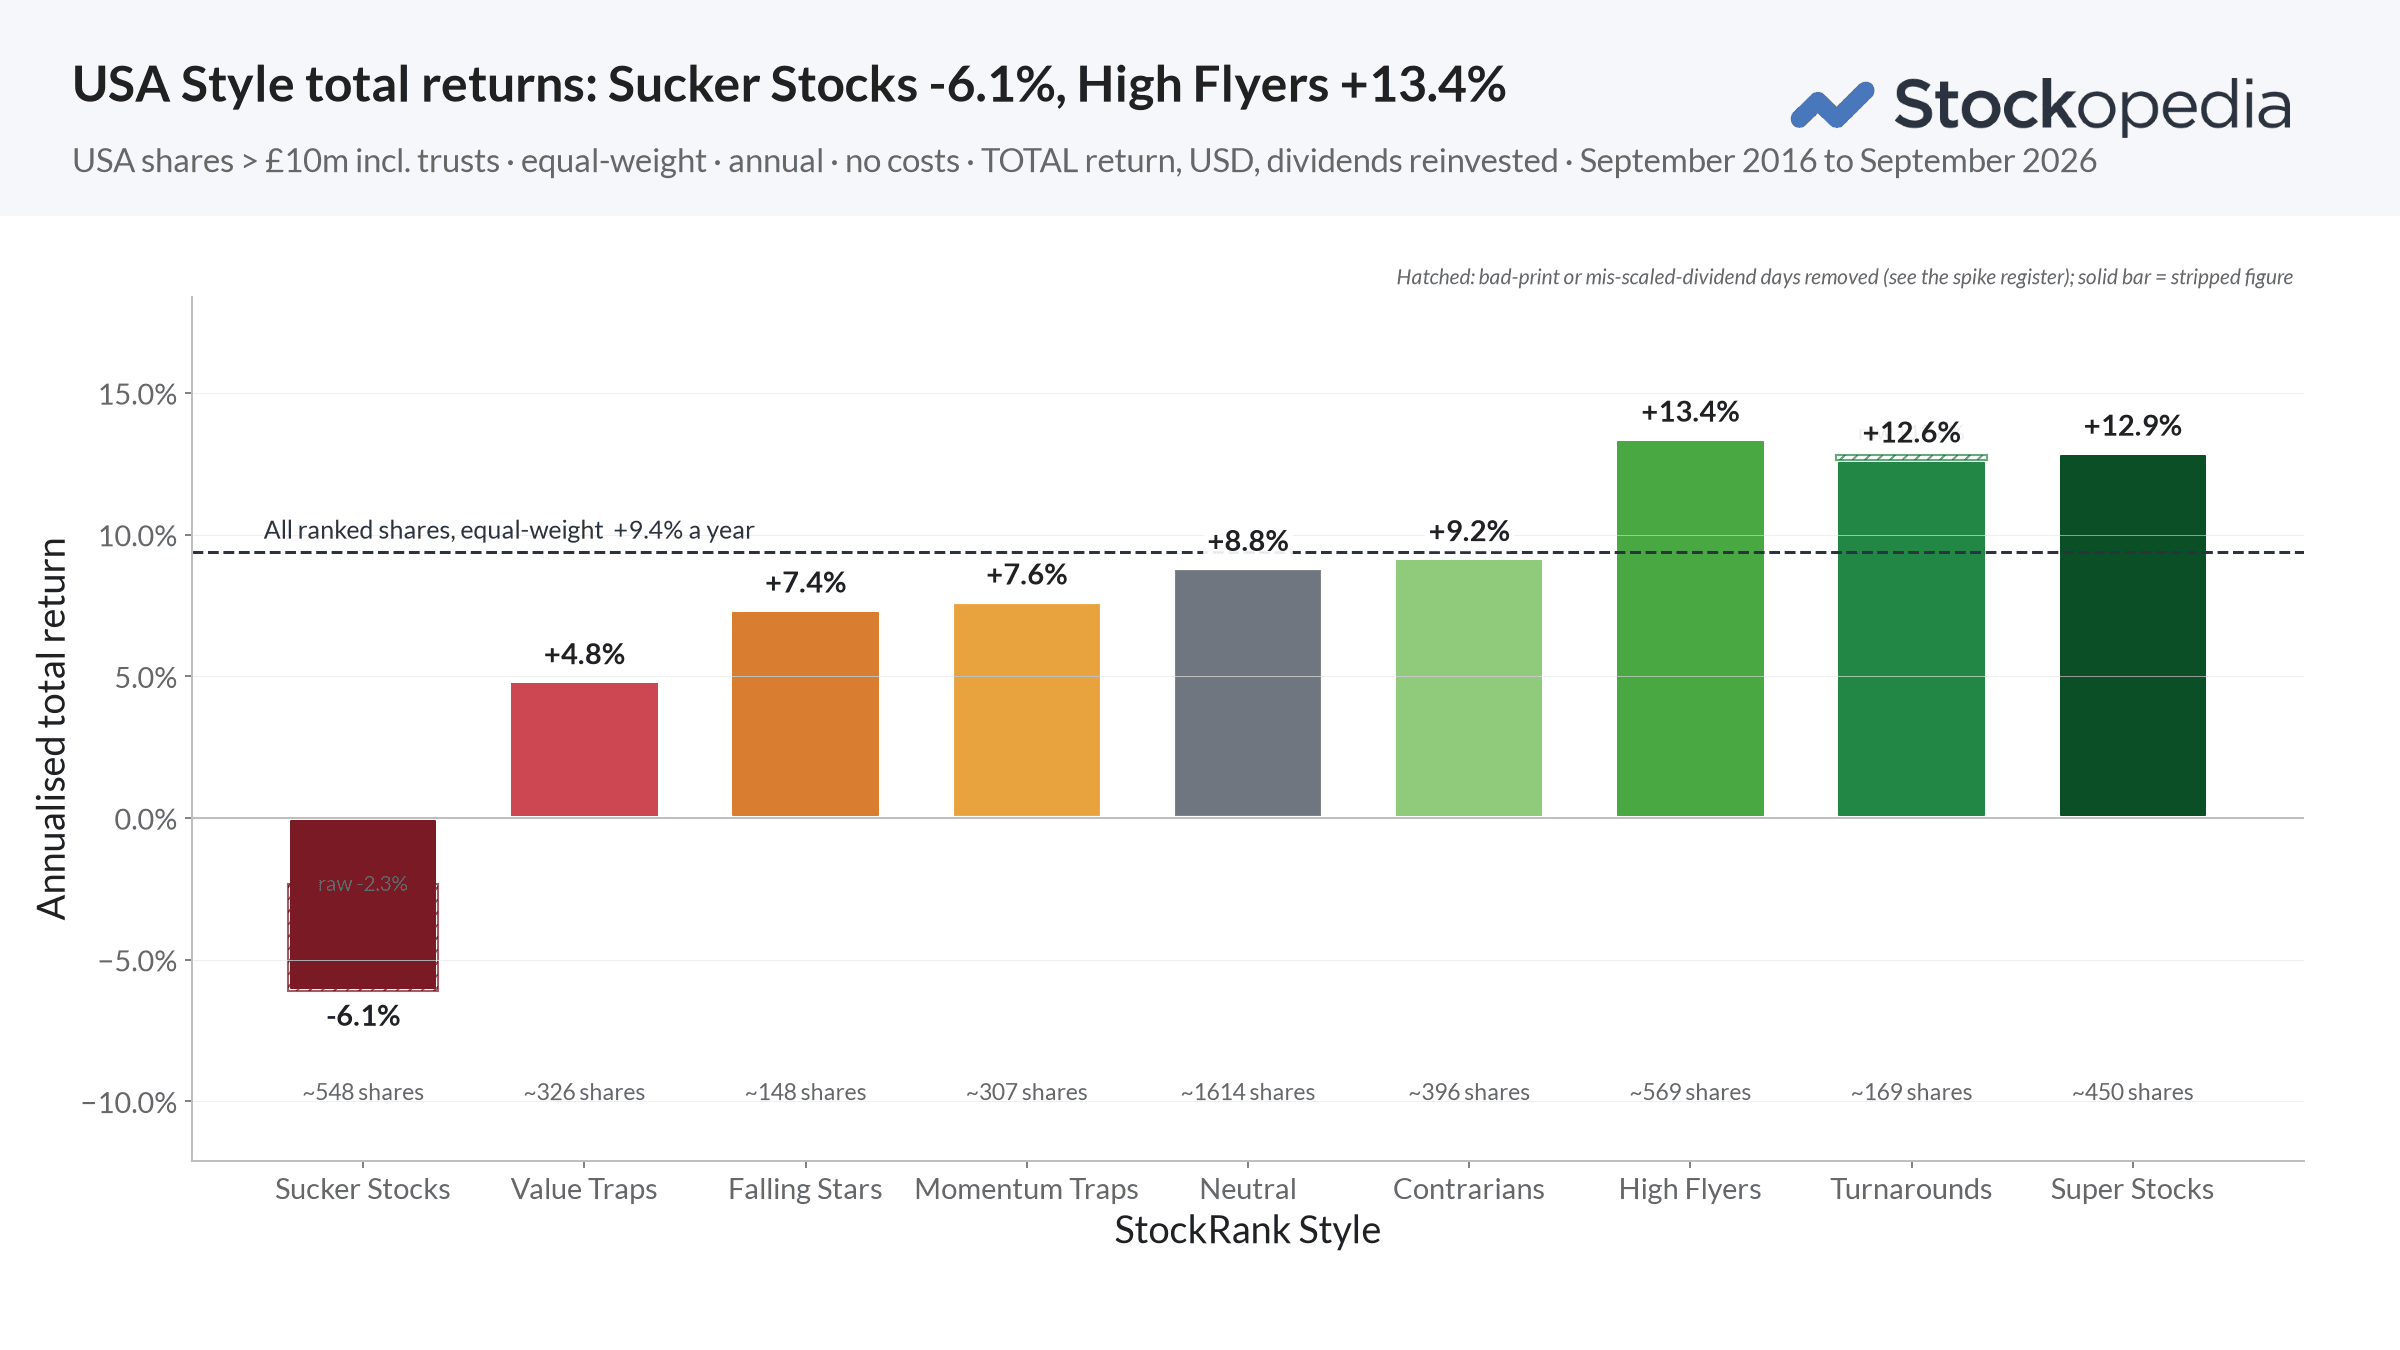
US shares above £10m including trusts, held equal-weight and rebalanced once a year, September 2016 to September 2026, total return in US dollars with dividends reinvested, no dealing costs. Past performance is not a reliable indicator of future results.
Compare the two markets over the same ten years. UK High Flyers returned +7.8% a year against +6.2% for the average ranked UK share, an edge of 1.6 points. In the US the edge was 4.0 points, two and a half times as large. High Flyers also ranked second of the nine Styles in Europe. In the UK, by contrast, they were the weakest of the four winning Styles over the decade. They still pay here, but the US is where buying expensive quality with momentum has paid best.
We compared the two markets side by side in our webinar Four kinds of share lose money. Do you own one?, and the replay shows how to check which Styles your own shares fall into.
Why value investors miss them
We're hard-wired to look for bargains, and in the stock market that instinct is usually right. Sort the market by the Stockopedia Value Rank and, over most multi-year windows, the cheapest fifth has beaten the most expensive fifth. It is one of the oldest and best documented findings in investing. So any rational investor picking a portfolio would go shopping among the cheap shares... right?
Here's the blind spot. That finding is an average, and averages hide a great deal. Nestled among the expensive shares are some of the best companies on the London Stock Exchange, businesses that have trounced the market for years because they deserved their premium ratings. The trick is to separate them from the expensive shares that don't, and that is what Quality and Momentum do. An expensive share that is also high quality and rising is a very different proposition from one that is merely expensive.
Value investors who stick to quality and value are effectively Contrarians. It's a smart and profitable strategy, but it deliberately removes momentum from the picture, and it will never let you own a share like Diploma. Over the thirteen years, High Flyers out-earned Contrarians by 1.7 points a year.
The investors who bought high
Some of the most successful investors of the last fifty years built their careers on this idea.
Richard Driehaus, profiled in Jack Schwager's The New Market Wizards[1], studied the great stock market winners and realised he could never have bought them on low P/E ratios: "Many of the best growth stocks have high multiples and are psychologically difficult to buy." So he tore up the rule book and generated 30% annualised returns over twelve years:
"One market paradigm that I take exception to is: Buy low and sell high. I believe that far more money is made buying high and selling at even higher prices. That means buying stocks that have already had good moves and have high relative strength - that is, stocks in demand by other investors."
William O'Neil, author of How to Make Money in Stocks[2] and founder of Investor's Business Daily, went further. In his study of the greatest winners from 1953 to 1995, the "beginning P/Es for most big winners ranged from 25 to 50, and the P/E expansions varied from 60 to 115." His conclusion:
For years analysts have used P/E ratios as their basic measurement tool in deciding whether a stock is undervalued and should be bought… but our ongoing analysis of the most successful stocks from 1880 to the present shows that P/E ratios were not a relevant factor in price movement.
How a High Flyer ends: the two exits
Few shares stay High Flyers for long, especially in the UK, where the market is much smaller than in the US. Diploma and Halma are the exceptions. Most spend a couple of years as a High Flyer before either the stock or the company runs out of steam, and each has its own Style.
The stock runs out of steam: Falling Star. Expensive shares are fragile because the market expects so much of them. When a High Flyer disappoints, momentum turns and it becomes a Falling Star: still a good company, still expensive, but with the price now falling. Finding a floor is hard, because a high P/E has a long way to contract. Boohoo was a High Flyer through 2020, became a Falling Star at 337p in March 2021, and was 27p by August 2024. Over the thirteen years Falling Stars returned -0.1% a year. Same quality, same valuations, one factor fewer, and nine percentage points a year gone.
The company runs out of steam: Momentum Trap. Less often, the fundamentals deteriorate while the share price keeps rising. Quality fades, and the High Flyer becomes a Momentum Trap. These are most common in bubbles, when the market loses touch with the underlying business. Momentum Traps returned +1.2% a year over the same period.
The test, every time a High Flyer you own turns down, is which of the two is happening. Diploma shows what to look for. For one month in 2022 it was a Falling Star, which is the red sliver on the chart above. But the quality bar never went red. The business carried on earning high returns on capital; only the share price had paused. Momentum came back, it was reclassified as a High Flyer again, and the compounding resumed. A stock running out of steam can recover. A company running out of steam usually doesn't.
Finding and managing High Flyers
Every StockReport shows the StockRank Style at the top, and the Stock Screener can filter for the High Flyer Style directly. That gives you the pool. Managing it takes a little more discipline than a value portfolio:
Expect a bumpier ride. High Flyers are more volatile than the market, and with strong momentum they can reverse sharply.
Rebalance regularly. Because most High Flyers only stay High Flyers for a couple of years, the strategy works by rotating into the next set before the last set runs out of steam.
Watch the Style like a hawk. Sell when momentum or quality turns, unless you're confident the company has a durable economic moat and the valuation isn't stretched. In that case, it can pay to hold through a correction.
Get that right and, every so often, you'll find a multi-year compounder like Diploma: the kind of share that comes along only a few times a decade, and that a value screen would never have shown you. For a full guide to running a growth portfolio, see Adventurous Growth; for holding the rare long-term compounders, see Compounding Quality.