

Most investors can name the share that taught them their most expensive lesson. Often it was one they understood better than anyone. The technology was brilliant, the accounts looked wonderful, and the story was compelling. Then it went wrong anyway.
The story is why you bought the share. It is not what you own.
At our webinar Four kinds of share lose money. Do you own one?, we asked around 650 investors which of these sounded most like a share they had lost money on.
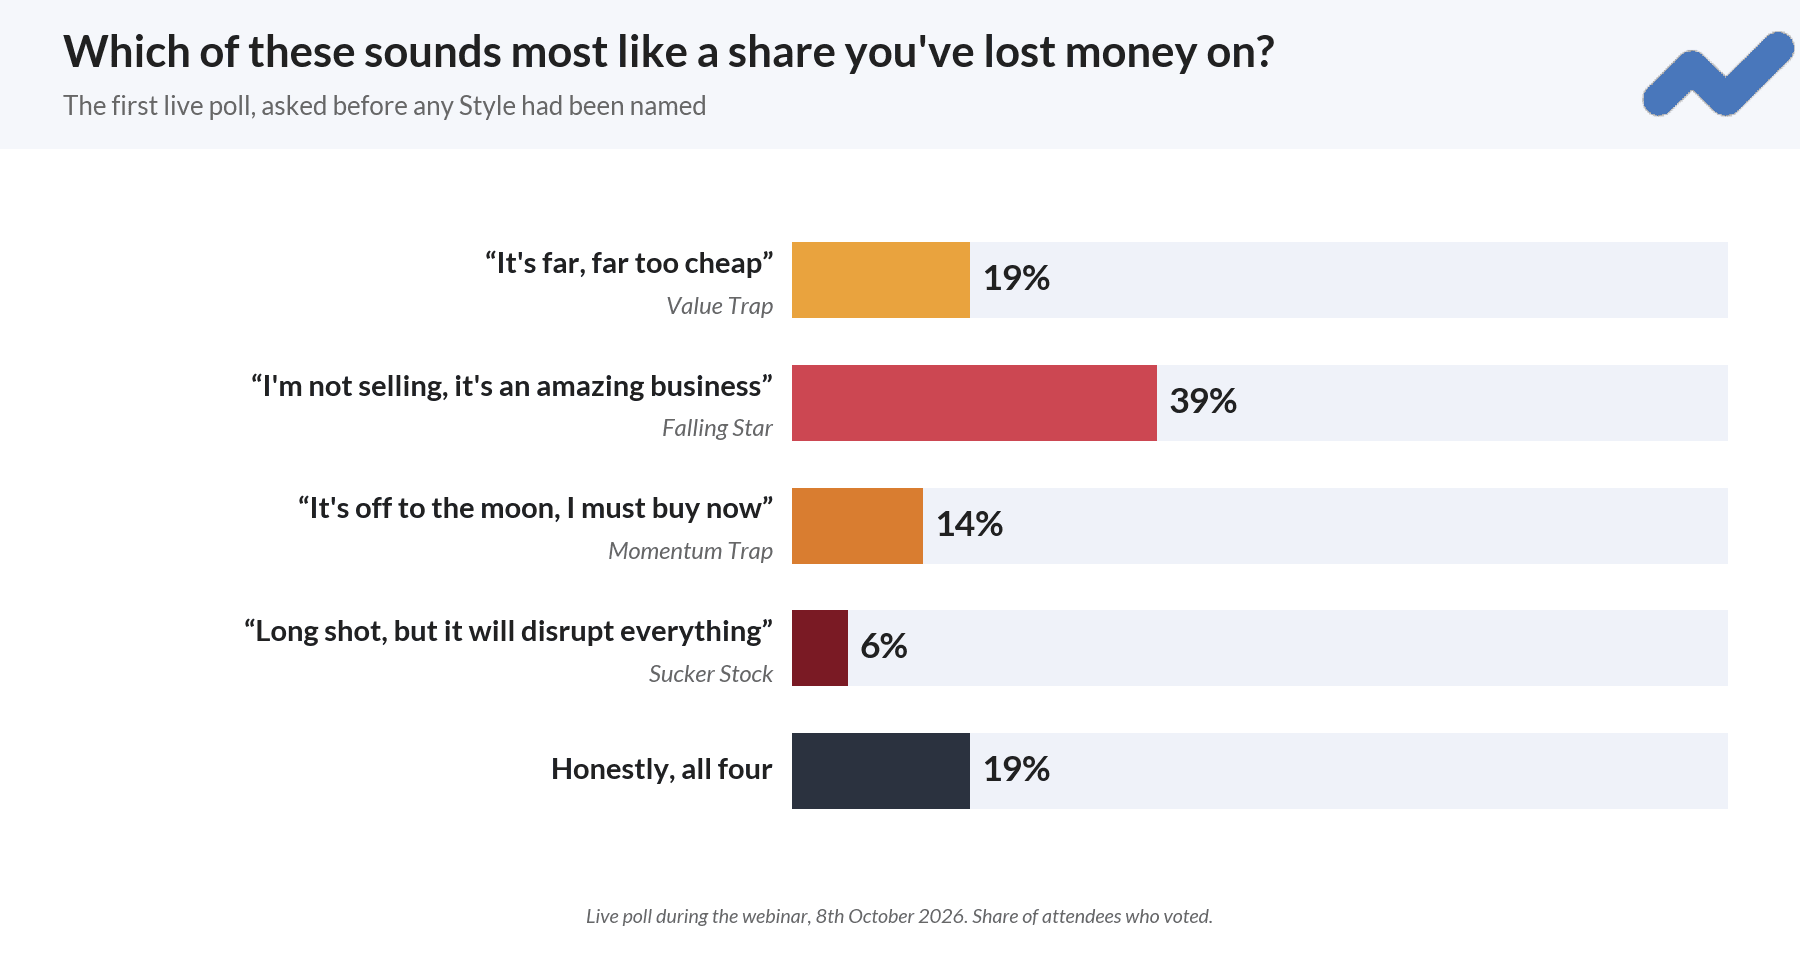
The most popular answer, at 39%, was "I'm not selling, it's an amazing business". Almost one in five owned up to all four. Every one of those answers is a story, and each sounds like a perfectly good reason to own a share. That is exactly the problem.
Know what kind of story you own
Peter Lynch, the legendary manager of Fidelity's Magellan fund, had a simple habit that protected him from his own stories. Before he did anything else, he put every share into one of six categories: slow growers, stalwarts, fast growers, cyclicals, asset plays and turnarounds. In One Up on Wall Street he explained why:
Putting stocks in categories is the first step in developing the story. Now at least you know what kind of story it's supposed to be.
A category does what a story can't. It tells you what you actually own, and what that kind of share has tended to do next. Lynch even had a name for his favourite category: "the fast growers - the superstocks that deserve the most attention."
The StockRank Styles are our version of Lynch's categories, with one big difference. They are built from data rather than judgement, so every share in the market gets one, and it changes as the numbers change.
Three questions for every share
Decades of research point to three things that drive share prices over time: good companies tend to beat poor ones, cheap shares tend to beat expensive ones, and rising shares tend to keep rising. Stockopedia's StockRanks score every share on all three. At the top of every StockReport you'll find a Quality Rank ("Is it good?"), a Value Rank ("Is it cheap?") and a Momentum Rank ("Is it improving?"), each from 0 to 100 against the rest of the market.
The ideal share is good, cheap and improving. But a share doesn't need all three to be worth owning. What matters is how many are on your side. Strong on at least two of the three, meaning well above 50, and the odds are in your favour. Weak on at least two, well below 50, and they are against you. The combinations give eight kinds of share, which we call the StockRank Styles: four winning Styles and four losing ones.
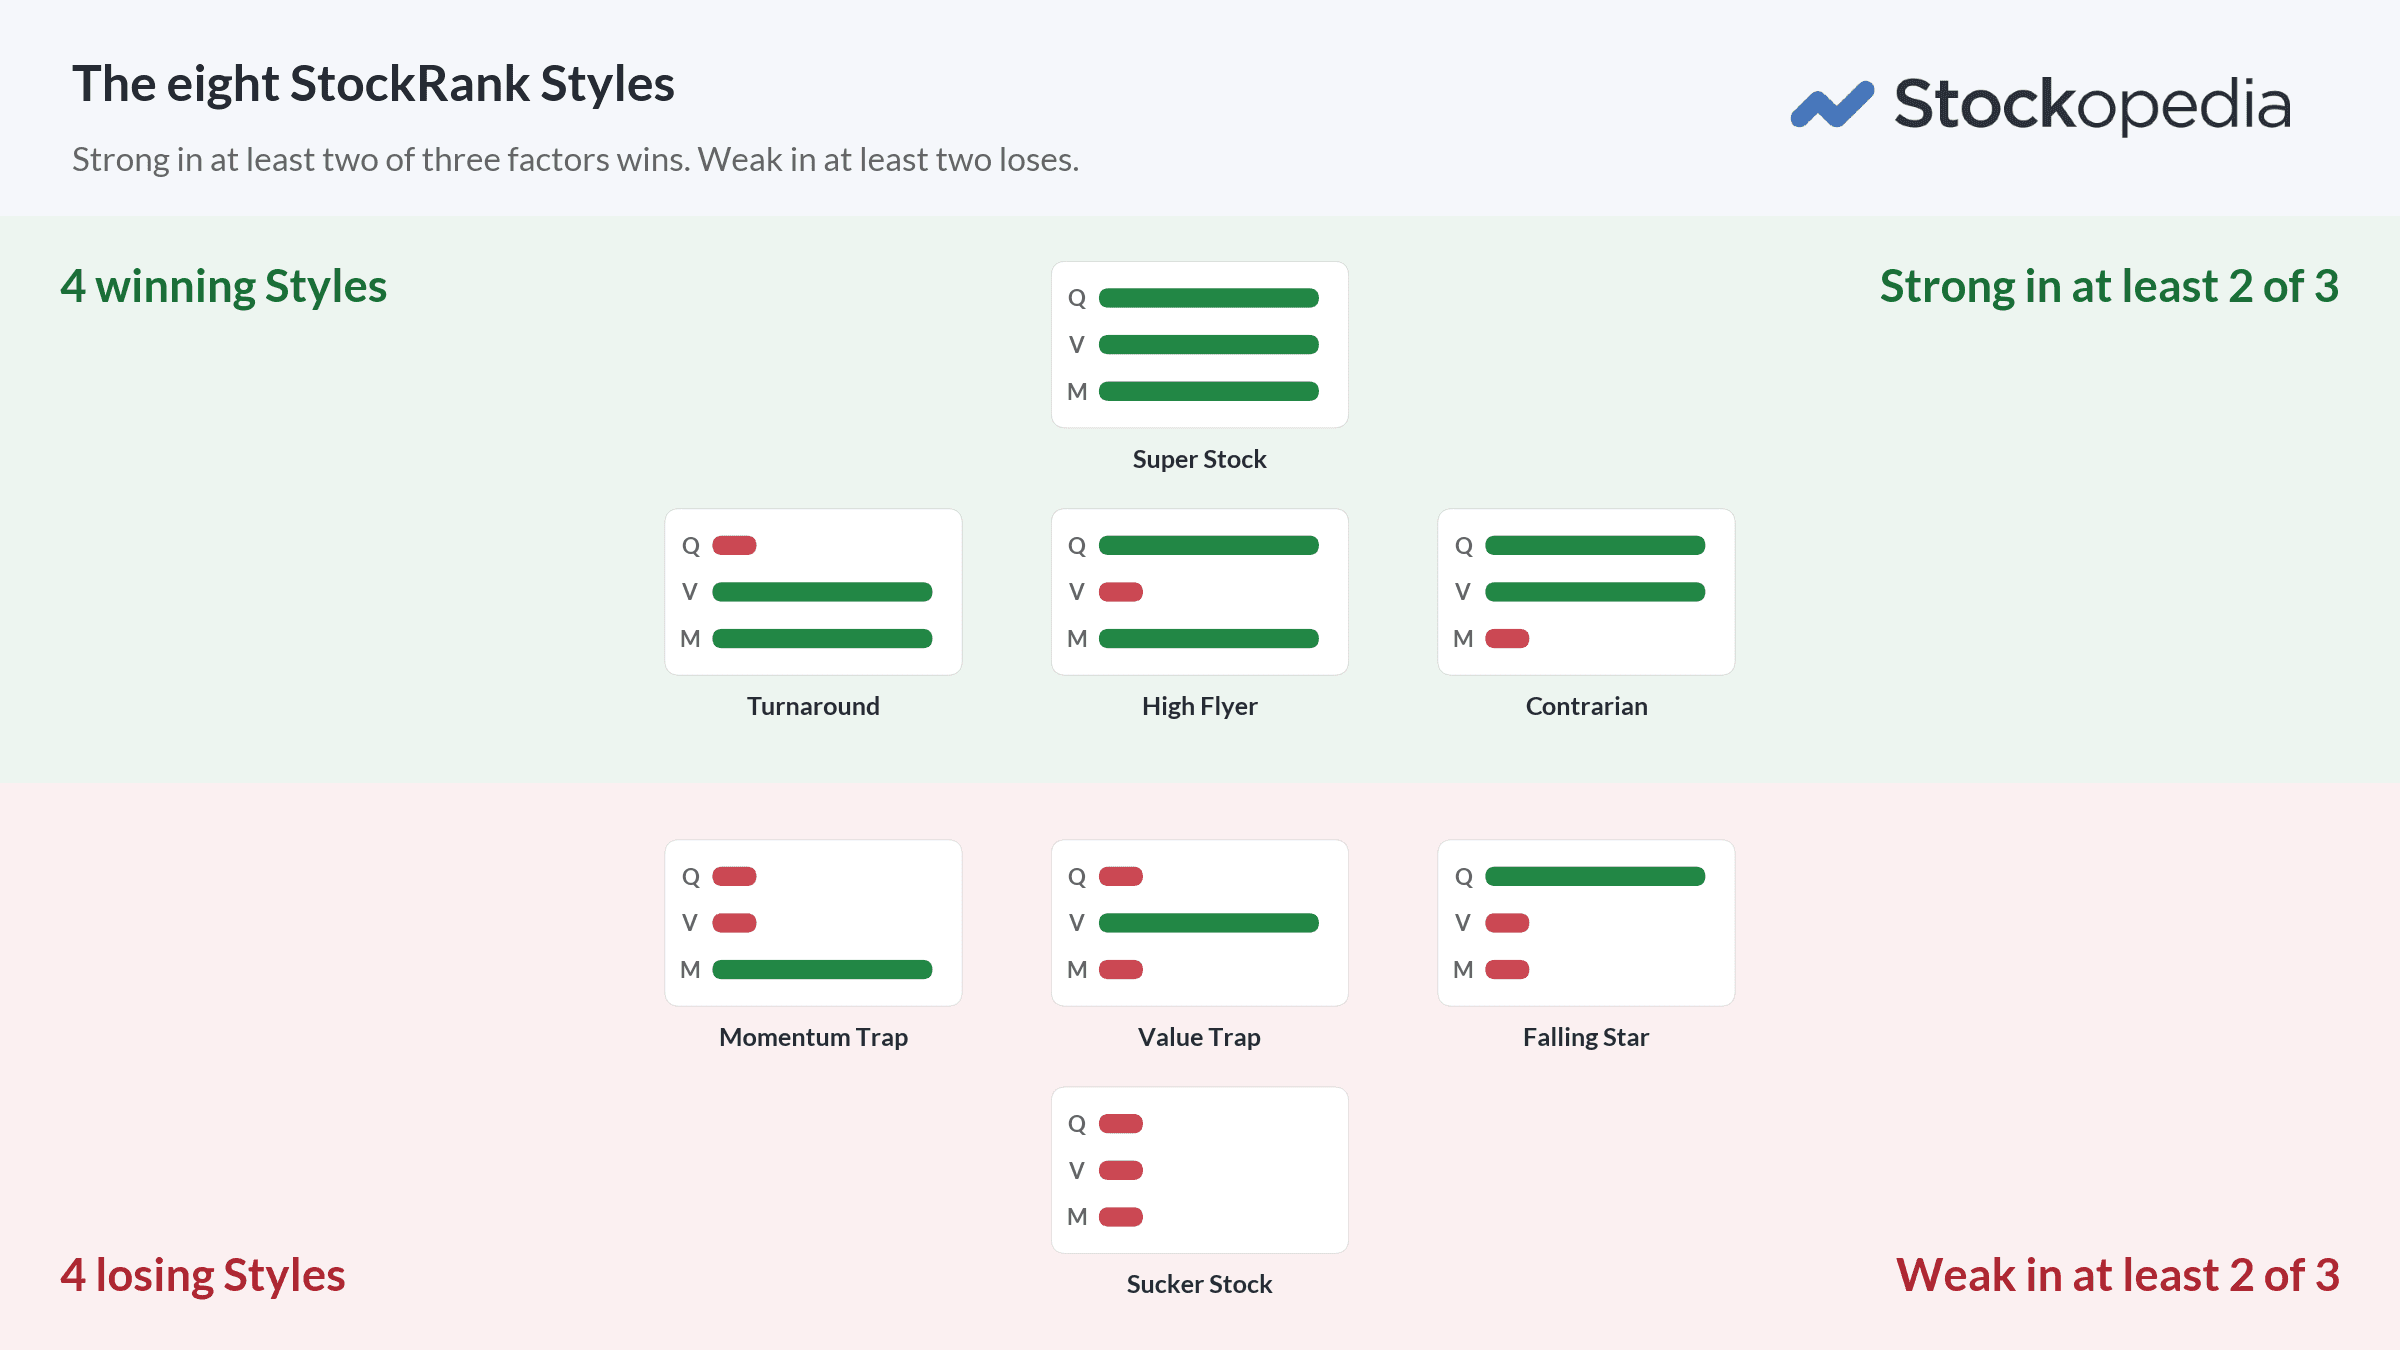
Now go back to the poll. "It's far, far too cheap" describes a Value Trap: cheap, but neither good nor improving. "I'm not selling, it's an amazing business" is a Falling Star: good, but expensive and falling. "It's off to the moon, I must buy now" is a Momentum Trap: rising, but neither good nor cheap. "Long shot, but it will disrupt everything" is a Sucker Stock, with none of the three. Every answer in the poll was a losing Style.
There is a ninth group. About a third of shares sit somewhere in the middle, with no rank clearly strong or weak, and don't fit any Style. We call them Style Neutral. As the numbers below show, they have behaved like the average share.
Performance study of the StockRank Styles
So what has each Style actually paid? We have measured every one of them in the UK market, where we have the longest StockRanks history. The chart shows what each Style paid, with the average UK share as the reference line.
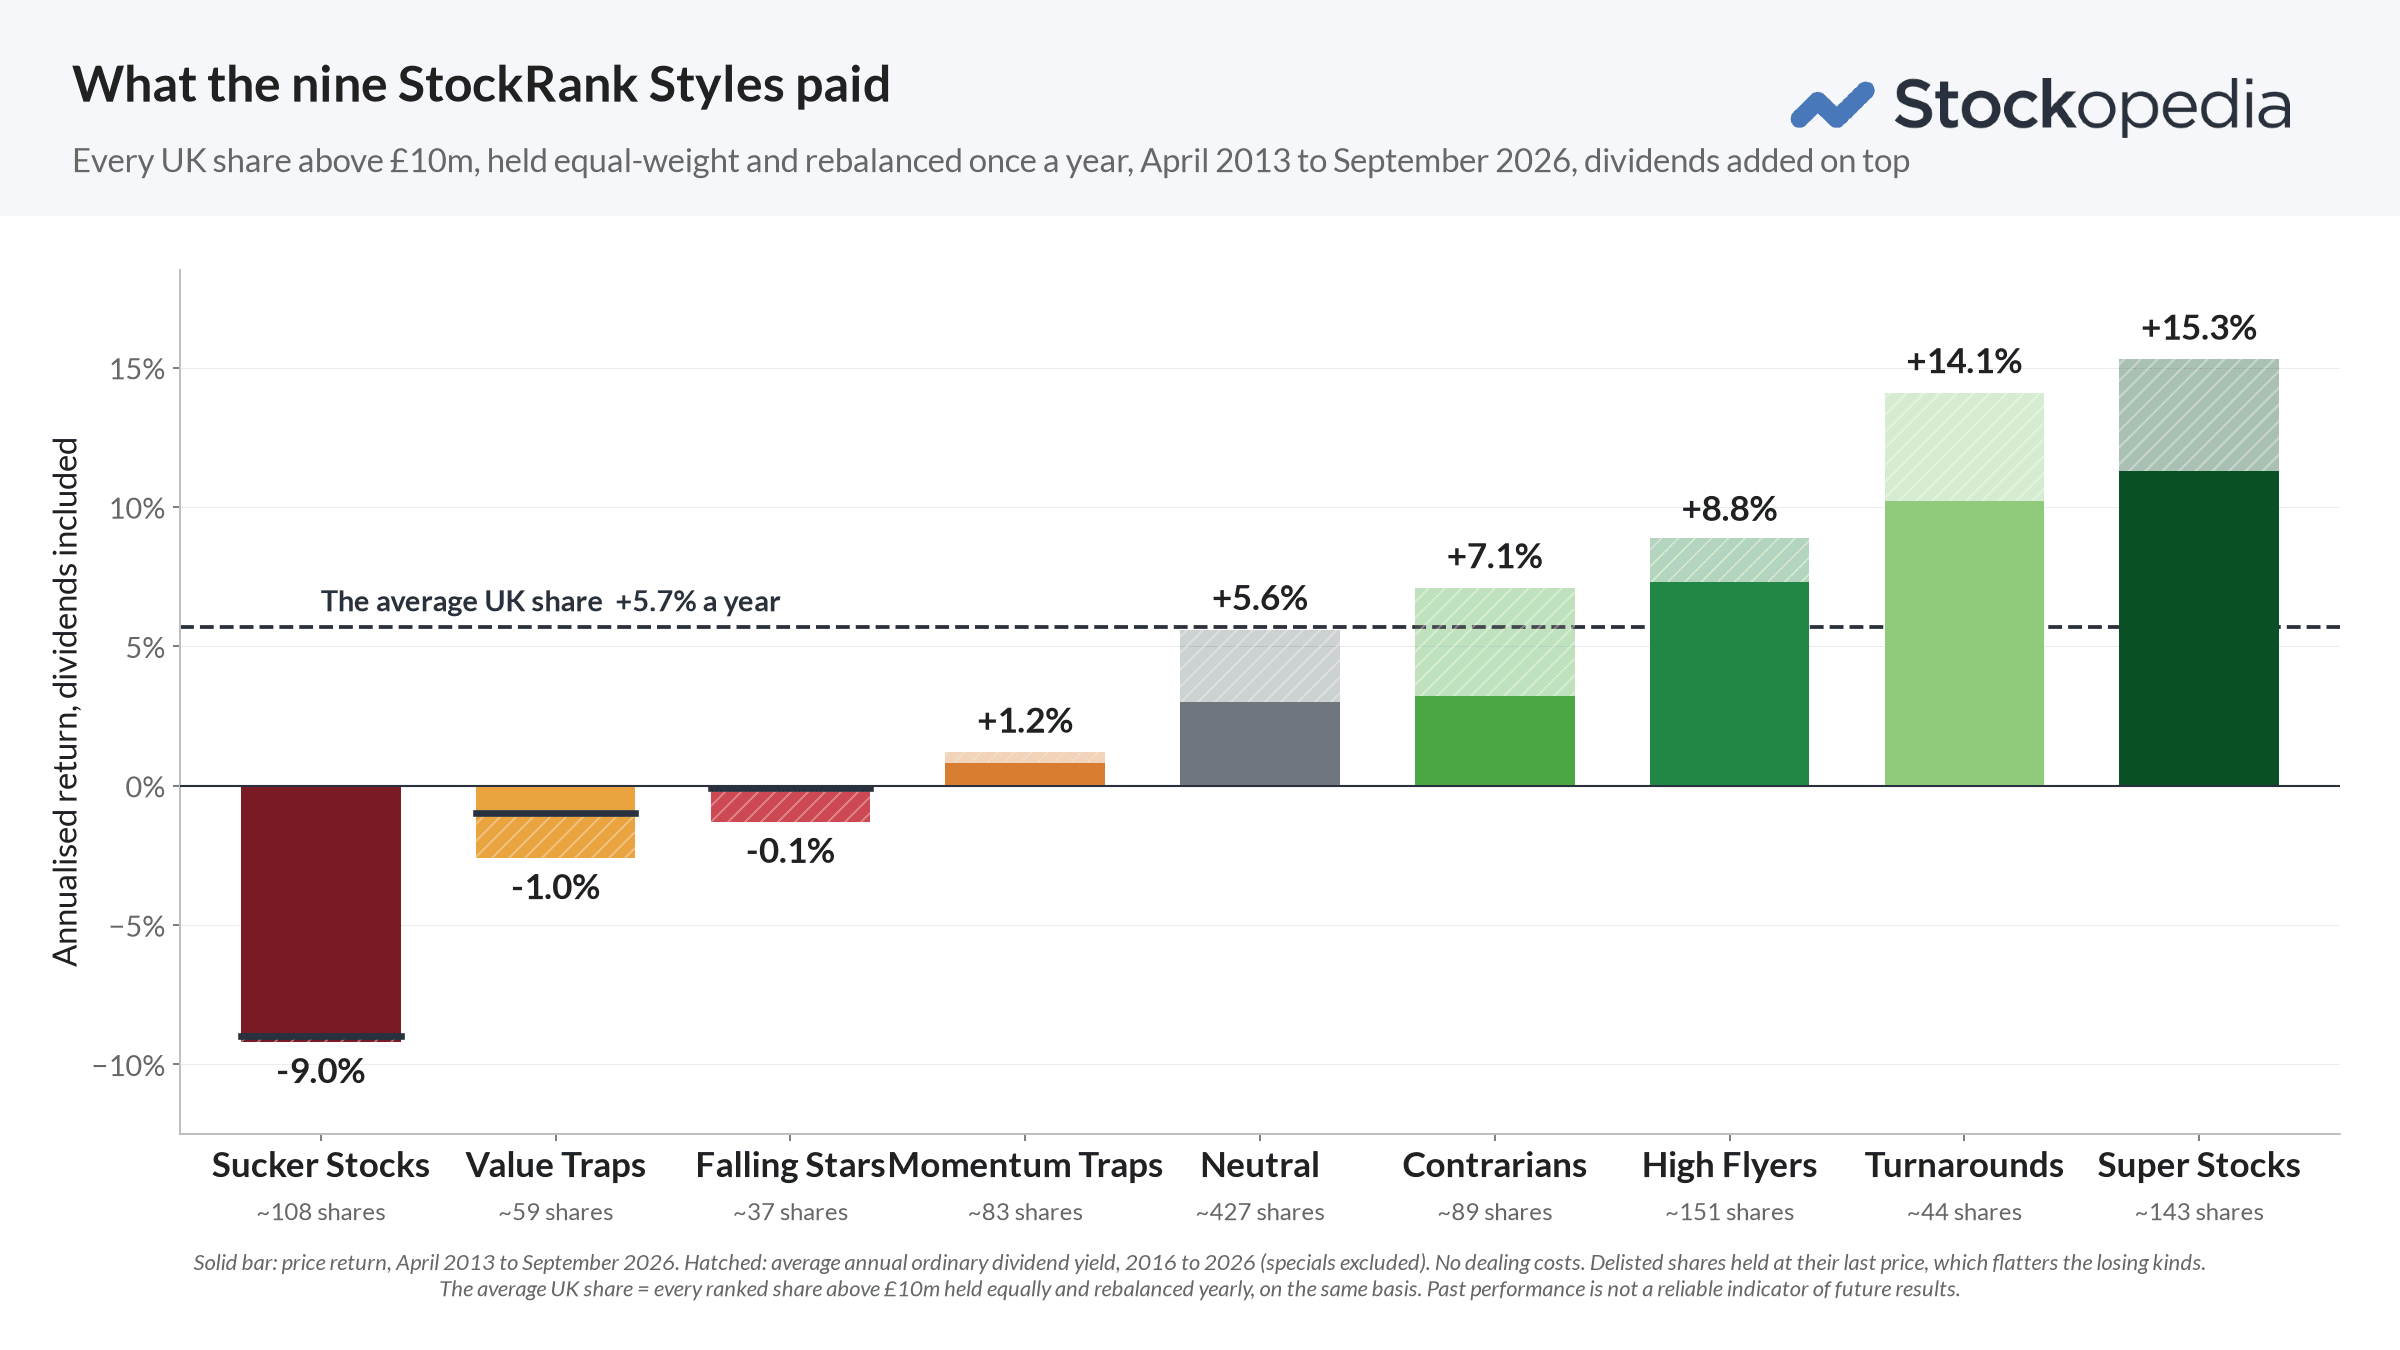
UK shares above £10m, held equal-weight and rebalanced once a year, April 2013 to September 2026, price return plus the average ordinary dividend yield measured 2016 to 2026, no dealing costs. Past performance is not a reliable indicator of future results.
All four winning Styles beat the average UK share, which returned +5.7% a year. Super Stocks led at +15.3% a year, followed by Turnarounds at +14.1%, High Flyers at +8.8% and Contrarians at +7.1%. All four losing Styles trailed it: Momentum Traps +1.2%, Falling Stars -0.1%, Value Traps -1.0% and Sucker Stocks -9.0%. Neutral shares returned +5.6%, which is the average share. In price terms alone, £100 in Super Stocks became £420 over the period. £100 in the average share became £157. £100 in Sucker Stocks became £28.
Lay the same eight cards out so that quality and value set the column and momentum sets the row, and the gap has a single source. Momentum is the hinge. In every column, losing it cost between 8 and 15 percentage points a year. Super Stocks at +15.3% became Contrarians at +7.1%. High Flyers at +8.8% became Falling Stars at -0.1%. Turnarounds at +14.1% became Value Traps at -1.0%. Momentum Traps at +1.2% became Sucker Stocks at -9.0%. So avoid buying a value stock unless it is either good or improving, avoid momentum stocks unless they are good or cheap, and shun expensive glamour stocks as soon as they accelerate into declines.
The rule, in Ed Croft's words: never buy a share with fewer than two strong factors.
Does it hold outside the UK?
We have checked the same classification on about 10,000 shares worldwide over the ten years to September 2026, in sterling with dividends reinvested. The extremes repeat. Turnarounds (+14.1%), Super Stocks (+13.3%) and High Flyers (+11.3%) beat the average global share at +8.5%, and Sucker Stocks lost 6.8% a year. The middle does not. Value Traps returned +7.9% worldwide and Contrarians +7.7%, both close to the average. So "all four losing Styles lose" is a UK finding. The global figures are less audited than the UK ones and are translated into sterling, so treat them as a check rather than a second study. The chart is in the Contrarians article.
From Styles to strategies
The StockRank Styles line up neatly with the seven stock market strategies in our Strategy Map series. The strategies that combine two or three factors each hunt in a winning Style. Every strategy also has a trap share to watch out for, one that looks like the real thing. For the three purer strategies, it's the losing Style built on the same single factor.
Winning profiles
The following four combinations are classic successful investment styles, practised by some of the greats of investing. They have also posted strong results in Stockopedia’s performance study. Each has its own article in this series.
Super Stocks
Q: strong, V: strong, M: strong (good, cheap, improving). Super Stocks returned +15.3% a year, the best of the nine.
The term "Super Stock" comes from the late, great Professor Robert Haugen in The Inefficient Stock Market[1]. Haugen was the first to show that good, cheap, improving shares have a tendency to beat the market and we honour the great man by borrowing the phrase here. It can often go against one's instincts buying these kinds of shares as cheap stocks have problems, good stocks are boring, and stocks at highs are scary - this may be why they so often exceed expectations.
Contrarians
Q: strong, V: strong, M: weak (good and cheap, but declining). Contrarians returned +7.1% a year, and most of the edge over the average share was the dividend.
This is the domain of the classic value investing style so favoured by investors like Warren Buffett and Joseph Piotroski. Warren Buffett summed it up best by saying "I like buying quality merchandise when it's been marked down". Joel Greenblatt popularised this strategy of buying good, cheap stocks in his excellent The Little Book that Beats the Market[2].
High Flyers
Q: strong, V: weak, M: strong (good and improving, but expensive). High Flyers returned +8.8% a year.
These are the stock market stars, the ones that all fund managers want to be able to say they own. They tend to be very high quality growing stocks with a history of beating estimates, just don't expect this kind of stock to come cheap. Bill O'Neil's classic How to Make Money in Stocks[3] is a classic - it shows that if you want to own the really big winners in the market you'd better be willing to pay a premium P/E ratio. Amongst this category of stocks may lie some of the great multi-year compounders - just watch out, when the momentum finally turns these can easily turn into Falling Stars (see below).
Turnarounds
Q: weak, V: strong, M: strong (cheap and improving, but low quality). Turnarounds returned +14.1% a year, though this is the thinnest bucket at about 44 shares and the least robust of the winning numbers.
There's nothing better than picking up a seemingly broken stock in the bargain basement and watching it multi-bag, like Paul Scott did with Trinity Mirror in 2013. Value and Momentum are widely regarded as the two strongest factors driving asset returns. Even if a stock is currently losing money, the first indicator of recovery is often an improving share price - so buying cheap stocks on the rise can be hugely effective. James O'Shaughnessy in his classic What Works on Wall Street[4] found that "Trending Value is the best performing strategy since 1963".
Losing profiles
These are the four Styles behind the poll answers at the top of this article. Each is a common trap, and each comes with its own convincing line of reasoning. Shares exposed to only a single QVM driver, or none, may be alluring to the novice, but all four trailed the average UK share over thirteen years. These kinds of story stocks often come with hopes of jam tomorrow, blue-sky promise or eventual recovery. They also tend not to pay dividends, which is a large part of why they lag.
Falling Stars
"I'm not selling, it's an amazing business." The line 39% of our webinar audience picked, more than any other.
Q: strong, V: weak, M: weak (good, expensive, deteriorating). Falling Stars returned -0.1% a year.
Oh, you don't want to be on the wrong side of a High Flyer when it turns. When brokers start aggressively cutting their estimates on high quality, premium shares look out below. This is the classic profile of stocks like Asos when they start to drop. Falling Stars are the bane of fund managers around the world.
Value Traps
"It's far, far too cheap."
Q: weak, V: strong, M: weak (junk, cheap, deteriorating). Value Traps returned -1.0% a year in the UK, though they did not lose money worldwide.
The great modern value investor, Seth Klarman, has warned "value traps are a dagger through the heart of value investing". This is the domain of broken business models, sectors in decline and generally one of the worst places to be in the market. The key lesson to learn is to give loss making, out of favour, cheap shares a wide berth unless they start to show confirming factors.
Momentum Traps
"It's off to the moon, I must buy now."
Q: weak, V: weak, M: strong (junk, expensive, improving). Momentum Traps returned +1.2% a year.
These stocks may be currently in vogue with strong share prices and sentiment, but deteriorating fundamentals and high valuations can't continue to contradict. The valuation has to fall, or the fundamentals have to improve. Either way something has to change and the risks are to the downside.
Sucker Stocks
"Long shot, but it will disrupt everything."
Q: weak, V: weak, M: weak (junk, expensive, deteriorating). Sucker Stocks returned -9.0% a year: £100 became £28 before dividends, and the dividends were 0.2%.
Why on earth would anybody want to own stocks that have literally nothing going for them? Yet many thousands do. These tend to be small cap, loss-making, jam-tomorrow, story stocks that are in the process of losing the market's faith. You can be pretty sure that a stock like this comes with a really promising idea, and an emergency fund raising just around the corner. Give these a wide berth, or use a bargepole.
Finding the StockRank Styles
Every stock in the market carries its StockRank Style label at the top of its StockReport, alongside its Risk Rating and Size Group. It is the first thing to check before reading any further.
The Styles are also available in the Stock Screener and can be added to Table displays from our Ratio Library, so you can screen for any one of the nine Styles on its own or combine a Style with a Risk Rating.