Super Stocks: Why multi-factor stock selection offers higher returns at lower risk

Most investors would love to own a good business, bought cheaply, whose share price is already moving the right way. Those shares exist, and they aren't rare. We call them Super Stocks - a term we've borrowed from the late, great Professor Robert Haugen who first coined it.
A Super Stock is good, cheap and improving. Its Quality, Value and Momentum ranks are all above 50, the top half of the market. It is the only one of the nine StockRank Styles with all three factors in its favour, and over thirteen years of UK data it has been the best paid: +15.3% a year, against +5.7% for the average UK share.
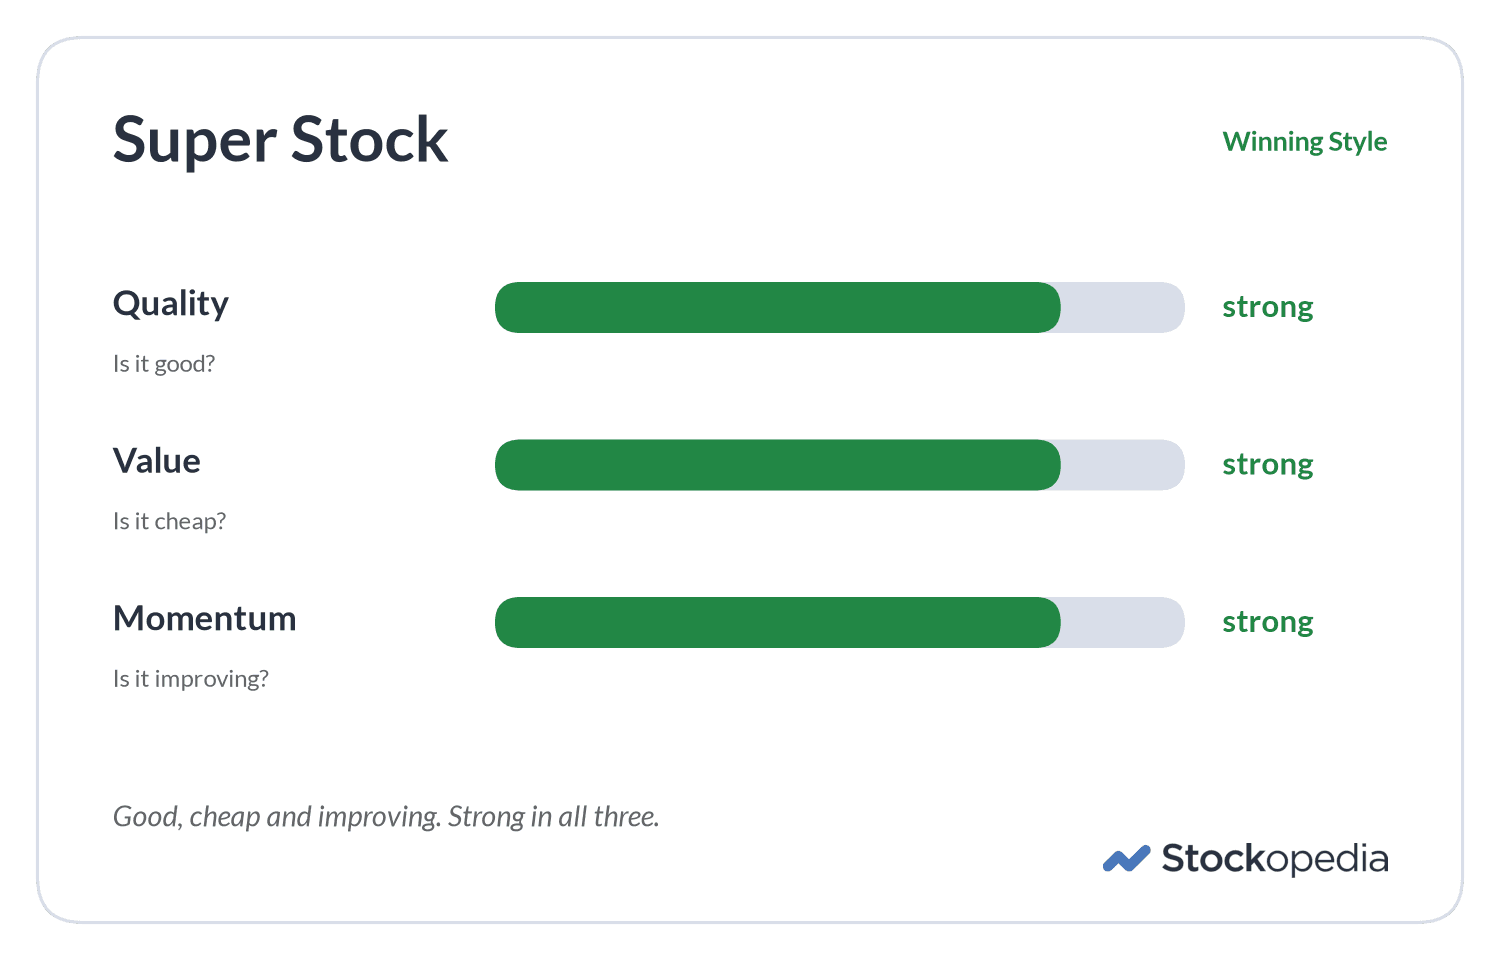
So why don't more investors own them? Because each factor asks you to do something that feels wrong. Value means buying shares nobody else wants. Quality often means steady, unexciting businesses with no story to tell. Momentum means buying shares that have already gone up, which most of us hate doing. Value looks risky, quality looks boring and momentum looks scary. Put all three together and you get a share few people get excited about. That's exactly why it tends to be underpriced.
None of this is new. Benjamin Graham was arguing for cheap, sound businesses in 1934, and Warren Buffett showed how well his followers did in The Superinvestors of Graham and Doddsville[^buffett-Warren Buffett paper on why markets aren't random]. Over the past few decades, quants have shown that rising shares tend to keep rising for up to a year. (There's more on the history of these factors here.) The rest of this article shows what Super Stocks have paid in the UK, and why combining all three factors beats using any one alone.
What Super Stocks paid
We have measured every one of the nine StockRank Styles across thirteen years of UK data (the full chart is in the series overview), and Super Stocks came out on top.
Compounded, that gap between +15.3% and +5.7% a year is large. Before dividends, £100 became £420, while £100 in the average share became £157. The dividend did its share of the work: Super Stocks yielded 4.0% a year on average, the highest of the nine Styles, while Sucker Stocks at the other end of the scale yielded 0.2%. A typical year held about 143 Super Stocks, so this is a broad bucket rather than a handful of names.
The three bars also show what a Super Stock turns into when one of them fades. Lose the value bar as the price runs up and it becomes a High Flyer, which returned +8.8% a year. Lose the momentum bar as the price falls and it becomes a Contrarian, which returned +7.1%. Both still beat the average share, but neither matched the full set.
Do riskier Super Stocks pay more?
Every stock also carries a Risk Rating, from Conservative to Highly Speculative. It is tempting to assume that the riskiest Super Stocks pay the most. The data says otherwise.
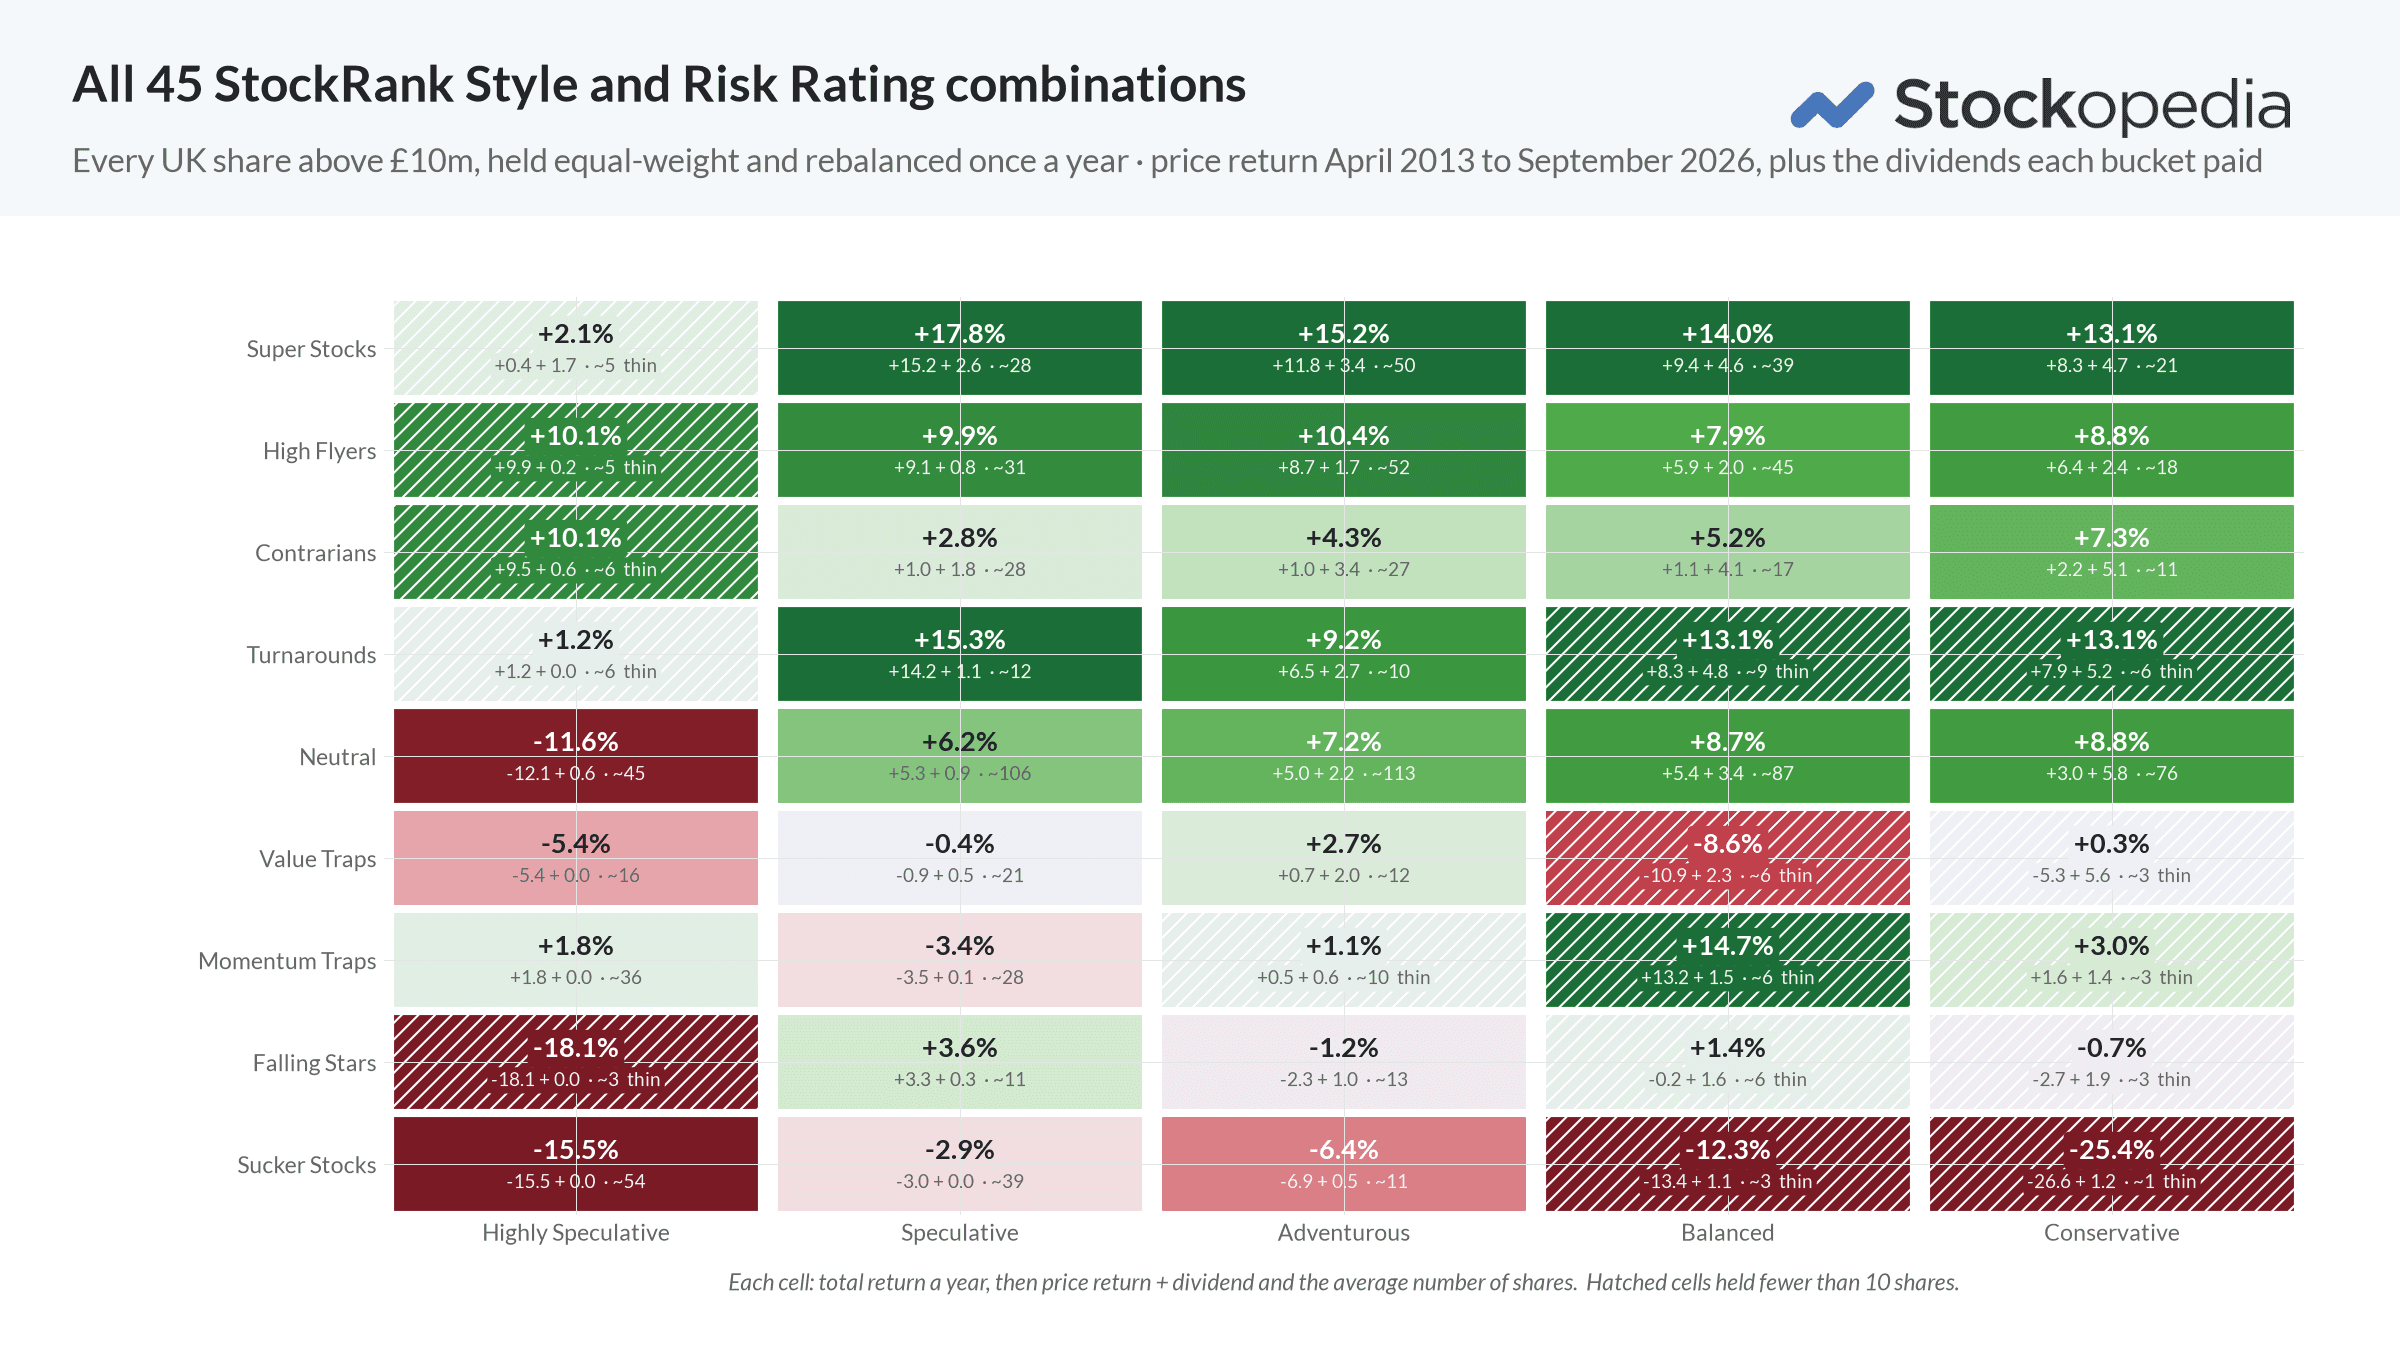
UK shares above £10m, held equal-weight and rebalanced once a year, April 2013 to September 2026, price return plus the average ordinary dividend yield measured 2016 to 2026, no dealing costs. Hatched cells held fewer than ten shares. Past performance is not a reliable indicator of future results.
Read along the top row. Super Stocks paid well at every Risk Rating with enough shares to measure: +13.1% a year in Conservative, +14.0% in Balanced, +15.2% in Adventurous and +17.8% in Speculative. Every one of those beats the average UK share by a wide margin.
Taking more risk did add some return, but you paid for it. Speculative Super Stocks earned 4.7 percentage points a year more than Conservative ones, with a worst fall of 38% against 27%. The calmer Super Stocks also earned more of their return as cash: dividends were worth 4.7% a year in Conservative against 2.6% in Speculative.
Then the pattern breaks. Highly Speculative Super Stocks returned just +2.1% a year from only five names, with a worst fall of 81%. So "the riskiest Super Stocks pay most" is not supported.
Now compare the bottom row. Sucker Stocks lost money at every Risk Rating, down to -15.5% a year among about 54 Highly Speculative names. Risk decided how rough the ride was. The Style decided whether you got paid.
We showed this live in our webinar Four kinds of share lose money. Do you own one?: switch a screen of Super Stocks from the Speculative tier to the Conservative one, and you keep most of the return for a much gentler ride.
A case study: Frontier Developments
The Style can change before the price does. That is the point of a classification built on data rather than on stories, and Frontier Developments shows it.
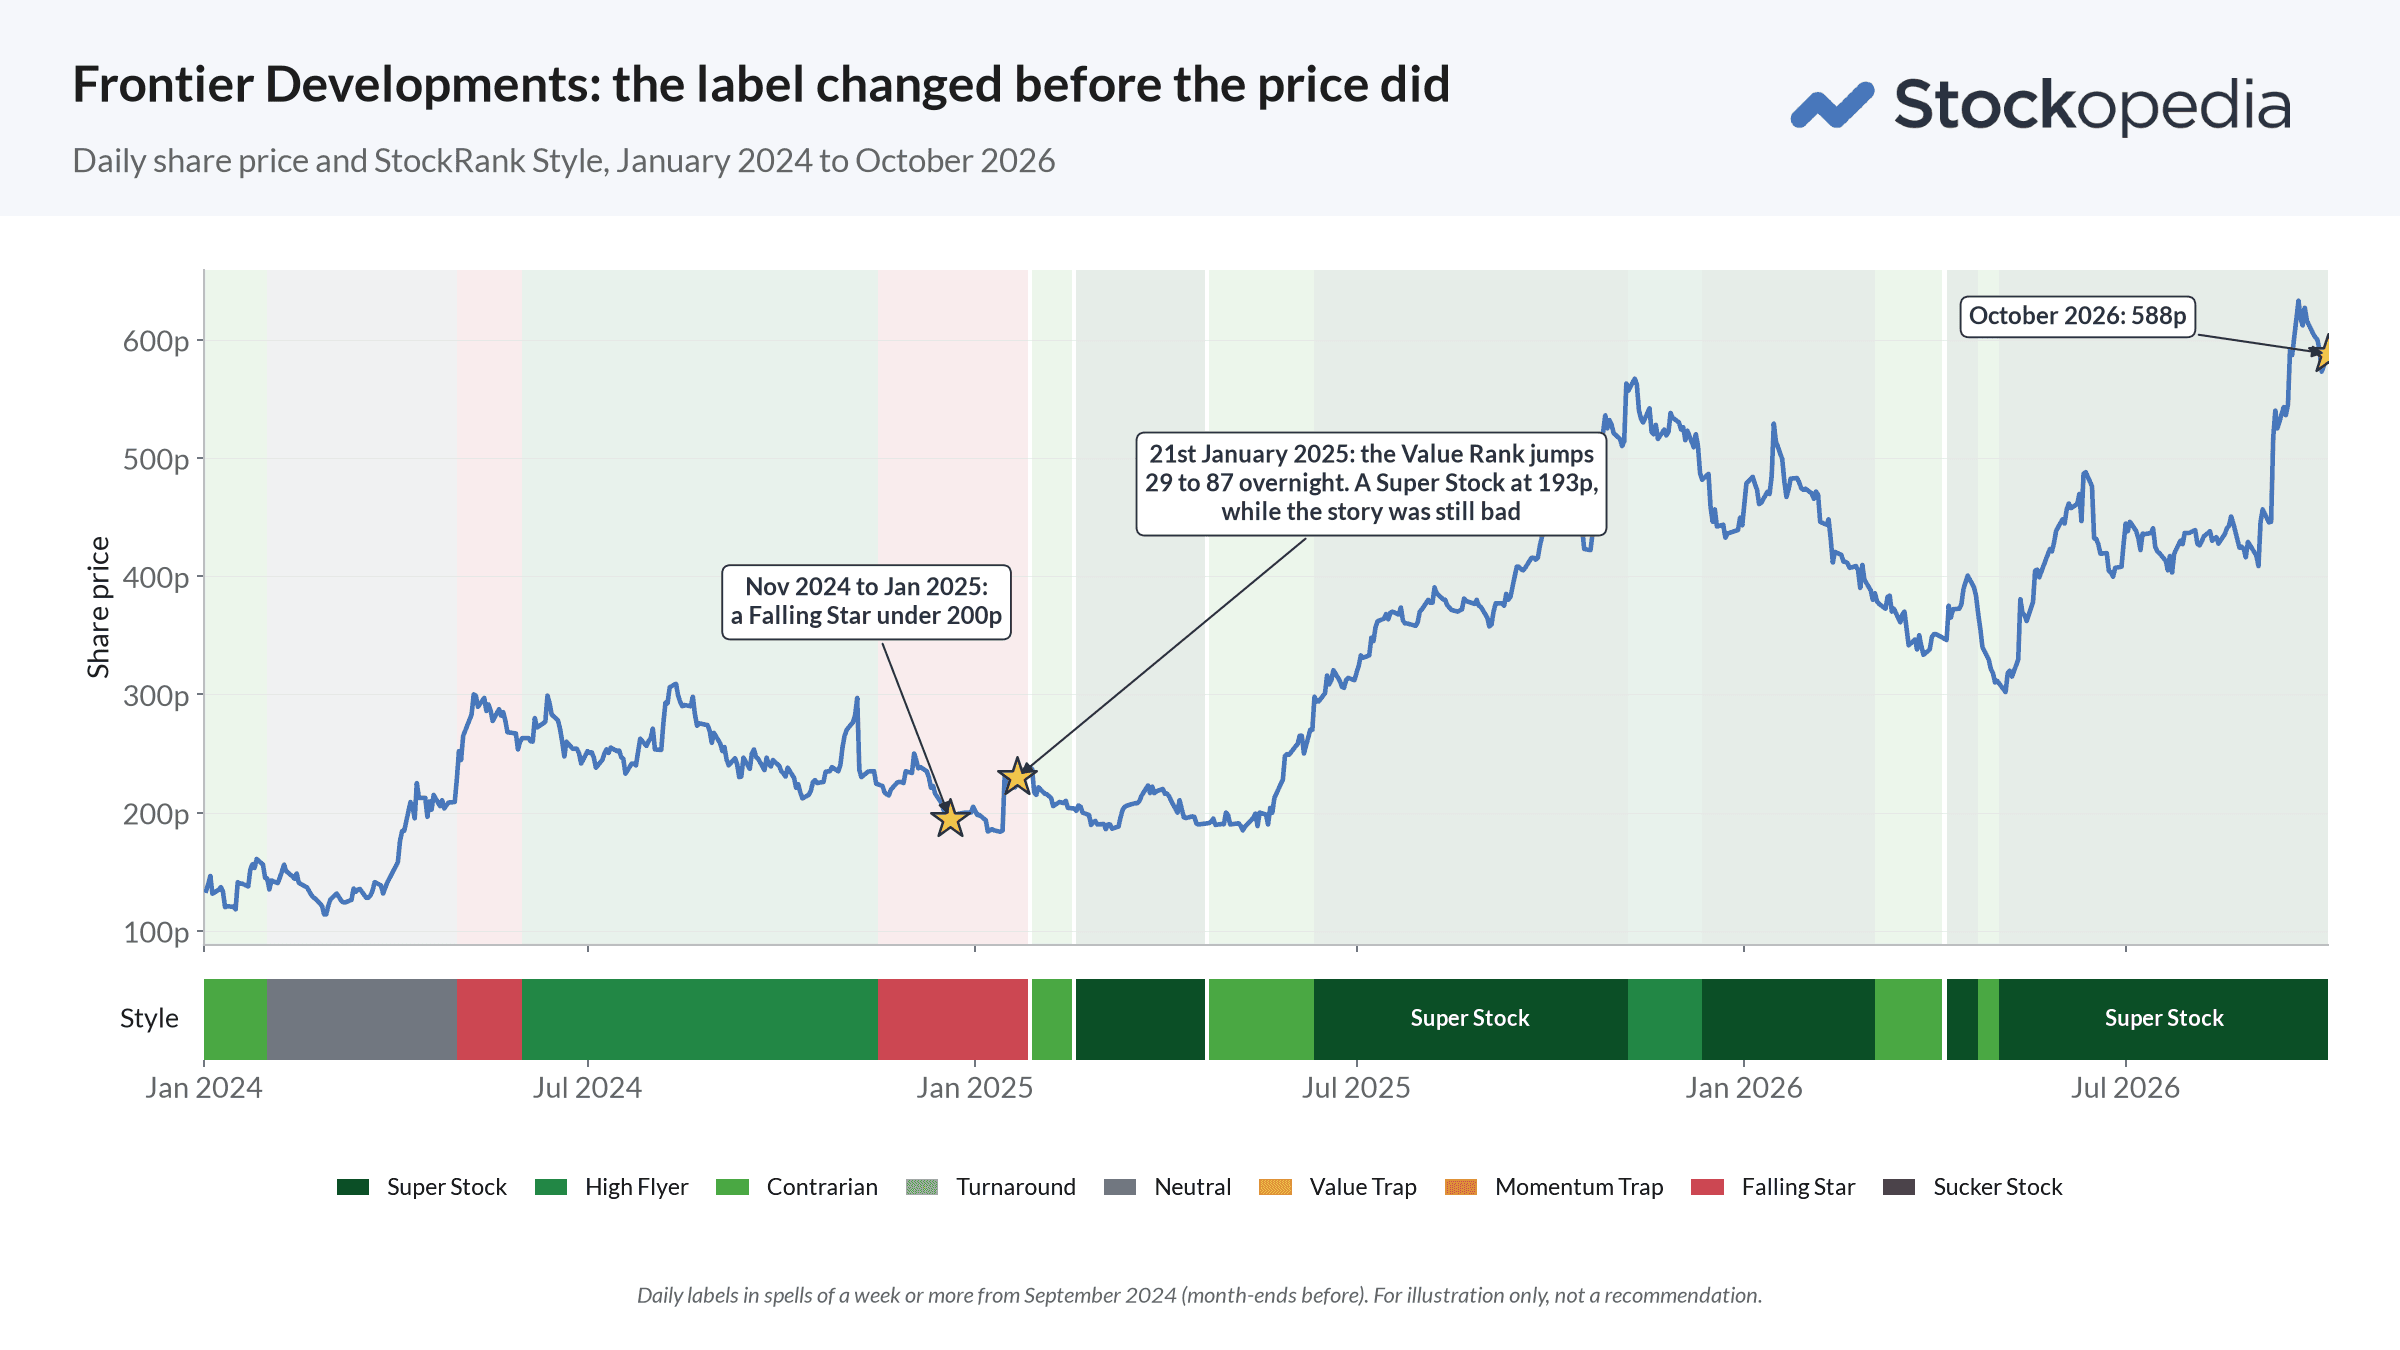
Frontier, the video games developer, had been a Falling Star at 2,570p in May 2021. By November 2024 it was a Falling Star again, this time under 200p, and the story was still bad. Then on 21st January 2025 its Value Rank jumped from 29 to 87 overnight and the share became a Super Stock at 193p. Nothing about the headlines had changed. The share then rose to about 588p by October 2026, a Super Stock for most of the way with spells as a High Flyer or Contrarian. The classification was right before the price confirmed it.
Why it works: the research behind Super Stocks
Academics have spent decades testing which characteristics of a share predict its returns. Eugene Fama and Kenneth French's 1992 study[1] showed that size and value help explain why some shares beat others, and a huge body of research since has shown that markets do not price shares perfectly.
The name Super Stocks comes from the late Robert Haugen, a long-standing critic of efficient market theory. In his book, The Inefficient Stock Market - What Pays Off and Why[2], he set out the profile of the ideal stock.
Haugen’s detailed modelling had uncovered some quite staggering results[3]. He found that the 10 percent of stocks with highest expected return, in aggregate, were low risk and highly profitable, with positive trends in profitability. They were cheap relative to current earnings, cash flow, sales, and dividends. They had relatively large market capitalisation and positive price momentum over the previous year. He wrote, “this is a dream profile, the profile of a stock you would love to own.”
By contrast, the 10 percent of stocks with the lowest expected return had exactly the opposite profile to Super Stocks. These low quality, expensively priced, deteriorating shares he christened Stupid Stocks. Our own research at Stockopedia has highlighted how attractive this profile of “stupid” stock is to individual investors. We believe the attraction comes down to the fact that we’re hard wired to empathise with the optimistic stories that surround these companies. As a result in the Stockopedia lexicon we have rechristened this poor profile as Sucker Stocks.
Later research has reached the same conclusion: Quality, Value and Momentum work best together. A quant team led by Cliff Asness at AQR Capital showed in Value and Momentum Everywhere[4] that value and momentum smooth each other's returns over time, and a later AQR study found that adding Quality improved results further:
We have found that three styles are particularly useful in actively managed long-only equity portfolios: value, momentum and profitability. Ample evidence shows that each of these styles can generate long-term excess returns on its own - and go a long way toward explaining why some portfolio managers excel - but research suggests that these styles work even better when united.
US finance professor Robert Novy-Marx, who studied how Quality and Value interact, reached a similar verdict:
Over time, tilts towards value, momentum and profitability have outperformed the market, and due to the diversification benefits, a combined portfolio of these three has provided much higher reward per unit of risk and a significant reduction in extreme risk or losses.
Digging into QVM
In general terms, a Quality company is one that is highly profitable (ROCE, ROE, GPA) with high industry leading margins, stable, growing and ideally accelerating sales and earnings, with a strong and improving fundamental trend (F-Score), a good shareholder payout (Yield, Buybacks) without having any risky red flags (e.g. Bankruptcy risk, Earnings Manipulation Risk or Share price volatility).
When it comes to valuing a stock, the most common measures focus on what a company earns or what it owns. Therefore, the most frequently used valuation ratios compare the share price to earnings, book value, cashflow or sales. Alternatively, it may look at the earnings yield or even the dividend yield.
A Momentum stock is one whose share price is up or above its 52 week highest price, is within the top 20% of share price percentage winners for the last 6 or 12 months (using Relative or Absolute Price Strength), is beating broker estimates (earnings surprise) and seeing estimate upgrades and recommendation changes.
What we can learn from Super Stocks
A compelling reason for looking closer at Quality, Value and Momentum in stock market investing is that decades of research shows that stocks with high exposure to these factors are often overlooked. Investors are generally predisposed to stories, good news, popularity, and excitement. They veer away from shares that appear to be troubled, staid or have seen their prices rise in the recent past. Yet it’s precisely this profile of stock that tends to win in the stock market. The rule that falls out of the data is simple: never buy a share with fewer than two strong factors. A Super Stock has all three. To build a portfolio around them, see our guide to the Core QVM strategy.
Perhaps it’s best to leave you pondering this point with a marvellous quote from Teddy Roosevelt:
Nothing in the world is worth having or worth doing unless it means effort, pain, difficulty… I have never in my life envied a human being who led an easy life. I have envied a great many people who led difficult lives and led them well.
[^buffett-Warren Buffett paper on why markets aren't random]: Warren Buffett, The Superinvestors of Graham and Doddsville (Warren Buffett paper on why markets aren't random). https://www8.gsb.columbia.edu/sites/valueinvesting/files/files/Buffett1984.pdf