
Good morning and welcome to today's report.
The agenda is now complete.
Update 14.30: we're wrapping it up there today, see you tomorrow!
Spreadsheet accompanying this report: link (last updated to: 5th September).
| Name (Mkt Cap) | RNS | Summary | Our view (Author) |
|---|---|---|---|
J Sainsbury (LON:SBRY) (£7.0bn) | SP +4% The company confirms weekend press reports of talks regarding a possible sale of Home Retail Group (Argos) to Chinese internet giant JD.com. Having said on Saturday that a sale to JD could "accelerate Argos's transformation", the supermarket now says that following the weekend's press reports, JD has said it “would now only be prepared to engage on a materially revised set of terms and commitments” that were not in the best interest of Sainsbury’s stakeholders. Accordingly, talks have been terminated. | AMBER/GREEN (Roland) [no section below] Sainsbury’s acquired Argos at a time when it was trying to increase sales density in its larger stores. I think this has succeeded, but the problem with Argos is that it’s a very low margin business. The company doesn’t disclose Argos profits anymore, but my previous analysis has suggested this business – which must compete with Amazon – has lower margins than the grocery business and has been consistently dilutive to Sainsbury’s overall margins. Given the resurgence of Sainsbury’s grocery business since the pandemic, I think it’s not hard to see why management might consider a disposal. However, with so many in-store Argos concessions and employees potentially at risk, I imagine terms might have been difficult to agree with JD – a view that seems to be supported by today’s commentary. Given the low level of profitability of this business, I can’t be fully positive at the current valuation. But I think Sainsbury is in good health and I’m happy to maintain my previous AMBER/GREEN view. | |
Big Yellow (LON:BYG) (£1.80bn) | 0.5 acre site in Bethnal Green for £10.8m. Seeking planning consent for 68ksqft unit, exp 8% NOI. | ||
Craneware (LON:CRW) (£804m) | Rev +9%, ARR +7% to $184m. PBT +52% to $24.0m. FY26 has “started well”, confident outlook. | AMBER/GREEN (Roland) | |
M P Evans (LON:MPE) (£677m) | CPO price +13%, crop -3%. Op profit +50% to $62.2m, net cash $71m. Added 3k hectares for H2. | AMBER/GREEN (Mark) | |
AO World (LON:AO.) (£484m) | SP +15% H1 revenue to be +13%, with B2C retail revenue up 11% YoY. Expect H1 26 net cash c.£70m. FY26 revenue exps unch, FY26 adj PBT now exp to be £45-50m (prev. £40-50m) Commencing first ever share buyback with £10m repurchase. | AMBER (Roland) [no section below] Today’s update suggests revenue growth has improved slightly so far this year, versus last year’s FY figures of 12% (B2C) and 7% (group LFL). Adjusted PBT guidance has been narrowed to the top half of the previous range today, but I’m a little wary due to the scale of the adjustments AO has applied historically. Last year, adj PBT was 2x reported PBT. Free cash flow (real cash profit) was much closer to reported PBT. Even so, a solid H1 net cash position (excl. leases) is encouraging and suggests recent growth has been cash generative. Graham and I have both been neutral on AO at higher share prices this year (in March and June). I could perhaps justify an upgrade to AMBER/GREEN today, but given this company’s ultra-low margins, box-shifting business model, low StockRank and Falling Star styling, I am going to err on the side of caution and remain neutral. I can’t help feeling much of today’s share price pop is a kneejerk reaction to the buyback plans. Personally, I would prefer to wait until the H1 results are published in November to get a more comprehensive view on trading. | |
London Security (LON:LSC) (£423m) | Rev +5.4%, Op profit -7.5% to £12.4m. Suffered from skilled labour shortage, now addressing. | ||
Riverstone Energy (LON:RSE) (£211m) | Sold 8.72m shares for c.USD65m (CAD10.29 per share, 1.9% prem). RSE now has $115m net cash. | ||
Mears (LON:MER) (£265m) | Acquired housing compliance specialist Pennington Choices for £9.5m, 6.3x forecast adj EBITDA | ||
ACG Metals (LON:ACG) (£199m) | Rev $70.8m (H1 24: nil), net profit $16.5m (H1 24: loss). GE prod +3% to $22,263oz. Cash: $161m. | ||
S4 Capital (LON:SFOR) (£145m) | Rev -14.7% (-11.9% LFL). Adj op profit -33.9% to £16.4m. FY25 adj EBITDA target unchanged. | AMBER/RED (Mark) | |
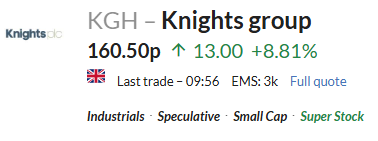
Knights group (LON:KGH) (£127m) | Rev +8%, adj PBT +11% to £28m. Net debt £64.8m. FY26 YTD trading in line with exps. | AMBER (Roland - I hold) I’m a little disappointed by these results. Organic revenue growth slowed to zero last year, while profit growth depended on huge adjustments. At a reported level, both profits and margins were lower. In addition the increase in leverage adds risk in my view, as Knights appears to be funding acquisitions and contingent payments almost wholly with debt. We’ve been AMBER/GREEN previously, but I’ve moved our view down by one notch to neutral today. While I accept this acquisitive business model could keep rolling to eventually create a larger and more valuable business, I think the risk of disappointment may also be growing. At current levels, I think the valuation is fair, based on my (less adjusted) view of profits. | |
Bango (LON:BGO) (£90.3m) | Rev +5% w/ARR +20% to $15.6m. Adj EBITDA +66% to $6.7m, net loss $3.2m. FY25 outlook in line. | ||
DP Poland (LON:DPP) (£81m) | H1 Revenue +8.7% to £28.8m, EBITDA +23% to£ 2.5m. Loss £0.5m (24H1: £1.0m). “...expects to deliver a solid performance in Q3 2025 and remains on track to meet management expectations for Q4 2025.” | ||
Andrada Mining (LON:ATM) (£65.5m) | Tin Concentrate production +17% to 453 tonnes, tin price +4%. Tantalum concentrate production 27 tonnes. | ||
Windar Photonics (LON:WPHO) (£59m) | Revenue +18% to €2.7m, LBT €0.7m (£24H1: €0.3m). Orders for delivery in H2 2025 of €3.6m. Net Cash €4.9m (31 Dec: €5.7m) | ||
Litigation Capital Management (LON:LIT) (£45m) | Has terminated its investment in a class action brought on behalf of commercial fishermen against Gladstone Ports Corporation for losses alleged to result from the large-scale contamination of the Gladstone harbour and surrounding waters. £15m written off. Formal strategic review initiated. | ||
Cora Gold (LON:CORA) (£43.6m) | Activities included a review of historical data, reinterpretation of regional magnetics, and first-pass multi-element soil and lithology geochemistry for four targets. | ||
Itaconix (LON:ITX) (£17.5m) | Revenue +73% to $4.8m, LBITDA $0.2m (24H1: LBITDA $1.0m), Cash $5.7m (31 Dec: $6.7m). “...well positioned to continue our progress.” | ||
Vast Resources (LON:VAST) (£14m) | Specialist cleaning to improve diamond sale prices. Working towards restarting operations at both mining operations. | ||
CPPGroup (LON:CPP) (£12.4m) | Total received reduced to $20m from $21m, initial gross cash payment reduced to $15m from $15.8m, net cash payment reduced to $7m from $8.8m. | ||
Ingenta (LON:ING) (£9.2m) | Revenues flat at £5.2m, Adj. EBITDA +29% to £0.9m, Adj. EPS +38% to 5.86p, Net cash £3.9m (31 Dec: £3.0m), Interim dividend +17% to 1.75p. “…remains confident that results for the year will be in line with market expectations.” | AMBER/GREEN (Mark - I hold) |
Roland's Section
Knights group (LON:KGH)
Up 8.5% to 160p (£138m) - Roland - Full Year Results - AMBER
(At the time of publication, Roland has a long position in KGH.)
This fast-growing law business follows a roll-up business model, providing partners at traditional firms with exit strategies and the opportunity to benefit from the infrastructure of a larger, corporate entity.
Knights Group is also a member of my rules-based SIF portfolio. This means that while I am not an unqualified fan of the business, I am pleased to see the positive reaction to today’s news!
Today’s headline figures appear to show respectable top-line growth, but closer inspection reveals this was only due to the contribution from acquisitions:
Revenue up 8% to £162.0m (FY24: £150.0m)
Revenue from acquisitions £12.5m
Organic revenue -£0.5m
Today’s commentary suggests the reduction in revenue reflects “the strategic decision to significantly reduce our restructuring and insolvency team” and weaker demand in areas “such as corporate and private client work”.
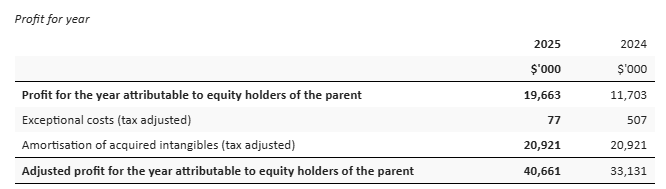
It’s a similar story with Knight’s heavily-adjusted profits:
Underlying pre-tax profit up 11% to £28.0m
Reported pre-tax profit down 16.9% to £12.3m
Adj EPS +10% to 23.95p
Basic EPS -23% to 8.83p
Dividend +9.3% to 4.81p
The only thing that definitely did rise during the year was leverage and indebtedness:
Net debt up 84% to £64.8m, following £25m of acquisition spending
Leverage of 1.6x EBITDA (Apr 24: 1.1x)
I’ll look more closely at the accounts in a moment. But I think it’s worth taking a look at the company’s operational comments first in order to get a feel for growth and activity over the last year:
Recruited 51 fee earners (FY24: 40)
Fee earner churn reduced to 10% (FY23: 18%, FY24: 12%)
“Strong client wins”, aided by diverse service offering
Two acquisitions, Thursfields Legal and IBB Law, added 247 fee earners to group
Post period end, two further acquisitions have been made (e.g. this one)
One takeaway from these numbers is that the majority of fee earners joined through acquisitions last year, not organic recruitment.
Given that these headlines report a total of 298 fee earners joining the group, my initial assumption was that overall fee-earning headcount must have risen. But that wasn’t the case, at least not on an average monthly basis.
The monthly average number of fee earners and other staff was cut by around 5% last year:
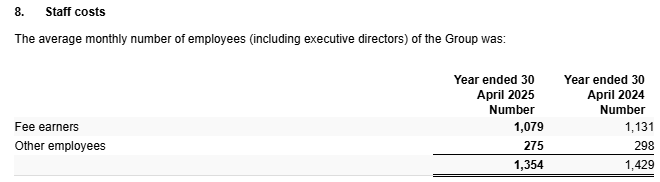
Use of monthly average figures rather than year-end numbers means we can’t be sure how many fee earners left the business. But I think it’s probably fair to assume that a meaningful number did leave.
This might help explain £2.3m of redundancy costs (FY24: £1.4m) and last year’s flat revenue performance, when acquisitions were excluded.
If this situation is reflective of job opportunities in the wider legal sector, this reduction in headcount could also help to explain the lower level of fee earner churn last year.
Profits adjustments
The big issue for me with these results is the scale of the adjustments. Without unpicking the numbers, I think they make it very difficult for investors to get an objective view of growth, profitability or cash generation (‘real profits’) last year.
This high level overview provides a reconciliation of underlying and reported pre-tax profit:
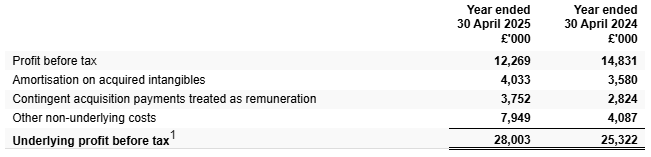
Note how all of these adjusting items are recurring and similar in size (or larger) than last year.
Other non-underlying costs include a laundry list of items such as redundancy costs, lease impairments, software write-offs and acquisition transaction costs:
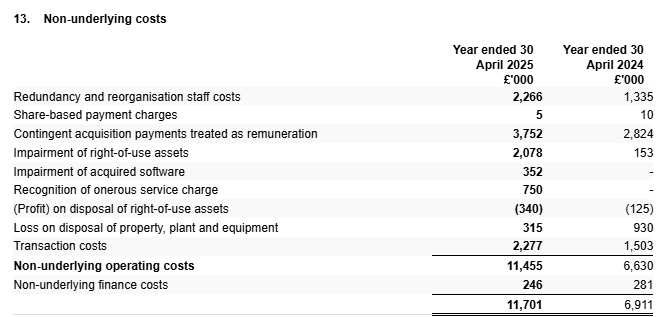
Broadly speaking, I think Knights’ justification for such high levels of adjustment is that costs and activities relating to acquisitions are not part of the core, underlying business of the group (providing legal services).
Personally, I don’t agree. The only way these costs would stop recurring would be if Knights Group stopped making acquisitions and abandoned its sector consolidation strategy. Until that happens, I would argue that these costs are part of the underlying cost of doing business for this company.
Free Cash Flow & Net Debt
A useful sanity check in these scenarios is to consider the cash generated by a business over the last year.
Today’s accounts include a company-calculated measure suggesting free cash flow of £26.7m:
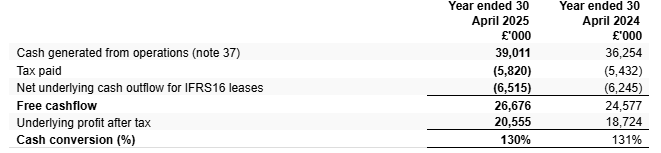
Personally, I don't think this calculation provides a meaningful view of free cash generated by the business. As with profits, it seems (too) heavily adjusted to me.
The standard definition of free cash flow is that it subtracts capital expenditure and from operating cash flows.
Knights’ calculation above appears to ignore capital expenditure, which totalled around £12m last year.
For an equity investor, it also makes sense to subtract finance costs from when calculating free cash flow in order to determine the amount of cash that might potentially be available for shareholder returns.
Knights’ calculation above has excluded finance costs, only including those related to leases (which would have been deducted from operating cash flow prior to IFRS16).
My estimate of free cash flow to equity for last year would be £6.2m, including all finance costs and capex, but excluding acquisitions and deferred/contingent consideration.
This is a fairly close match to Knights’ FY25 reported profit after tax of £7.6m, which gives me confidence that this is a fair assessment.
However, this doesn’t address the £30m increase in net debt to £64.8m last year. Of this, £25m was due to acquisitions. The remaining c.£5m reflects the combined impact of cash outflows from the following items, in my view:
Deferred and contingent acquisition payments: £5.2m
Share buybacks: £0.6m
Dividends: £3.9m
What this tells me is that the acquired businesses are not generating sufficient free cash flow to self-fund deferred acquisition payments, so these are also being at least part-funded by debt.
Self-funding deferred consideration isn’t a requirement and isn’t always viable, but I always think it’s a nice thing to see.
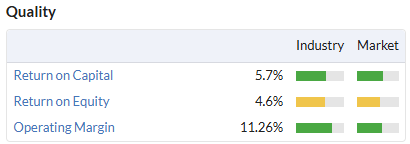
Profitability
The group’s operating margin fell from 13.3% to 11.5% last year.
Return on capital employed fell from 10.6% to 7.7%, using statutory figures.
I’m disappointed the hoped-for flywheel of synergies and cost savings doesn’t seem to be driving an improvement in real, cash-generative profitability at Knights Group.
Outlook & Estimates
CEO David Beech sounds confident about the outlook:
Trading at the start of the current year is encouraging and in line with expectations
He reports that “increasing numbers of high quality people and firms continue to join Knights”. Perhaps we’ll see an increase in average headcount this year.
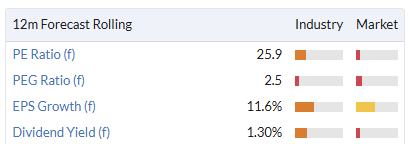
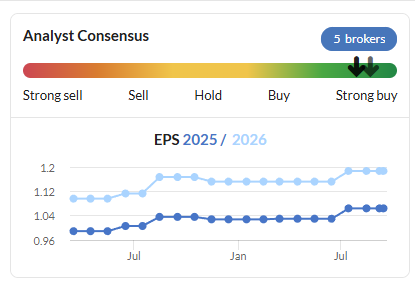
Guidance for the full year appears to be unchanged. A new note from Equity Development today forecasts FY26E adjusted earnings of 26.7p per share. That’s in line with Stockopedia’s existing consensus figures:
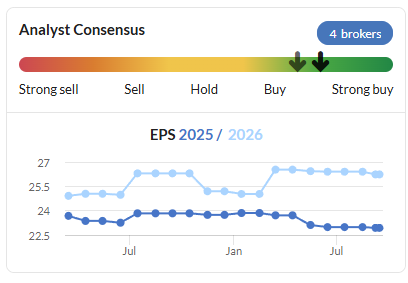
These estimates put Knights group on a P/E of 6, if you’re willing to accept the company’s adjusted earnings calculation.
Personally, I would view the real P/E here as roughly double this figure.
Roland’s view
Knights delivered no organic growth last year and continued to see heavy cash outflows on new acquisitions and costs associated with past purchases. These numbers suggest to me that both new acquisitions and deferred payments relating to past acquisitions are being almost entirely funded with debt. This adds risk if they underperform at all.
In some ways, I think the best thing the company could do would be to stop making acquisitions and focus on maximising the profitability of its existing business, with the distraction and cost of constant integration and restructuring work.
If the underlying law business here is as good as management suggests, I’d expect a sharp increase in profitability and cash generation if acquisition activity ceased (or at least slowed).
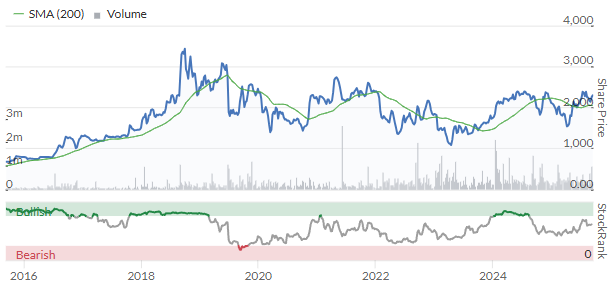
I’ve been AMBER/GREEN on this business in the past due to its growth and seemingly reasonable valuation. The StockRanks have also been positive, with Super Stock styling.
However, I’m discouraged by the combination of flat organic revenue and what I view as aggressive adjustments in today’s results. The increase in indebtedness is also a potential concern, in my view, given the high level of post-acquisition costs.
This acquisition-led business could keep growing and might eventually escape the headwinds I’ve discussed in this review. However, I think the risk of disappointment may also be increasing. On balance I’m going to downgrade one notch to take a neutral view today. AMBER
Craneware (LON:CRW)
Up 1% to 2,320p (£823m) - Roland - Full Year Results - AMBER/GREEN
Continued sales momentum and accelerated growth rates, reflecting operational focus and strategic position at the heart of the US healthcare market
This AIM-listed firm specialises in providing billing-related software to US hospitals and claims to have approximately 40% of all US hospitals as customers. These are gradually being moved onto the company’s Trisus platform, its flagship product.
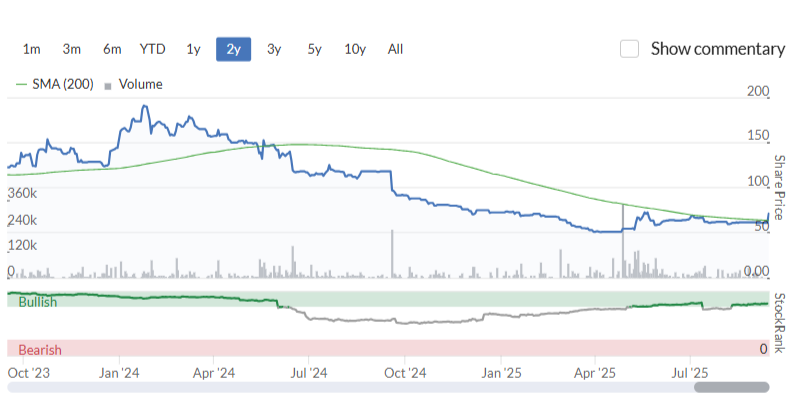
CEO Keith Neilson remains a 9% shareholder and the shares have tripled over the last 10 years. However, Craneware stock currently trades well below its 2018 high and the share price has been rangebound since 2010:
I’m interested to see if today’s results might suggest any change to this situation, as in principle this seems like the kind of high quality stock I might consider buying at the right price.
FY25 results summary
Today’s figures cover the year to 30 June 2025 and show continued top-line growth, supported by high retention rates and an increase in annualised recurring revenue (ARR):
Revenue +9% to $205.7m
ARR +7% to $184.0m
Net Revenue Retention: 107% (FY24: 98%)
Customer Retention “over 90%”
The contrast between net revenue retention and customer retention suggests to me that much of the revenue growth may have come through pricing increases or upselling/migrations to new services.
Whatever the explanation, it looks like this growth was achieved without any compromise on profit margins. Adjusted EBITDA rose by 12% to $65.3m while adjusted earnings per share climbed 22.5% to 116.1 cents, slightly ahead of consensus forecasts of 106 cents.
However, as more than one subscriber has highlighted in the comments, there’s typically a big divide between reported and adjusted earnings with Craneware. That remains true today, with reported earnings climbing by 68% to 56.2 cents per share.
Let’s deal with this issue immediately by comparing various profit measures with free cash flow. How much surplus, distributable cash did Craneware generate last year?
My sums suggest free cash flow of $42.6m, or around 120 cents per share. In other words, very much in line with adjusted earnings of 116.1 cents per share.
The main reason for the difference between statutory and adjusted earnings is easily explained in this case – the accounts show $21m of amortisation on acquired intangible assets, which is deducted from reported profits. But this reflects cash spent on acquisitions in the past and is non-cash as reported today.
Craneware isn’t a serial acquirer, so there were no further cash flows on acquisitions today. That means free cash flow is broadly in line with adjusted profits.
If I added back this amortisation of acquired intangibles to operating profit, I get an operating margin of 22.5%, rather than the statutory figure of 12.2%. The higher margin is more in line with what I’d expect from a software business of this kind.
The flipside of this is that the high amortisation charge suggests to me Craneware may have paid a high price for past acquisition(s). This is reflected in a low return on capital employed, using statutory operating profit:
To consider buying the shares, I’d have to look back in more detail at the company’s acquisition history. For now, I am not too concerned. Craneware’s accounts look fine to me.
Trading commentary: the company says that efforts to streamline the business have born fruit over the last year, “in a tighter, more focused organisation”. Among the benefits have been “greater consistency” in customer engagement and faster product development.
With the large bulk of our extensive customer base having renewed their multi-year contracts in the last two years, our focus is now on delighting them with our service and insights, and ensuring they utilise the full strength of the Trisus platform to increase their return on investment from using the platform.
The company’s partnership with Microsoft and “early adoption of AI” are also said to be progressing well.
With the high levels of inefficient spend and complexity in healthcare, there are many opportunities for AI to deliver great benefits, if used correctly and implemented with care. For the Group, it brings great opportunity to analyse our data at a far greater pace, accelerate product delivery while increasing our operational efficiency and the quality of our customer interactions yet further.
The company also says that while US healthcare providers are under pressure for a variety of reasons, IT budget cuts are not expected as providers seek to improve their financial performance:
While healthcare providers' operating margins are starting to normalise post-Covid, these providers are now facing increased uncertainty around changing legislation, executive orders and tariffs. Increasing cost pressures, labour constraints, and the rise in AI means healthcare providers are being asked to do more with fewer people and typically have little, or no, margin for error.
Outlook & Estimates
Trading in the first months of the new year has started well, which alongside the FY25 ARR and NRR growth provide confidence in continued growth acceleration in FY26.
An updated note today from advisory Capital Access has left earnings forecasts largely unchanged:
FY25 actual: 116 cents
FY26E EPS: 118 cents
FY27E EPS: 135 cents
With the shares largely unchanged today, these forecasts translate into a High Flyer-style valuation, according to Stockopedia:
Roland’s view
As a potential investor, I’d also like to understand the company’s history of acquisitions in more detail. I wonder if high-priced past deals may be acting as a drag on the overall accounting returns achieved by the business. A statutory ROCE of under 7% is very low for a software business with high cash margins.
In terms of valuation, focusing on cash generation gives me a free cash flow yield of around 4% – consistent with the stock’s P/E of c.25. That’s not outrageously expensive for this kind of business, but it’s not obviously cheap either given the lower rate of growth currently expected this year.
However, I note that consensus forecasts have been upgraded twice in the last 18 months, so perhaps management is simply conservative and will only guide earnings upwards when visibility improves:
My reading of Craneware’s commentary today suggests that while IT spending may remain protected in US healthcare, the company has faced some resistance from some customers at being moved onto (presumably) higher-priced cloud services.
Craneware may now need to justify that transition in order to regain momentum and work towards its goal of being the dominant provider of this kind of software to the US market.
I was AMBER/GREEN on Craneware in July when the company upgraded its FY25 full-year guidance. Given the strong cash generation, high underlying margins and net cash balance I am happy to leave that view unchanged today.
Mark's Section
Ingenta (LON:ING)
Up 15% at 71p - Half-year Report - Mark - AMBER/GREEN
First up a warning - this company drops slightly below our normal £10m market cap cutoff (at least before this morning's share price rise) meaning it is likely to be illiquid, and price moves can be exaggerated. I hold, so I was always going to be looking at these results in detail anyway. It is also one of the most-viewed stocks this morning on the Stockopedia site, so I consider it worth writing up those thoughts here. However, like with all holdings, I will suffer from ownership bias.
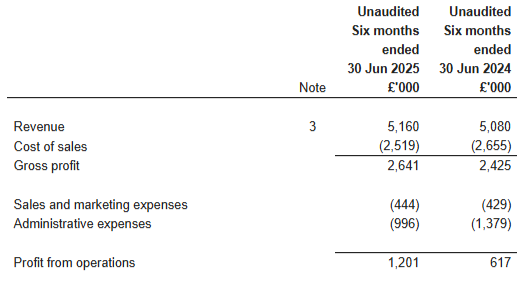
Here’s the key financials for this half:
· Group revenues of £5.2m (2024: £5.1m)
· 88% of Group revenues recurring in nature (2024: 87%)
· Gross profit margin 51% (2024: 48%)
· Adjusted EBITDA* up 29% to £0.9m (2024: £0.7m)
· Cash from operations up 75% to £0.7m (2024: £0.4m)
· Cash balances of £3.9m (31 December 2024: £3.0m)
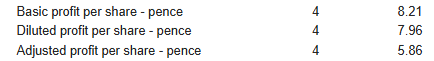
· Adjusted earnings per share** up 38% to 5.86 pence (2024: 4.25 pence)
· 17% increase in interim dividend to 1.75 pence per share (2024: 1.5 pence)
So the revenue is flat, but the EPS growth is very strong. This is driven by two things. Firstly, slightly higher gross margins due to better delivery through the company’s cloud-based structure. This is pleasing, as the gross margin had previously declined due to the move towards cloud instead of on-site hosting. Secondly, lower administration costs:
We have to be careful when companies quote adjusted figures. However, in this case they are adjusting EPS down, to take account of FX:
Indeed, it seems the cause of the reduced admin expenses is that FX move:
Administrative expenses decreased to £1.0m (2024: £1.4m) largely as a result of non-cash exchange differences on translation of intercompany balances. In the current year, this amounted to a gain of £0.3m versus a loss of £28K in 2024.
Adjusted EPS is definitely the one to take here.
Forecasts:
Sales and marketing is roughly flat, although they are guiding this will increase in the near term:
Sales and marketing spend was broadly stable in the first half of the year, however, the Group has been actively recruiting additional sales personnel to fill strategic vacancies. As previously announced, the Company is prioritising acceleration of new business acquisition to offset the expected larger scale reduction in revenues from legacy platforms in future years and return the Company to growth in revenues and profits. Two of these key roles have been filled and came on board in July.
It was the decision to invest £0.5m in additional sales headcount in this year, that led to their broker Cavendish to initiate FY25 forecasts with a decline in EPS from 11.4p in FY24 to 8.2p in FY25. The market didn’t like this, perhaps fearing that something more untoward was the real cause. However, with these results, we see that a delay in onboarding these salespeople has actually led to an increase in EPS at the half-year. Today the company says:
The Board is pragmatic about the lead time between onboarding new sales and marketing positions and the ultimate generation of new business, but remains confident that results for the year will be in line with market expectations.
Hence, Cavendish keep the same forecasts. However, they also point out that the company has already achieved 67% of their full-year estimate at the half-way stage. While I can understand their caution, I also think that a modest upgrade should be on the cards. Their revenue is largely recurring in nature, at least in the short-term. Some further decline in Legacy revenues must surely be on the cards. However, offsetting this is a pipeline of deals that may add modest amounts to H2 revenue:
Looking ahead, there are a substantial amount of potential new business proposals awaiting customers' final decisions in the second half and we are confident that the momentum of new business wins will build during this period into next year, particularly as the new sales team begins to become effective.
While they have now been successful in hiring some of the salespeople, the impact on H2 can’t be more than £200k, given the delays, even assuming a couple more hires, as they say:
In January 2025, the Group recruited a Director of Marketing who has taken responsibility for enhancing digital outreach and raising Ingenta's profile in key industries. These efforts have already helped increase the quality and breadth of opportunities which the sales teams are actively engaged on. The expansion of the sales team has taken longer than expected, however recruitment in two key sales positions in July 2025 has provided relevant specialism in our Content and Commercial sectors where we see opportunities to generate revenue growth. Whilst these sales and marketing activities have been progressing, we have also been embedding our account management processes to identify opportunities and offer practical solutions to customer requirements.
Any bonus sales commissions due to new hires will presumably fall in the new financial year at this stage. The new Marketing Director was hired in January 2025 so these costs will be in H1 as well. No significant delays to any project implementations mean that revenue for these should be booked before year end:
Encouragingly, this has developed significant work for the coming year with further recurring revenue anticipated in 2026 and beyond. All Group project work remains on track with completion scheduled for the end of 2025.
Offsetting these additional costs, is an increase in interest on the cash balance. They previously didn’t earn any interest on the cash, as they had a potential use for it that ultimately fell through. It seems an oversight to not realise that they could have generated a return without a lock up. However, this is now corrected as they say “The Group has cash deposited in liquidity funds which started to generate interest from June.” This should generate around £50k in H2 to offset the increased headcount costs. They have significant historical tax losses they continue to utilise, so I don’t expect their tax rate to change any time soon. All of this means I think around 4p of EPS is possible for H2, which would give 10p for the full year instead of the 8.2p forecast. Still down on the 11.4p of FY24, but not significantly.
Balance sheet:
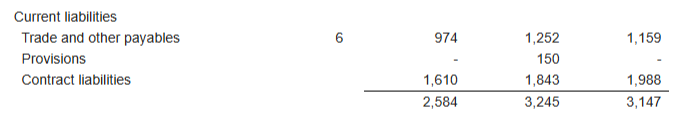
This is a very simple balance sheet to understand, the stand out figure is net cash has increased from £3.6m to £3.9m, despite a £378k dividend paid in the period.
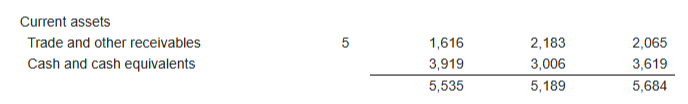
Similar to most software companies, they trade with negative working capital. There is £1.6m of receivables but £1.0m of payables, and £1.6m contract liabilities. These are relatively stable, with a reduction in receivables broadly matching that of payables/contract liabilities.
I don’t detect any obvious signs of window dressing, and the lack of interest income is explained elsewhere. Indeed the shift to cloud-based architecture and SaaS billing has meant that the billing cycle is less severe and the cash balance is more consistent. Of course, if revenue declines this negative working capital characteristic will likely see cash outflows. However, any outflow will easily be absorbed by the current cash balance, and if they achieve their aim of growing revenue again this will aid cash generation. In summary, this remains a very conservative balance sheet for any business, let alone a software one.
Valuation:
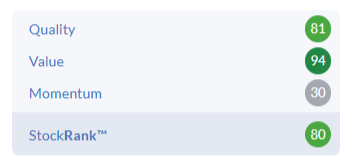
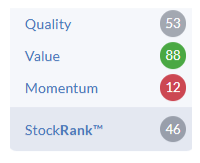
At 74p to buy with a forecast 8.2p Adj. EPS, this is on a forward P/E of around 9. This comes down to more like 7 if we are willing to accept my guesstimate figure of 10p EPS based on the c.6p done in H1. This is certainly at the value end of the market, as the 94 Value Rank attests:
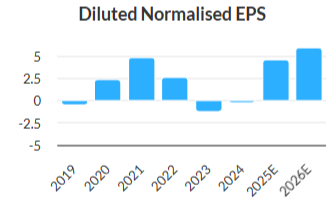
However, it perhaps should be lowly-rated given the revenue chart looks like this:
However, on top of this, we have £3.9m net cash, or around 26p/share. Cash adjusting this comes down to 5.9x or 4.8x depending on whether you believe Cavendish or me are making more realistic forecasts. This is perhaps cheap enough to consider this good value even without a growing top line. The risk is that they don’t do anything with that cash, making it irrelevant from a valuation point of view. It seems they were considering an acquisition earlier this year. However, even on the private markets it must be hard to find a complementary software business that isn’t on a significantly higher rating, making it expensive compared to buying back their own equity. They have had a tender offer in the past to return excess capital. However, they are acutely aware that shrinking their market cap and liquidity further probably won’t encourage a long-term re-rating. They are between a rock and a hard place.
The better news is that, while they may not be willing to reduce their share capital, they have increased their interim dividend by 17% to 1.75p. Their final dividend last year was 2.6p, and I can see them increasing that to 3p, meaning buyers today are getting a well-covered 6.4% yield.
Mark’s view
For me, this is what Mohnish Pabrai called a “Dhando Investment” where “Heads, I win. Tails, I don’t lose much.” If the company’s investment into sales headcount does generate sufficient revenue and profits growth to overcome the slow decline in legacy products, then the market is likely to ascribe a significantly higher multiple than today. However, if this strategy fails to pay off, then it is relatively easy to cut that headcount and generate significantly higher EPS in a managed decline. In this scenario, the cash balance and ongoing cash flow should make the downside very limited. This doesn’t mean that the share price can’t go lower, as recent trading levels have shown. But, it is worth noting that the fall in share price from almost 200p/share is largely the result of a microcap fund selling, and the investment in sales headcount reducing short-term EPS expectations, rather than any major deterioration in underlying trading:
Although I have mentioned this company a few times in articles, including a Stock Pitch in July last year, we haven’t looked at it on the DSMR since Graham reviewed it in May 2024. He was AMBER/GREEN on the company at c.150p due to its modest valuation of 12x earnings for a software company, offset by the lack of growth. Today the valuation is even cheaper, although partly because the share price has halved! The concerns about lack of top-line growth remain. While the additional sales headcount and pipeline may mean that the company may be finally exiting from its years of flat sales, I’d want to see concrete evidence of this in the numbers before considering an upgrade in our view.
M P Evans (LON:MPE)
Up 3% at 1,340p - Half-year Report - Mark - AMBER/GREEN
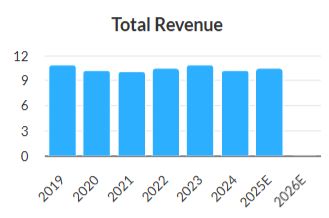
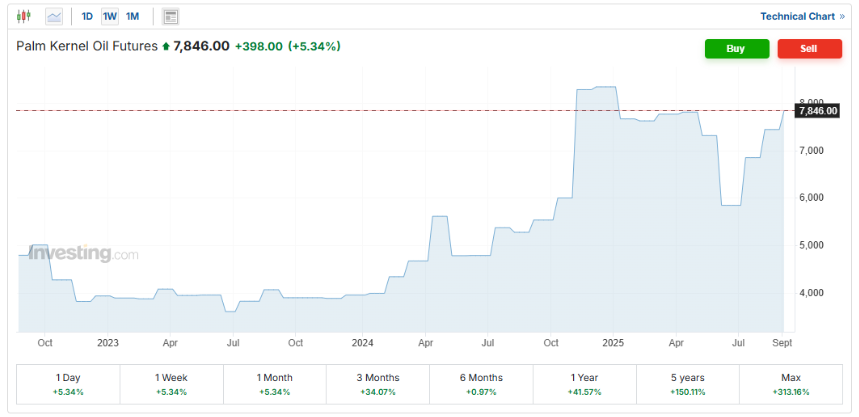
Palm oil production is down for the year:
· 3% reduction in total crop processed - 2025 - 737,700 tonnes, 2024 - 759,700 tonnes
· 2% reduction in total crude palm oil production - 2025 - 172,800 tonnes, 2024 - 177,000 tonnes
However, that is largely due to reduced bought in kernels, with their own crop 8% higher:
Continuing a trend started in 2024, the Group is deliberately restricting the amount of independent ffb brought into Group mills to supplement the harvest from those areas managed by it. Typically, purchased crop is considerably more expensive than harvested crop, and is often of a much poorer quality, leading to lower levels of production. Management is continuing to focus on increasing the Group's own harvest and decreasing purchased ffb. The total amount of independent crop purchased in the first half of 2025 decreased by 39% to 118,600 tonnes (2024 - 193,500 tonnes).
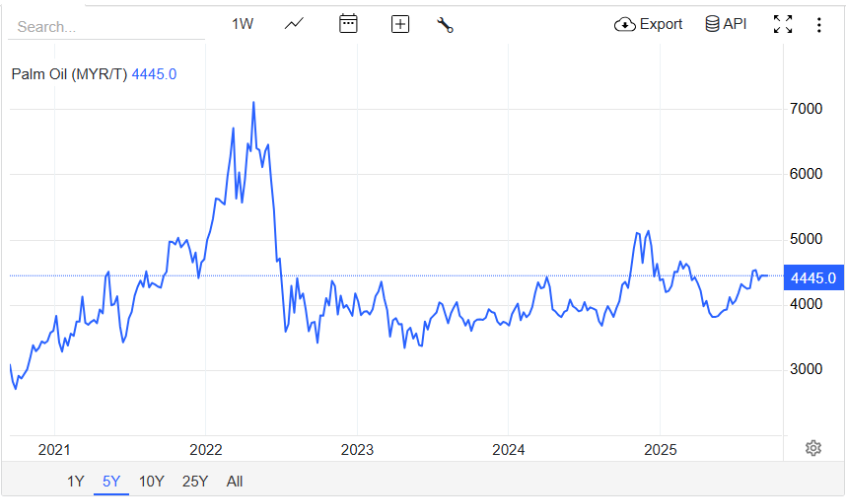
Like any commodity producer, increases in price are very good news:
13% increase in mill-gate CPO price - 2025 US$868 per tonne, 2024 US$771 per tonne
However, the biggest positive impact is the narrowing of the price differential between Crude Palm Oil and Palm Kernels:
It is normal for mill-gate PK prices to be lower than those for CPO but PK prices as a proportion of CPO prices improved markedly during the first half of the year, with a beneficial impact on Group margins. On average during the first half of 2025, the Group received US$747 per tonne (2024 US$437 per tonne), an increase of 71% on the first six months of the previous year.
Increases in commodity price on a fixed cost-base has a big impact on profitability:
Supported by the strong price environment for both CPO and PK, the Group achieved an increase in gross margin in the first half of the year, and gross profit was US$63.4 million (2024 US$42.1 million). Earnings per share increased to 71.7p (2024 - 44.9p).
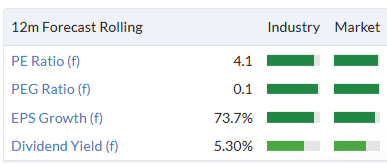
Forecast EPS trends have been positive here recently, and now stand at 169c consensus:
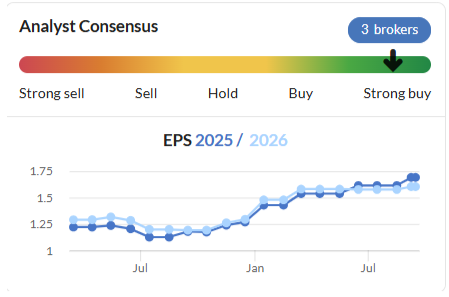
Diluted earnings per share were 92.7c, which means that they only need to do 76.3c in H2 to hit forecasts. Cavendish were already ahead of consensus, and make a further upgrade to their EPS forecast today, increasing it 4.6% to 195.3c.
Hitting this figure looks achievable to me, and will be helped by a recent acquisition:
On 14 July 2025, the Group announced that it had completed the acquisition of a further 3,000 planted hectares in East Kalimantan for total consideration of US35.1 million. The acquired area is close to the Group's Bumi Mas estate and will be managed as part of it, bringing the size of the enlarged project to almost 12,000 planted hectares. Since acquisition, all the crop from the newly acquired land is being brought for processing to the Group mill at Bumi Mas. This is in line with the Group's strategy to continue increasing mill utilisation with its own harvest and is expected to be immediately earnings enhancing.
However, the key variable is the palm oil price. Cavendish actually reduced their CPO production forecast by 4.1%, but a 3.8% increase in their price assumptions plus the very strong palm kernel pricing offset this. Here is the key price commentary from the company:
Pricing for both CPO and PK has remained firm since the end of June. By the end of August, the Group's year-to-date average mill-gate prices for its output had not changed significantly from those at the end of June. Following successful tendering for the two-month period, the year-to-date averages for CPO and PK had become US$865 and US$737 respectively. If Group cropping levels increase in the coming months, and this pattern is experienced more widely, there may be some downward pressure on prices, but the Group would also expect some associated downward pressure on unit costs of production from increasing volumes at the same time and, in addition, the pricing levels already achieved in the first eight months of the year are indicative of a robust average for the year as a whole.
Given these improvements largely turn into cash flow, Cavendish increases their FY dividend forecast to 60p and net cash to $80.1m.
Valuation:
Taking Cavendish’s estimates, and adjusting for the forecast cash balance, I calculate that this is on a forward P/E of around 8.5 ex-cash. The forecast dividend yield is around 4.5%.
However, this appears to be an exceptional year for palm oil pricing. Using a medium term CPO mill gate price of $750, Cavendish have 154c pencilled in for FY26 and 158c for FY27. With further increases in cash balance this works out to be around a 10x P/E ex-cash.
Mark’s view
While the performance here is strong, and the company is controlling what they can - quality of production, own hectare planting, etc., there is no escaping that they are at the mercy of commodity prices. The recent upgrades have been about commodity price rises, particularly a very strong palm kernel oil price, not production increases:
A P/E of around 10 and a 4.5% yield looks around fair value for me, for a commodity producer that isn’t significantly increasing production. There may be further upside if commodity prices stay strong or increase further. After all, MP Evans will have geared exposure to that commodity price. The other factor to consider is that Anglo-eastern Plantations may still give cheaper exposure to this commodity despite the recent price action being even stronger there.
Graham rated this GREEN in June. However, since then, the share price has risen 20% and while EPS has been upgraded, this is due to stronger commodity pricing, as the production outlook has weakened. Declining EPS forecasts for FY26/FY27 mean that analysts see the current palm kernel pricing as exceptional. Hence, I take the view that AMBER/GREEN is more appropriate.
S4 Capital (LON:SFOR)
Down 13% at 19.7p - Interim Results - Mark - AMBER/RED
One of the (many) headlines here says:
Full year like-for-like3 2025 operational EBITDA target remains unchanged, broadly similar to 2024, with a greater second half weighting, reflecting the timing of significant new business wins and further cost reduction, which is being actioned.
However, I can see why the shares are down today. A 13% reduction in net revenue, and they only just scrape positive EPS after adjustments, and flag a significant H2-weighting.
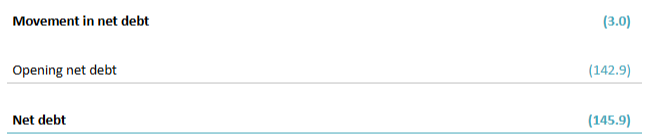
Net debt may be down on the previous year, but is up during the six month period:
Their reported free cash flow gets eaten up by FX losses. The nature of net debt being large cash balances and large loans also suggests that window-dressing is a big risk here:
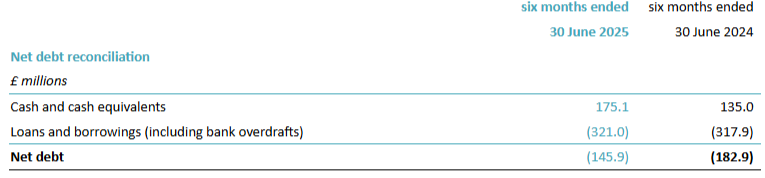
On top of this there is a liability of £8.6m for contingent consideration and current payables exceed current receivables by about £45m. Again suggesting this balance sheet may not represent the normal state of affairs.
This doesn’t seem to be an immediate solvency concern, as they say:
Net debt7 ended the first half at £145.9 million, or 2.0x net debt/pro-forma 12 month operational EBITDA. This compared to £182.9 million at the end of June 2024 reflecting on going focus on cashflow and improving liquidity. The 12 month pro-forma EBITDA was £74.6 million. The balance sheet has sufficient liquidity and long-dated debt maturities to facilitate growth and our key covenant is net debt not to exceed 4.5x the 12 month pro-forma EBITDA.
However, given the scale of the debt versus the current market cap, this should feature in any valuation. If they hit their forecasts, then this looks pretty cheap:
However, there must be some doubt over this, given that they only delivered 0.2p of the 4.66p forecast in H1. According to secondary sources, Peel Hunt cut their forecasts today. That they also cut their price target from 30p to 25p doesn’t give a lot of confidence that they see value here. Dowgate say:
Forecasts. We lower our Net revenue forecast to £688m (was £705m) reflecting lowered guidance and maintain EBITDA at £80m due to the H2 cost reduction measures.
Including the debt will more than double that rating, making it not particularly cheap for a people business. Dowgate maintain their BUY rating but this perhaps shouldn’t be a surprise as, according to their note, 100% of their corporate recommendations are BUY!
Mark’s view
While highly leveraged companies can provide significant upside in the right conditions, the low momentum rank (probably set to go down further with today’s results) doesn’t give much confidence that now is the time:
Hitting future forecasts looks highly challenging, given the H1 adj. EPS of just 0.2p. On top of this, a large debt pile means that, even if it does pull the rabbit out of the hat, it isn’t as cheap as the headline figures suggest. It’s not like they have a history of cyclically high earnings to return to:
(Although it must be noted that this may be due to the different treatment of adjustments, as Dowgate have positive EPS figures throughout this period. It doesn’t change the fundamental point, which is this may be as good as they get!)
Graham had this as AMBER earlier in the Summer, but with forecast downgrades and a high chance of a miss, I’m going to take this down a notch to AMBER/RED.
See what our investor community has to say
Enjoying the free article? Unlock access to all subscriber comments and dive deeper into discussions from our experienced community of private investors. Don't miss out on valuable insights. Start your free trial today!
Start your free trialWe require a payment card to verify your account, but you can cancel anytime with a single click and won’t be charged.