
Good afternoon!
Apologies for running late today. I'll be updating this page between 1pm and around 3:30pm today.
I've been nominated for small cap journalist of the year again. However, thinking about it, I've found the previous years' judging to be so haphazard, bizarre even, that for me the whole thing lacks credibility. Therefore it doesn't interest me at all.
Readers here constantly tell me that they value my work, and it's helped them make money (and avoid losses), which is all that matters to me.
Let's start with an update from yesterday;
Bonmarche Holdings (LON:BON)
Share price: 81.5p
No. shares: 50.0m
Market cap: £40.8m
Trading update - 53 weeks ended 1 Apr 2017. Note the elongated period, which will flatter results versus the previous year.
The following table is presented for Q4, and the full year's sales;
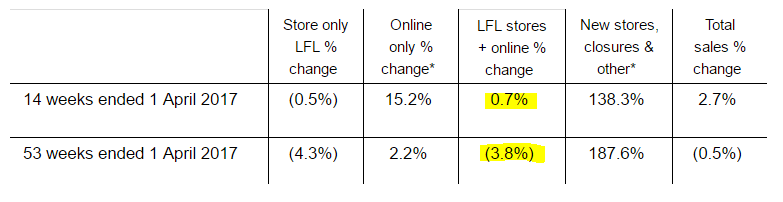
This shows a clearly improving trend in Q4, with LFL+online sales up 0.7% in Q4, against a total for the whole year of minus 3.8%.
However, there's a problem with this table - it's not actually Like-For-Like (LFL) sales at all! As they admit below the table, this is comparing 53 weeks this year, with 52 weeks last year. Clearly that is not a LFL comparison. So why on earth was this published, when it's clearly misleading?
As noted previously, FY17 includes a 53rd week to align our reporting year-end more closely with our accounting reference date of 31 March. To aid comparisons with FY16's 52 week reporting period, we also include below the corresponding FY17 figures for the 13 and 52 week periods ended Saturday 25 March 2017:
So here are the proper figures, which are on a LFL basis (i.e. comparing periods which are the same duration);
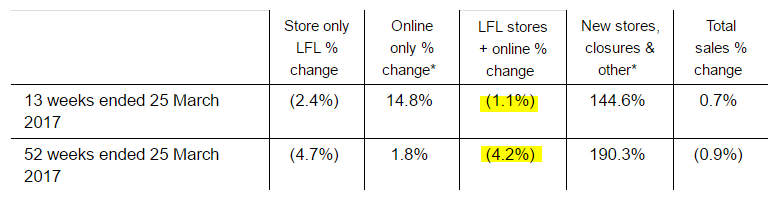
As you can see, there's a significant deterioration when the correct prior year comparison periods are used. Instead of +0.7%, the Q4 sales are now -1.1%.
Note how there was strong growth in online sales in Q4, at +14.8%, which is encouraging. Although this doesn't move the dial much overall, because online sales are still a fairly small part of the total. An older, value-orientated customer base, is not likely to be as receptive to shopping online (especially on smartphones) as younger demographics. So I'm not sure how much opportunity BON has to develop online sales?
Full year expectations - BON follows best practice, and gives a guidance range for what profits it expects each year. This is very helpful for investors, and everyone should do it.
The latest guidance is this;
The Board expects that the pre-exceptional PBT for the 53 week period ended 1 April 2017 will be slightly above the mid-point of the £5.0m to £7.0m range previously quoted on 21 September 2016. The Group`s financial position remains sound.
This is based on sales of roughly £187m, so the profit margin of 3.2% is low. That's my main problem with this company, and other smaller, rather marginal retailers (such as SCS (LON:SCS) ). They can prosper in the good times, but the profit margin can quickly disappear, and turn into losses, in bad times (i.e. recessions).
Therefore how you regard this share really depends on your overall view on how the UK economy is likely to behave. In an economy where consumers are being cautious with their spending, then investing in a low margin, struggling retailer, is probably a bad idea.
PE ratio - in my view, valuing companies on a PE ratio only really makes sense if the business is fairly mature, and profits are sustainable. Companies that are growing rapidly, or where profits are extremely erratic, can be difficult to value using a PER.
As it's difficult to determine whether profits here are likely to rise or fall next year, then how can we possibly value it?
Dividends - another warning sign is the forward divi yield of about 8.7%. That's often (not always though) a warning sign that forecasts are too optimistic. The market is at least pricing in some scepticism over whether earnings and divi forecasts can be met.
Balance sheet - as I've mentioned before, BON does have an excellent balance sheet, with no debt, and plenty of cash. If you look at the Stockopedia 5-year balance sheet page here, you can see the trends, which are very positive.
As you can see, the company has accumulated its profits in the good years, which has led to NAV rising steadily from £6.1m to £32.2m over 5 years, importantly that has been achieved with no increase in the number of shares in issue - which has remained at 50.0m over this period.
Therefore the company is now in a strong position to weather any difficult years in future. That is prudent management of the balance sheet, so to be applauded.
My opinion - with all the headwinds facing retailers, this probably isn't a good sector to be looking at overall, in my opinion. When times are hard, I think it's best to search for the beaten down leaders (like Next (LON:NXT) , in which I hold a long position), rather than chasing the smaller, struggling companies like this one.
Or to ignore the conventional retailers altogether, and search for the best growth companies in eCommerce - although those are usually hideously expensive.
The key metric is the operating profit margin. The higher it is, then the more pricing power a retailer has. Pricing power enables the strongest companies to sail through recessions, remaining profitable. Whereas the weaker players, generating low operating profit margins, struggle to survive in recessions.
I see BON as too uncertain - there's no way of knowing how it might perform over the next few years, and that makes it very difficult to value. So I can't see the point in taking a risk here.
Trifast (LON:TRI)
Share price: 216.6p (up 1.2% today)
No. shares: 120.3m
Market cap: £260.6m
Trading update - for the year ended 31 Mar 2017.
Good performance seems to have already been priced-in here, since there's been little share price reaction today, to what seems another very good update.
The year has ended positively;
On a constant currency basis (CER), the Board is once again pleased to report that the financial year ended 31 March 2017 finished strongly, with the Group's main geographies all contributing to trading results ahead of management expectations;
this reflects compelling underlying organic growth from the key sectors we operate within. In addition, weremain confident in the Group's strategy; our underlying business is delivering against our core KPIs and continues to perform well.
Impressive stuff! A few other points to note;
Forex is helping to boost results overall, but is bringing some "purchase price challenges" for the UK part of the business
Net debt lower than expected
Dividends to be increased
My opinion - there's more detail in the announcement, I've just touched on the key points.
Last time I reported on this company, I questioned the high valuation. Today's ahead of expectations update certainly gives comfort on that front - it looks like the broker forecasts were too cautious, hence the high rating was justified.
This share has had an amazing run since 2009, when it bottomed out at about 8p. If the company can keep growing earnings, then there's no reason why the shares couldn't continue rising. I'm a little sceptical about competitive issues though - surely there must be thousands of companies all over the world that make industrial fastenings? How come this company makes a decent margin, against what must be a huge amount of competition which could undercut them on price, from e.g. low wage economies?
I'm happy to be educated on that point by any readers who know the company better than me.
See what our investor community has to say
Enjoying the free article? Unlock access to all subscriber comments and dive deeper into discussions from our experienced community of private investors. Don't miss out on valuable insights. Start your free trial today!
Start your free trialWe require a payment card to verify your account, but you can cancel anytime with a single click and won’t be charged.