
Good morning and Happy Friday!
This is the usual placeholder article, published the night before, to enable early comments and suggestions from readers.
Best,
Graham
Good morning!
It's quiet in RNS-land, with only a few announcements of interest today.
So I thought I'd spend a few moments explaining what I've been doing with my personal portfolio this year - and please remember that these articles don't count as advice, merely discussion!
One of the practical reasons an article like this can never offer an advisory service is because each of us has our own individual situations, with our own individual investment goals, time horizon, risk tolerance, liquidity requirements and tax situation.
Because of this, even if we all had exactly the same opinion on particular stocks, and by some miracle it was the correct opinion, it wouldn't follow that we would all want to invest the same way. We would still have to tailor our portfolios to each of our individual needs.
With that out of the way: this is what I've been doing in 2017.
In the first half of this year, I added IG Group (LON:IGG) and Next (LON:NXT) to my portfolio (currently 5% and 4% of my portfolio, respectively).
In the second half, so far, I have mostly been selling. This was due to my personal situation where I was bidding on a property and needed to be ready to buy it. So I sold up my lowest-conviction shares and moved 40% into cash.
However, bids on that property eventually moved to a level which I thought represented poor value, so I let it go.
Since then, I've been trying to figure out what is an appropriate level of risk exposure for someone who wants to make a property purchase within the short-term (e.g. within two to three years). As always, greed and fear need to be balanced. There is not going to be an exact or a perfectly scientific answer.
One thing that plays on my mind is the belief that with the FTSE at c. 7400 and the Dow at 23,500, there is the pronounced risk of a broad market sell-off.
In normal circumstances, I would welcome such a sell-off for the buying opportunities it would present, but in my specific circumstances, I might not be able to exploit those opportunities and could instead be a forced seller into those weaker markets.
The S&P 500 PE ratio is currently estimated at c. 26x, and this at a time when corporate balance sheets are weaker than usual and earnings are potentially at the top of their cycle after a decade of zero interest rates. There is an air of complacency in equity markets and perhaps even more in the bond markets, as indicated below:
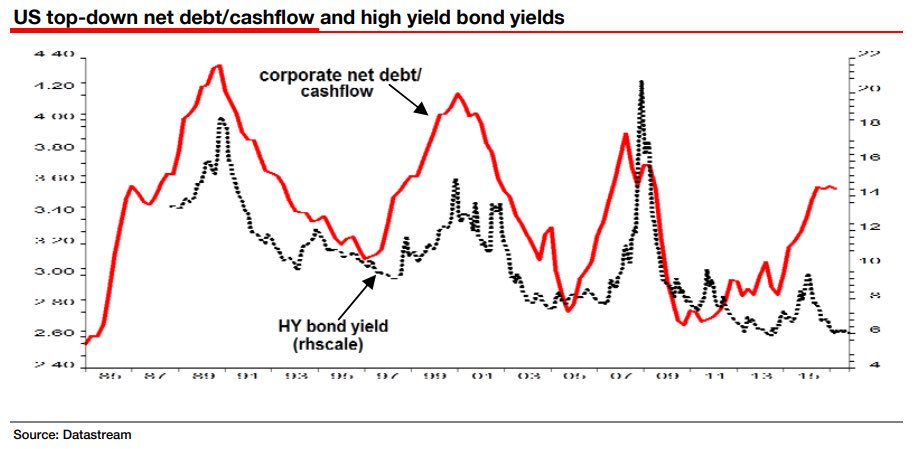
(Hat-tip: Jesse Felder)
And if the US markets sneeze, I expect that the FTSE will catch a cold.
To reiterate something I said in the recent interview with Paul: I'm not trying to time a crash in the equity markets. What I'm trying to do is invest in a responsible way, given my belief that the markets are potentially vulnerable. UK retail sales have shown their first annual fall since 2013, the job market is mixed, and equity valuations generally are full.
So I'm still 40% in cash, despite having made a few small purchases in recent months. I'm inclined to move slowly back into equity, in a controlled way, and perhaps on the condition that I see some cooling in the overall temperature of the markets. Because while I do hope and intend to outperform the overall market, I'd much rather not have to outperform in order to generate a decent return, particularly since I might be a forced seller in the next few years.
Of course, readers are unlikely to face precisely the same dilemma as me. I imagine that most of you are saving towards retirement, in which case you probably have a longer time horizon and a sell-off over the next two or three years can be handled in a different way. But I know that some of you do try to manage your equity exposure depending on the temperature of the markets, so I hope this was interesting for you. What do you think - is now a good time to be fully invested? If we are confident in our stock picks, should we be fully invested regardless of the overall temperature in the markets?
T Clarke (LON:CTO)
- Share price: 76.25p (+4.3%)
- No. of shares: 41.8 million
- Market cap: £32 million
Thanks to readers for suggesting continued coverage of this building services group, which announced an in line trading update today.
Our trading performance during the period has continued to justify that optimism and the Board is pleased to report that the results for the year ending 31 December 2017 are expected to be in line with current market expectations, which are an underlying profit before taxation of £6.5m and revenues in excess of £300m.
Checking back in the archives, I see that the underlying PBT was previously forecast at £6.1 million, and revenues were previously forecast at £300 million (rather than in excess of £300 million).
The broker consensus trend chart illustrates this year's earnings upgrades very nicely: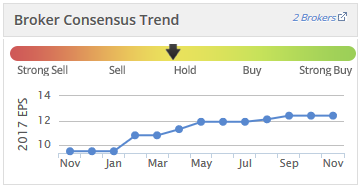
The update also helpfully lets us know that the company's cash position is strong (£9 million) despite £3 million in unusual capex on an acquisition and a prefab manufacturing facility.
Contract-oriented groups like this often see chunky cash payments and a consequently volatile cash position. T Clarke (LON:CTO) emphasises that its cash position is affected by the timing of its payments.
We are also presented with a highlight reel of noteworthy recent project wins, and the final paragraph is as follows:
There remains a clear demand for our specialist services in the markets in which TClarke operates. We have already secured £190m and £100m of our planned revenues for 2018 and 2019 and beyond, respectively, and we are encouraged by the number and quality of the opportunities that continue to be available both within our established M&E markets [GN Note: Mechanical & Electrical] and from the new opportunities that we are pursuing, driven by sustained investment at national level in both technology and infrastructure. The future for the Group remains encouraging.
So that's £290 million of revenues secured for the next two financial years and the key leading indicator, the forward order book, now stands at £380 million, just a small decrease compared to the record high achieved a few months ago.
It can't be expected that the order book would go up in a straight line. Instead, it's the bigger picture that counts. This metric is up nearly 20% against where it was a year ago.
Readers have pointed out the strength of £CTO's Value Rank, but questioned whether it might be illusory:
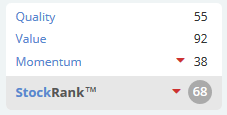
There is a case to be made that the company is not as cheap as it first appears.
On the pension front, checking the interim results, there is a deficit as follows:
| 30 June 2017 | |
| Present value of obligations | £56.9 million |
| Fair value of assets | £34.6 million |
| Deficit | £22.3 million |
The assumptions underpinning these estimates are all helpfully laid out, so actuarial nerds can check if they might be on the optimistic or the pessimistic side.
As you can see, there is an element of leverage involved here since a 1% increase in the pension obligation would increase the £22.3 million deficit by 2.5% and reduce T Clarke's equity by almost £600k.
From 2019, T Clarke is scheduled to make payments to reduce this deficit of about £2 million per annum.
On the positive side of things, I expect that the mismatch between "underlying PBT" and reported PBT is going to reduce now that the major non-recurring cost associated with cash going missing from one of its subsidiaries may now have been fully accounted for.
At the interim results, £0.4 million of associated non-recurring cost was included. Hopefully this will fall to zero in H2.
In my view, the big question is whether you want to invest in this sector and at this particular point in the construction and property cycle.
The operating margin reduced in H1 to 2.0% despite management's stated goal to improve this metric. Long-term, this company and this sector never delivers great margins, which unfortunately means that there is never a great margin for error when things go wrong, as they occasionally do with large and complex projects.
If you have a strong positive view that this sector can continue to enjoy a lot more positive momentum of the kind that it's been enjoying, then maybe I can see the case for investing here. But with £2 million going out the door every year for pensioners for the foreseeable future, and given the low margin for error, it's still not one that appeals to me.
The enterprise value is c. £54 million when you include the pension deficit. Value territory for me would be when the enterprise value was c. 7x forecast earnings.
Record (LON:REC)
- Share price: 46.25p (-2%)
- No. of shares: 199 million
- Market cap: £92 million
This is a specialist currency asset manager. We already knew its Q2 Assets under Management thanks to a previous trading update, and I commented on that last month. Now we get the complete half-year results.
It's a steady set of figures. As I've mentioned before, client numbers are modest at 59, which is somewhat concentrated in my book.
Overall, though, I like this company. It bought back a decent chunk of its own shares a few months ago, too, which seems like a smart move to me, as the valuation seemed reasonable and the company was holding an excessive amount of cash. I like buybacks compared to dividends, because they are usually structured to allow shareholders who don't wish to participate, to increase their percentage stake in the company. So everyone's a winner.
Anyway, back to these results:
- AUME1 increased to $61.2bn / £45.6bn ($58.2bn / £46.6bn at 31 March 2017) [GN Note: we already knew this.]
- Client numbers remained at 59 at the end of the six month period [GN Note: we already knew this, too.]
- Revenue2 of £12.2m was in line with the second half of last year, and represented an increase of 14% compared to the six months ended 30 September 2016 (£10.7m)
Here is a quick explanation of AUME, for those who are new to Record:
As a currency manager, Record manages only the impact of foreign exchange and not the underlying assets, therefore its "assets under management" are notional rather than real. To distinguish this from the AUM of conventional asset managers, Record uses the concept of assets under management equivalents "AUME" and by convention this is quoted in US dollars.
PBT is up 6% to £3.8 million.
The operating margin here is 31%, in stark contrast to the first company I covered today.
We also get a surprisingly large, 39% increase in the interim dividend, up to 1.15p. Shareholder rewards are a big priority for Record at the moment. Though if you adjust for the lower number of shares outstanding now, I think the size of the payout in total cash terms will increase by something closer to 25%.
As discussed previously, UK clients in the Dynamic Hedging products withdrew funds, switching to passive products. My interpretation of this is that they abandoned efforts to time their sales of GBP, instead preferring to sell up immediately. The vast majority (85%) of Record's AUME is in a lower-margin Passive Hedging product, though there has been an encouraging increase in the Currency for Return offering.
Despite its low average percentage of total AUME, Dynamic Hedging was responsible for 23% of management fee income:
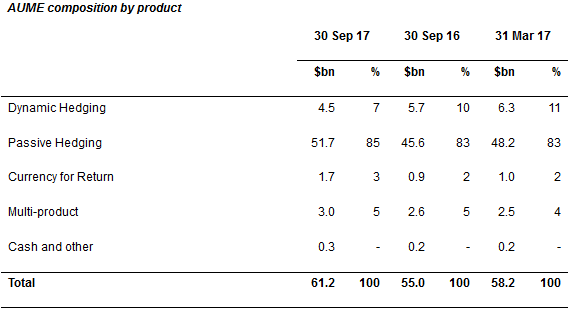
Passive hedging fees are only about 3bps per annum, versus 14 - 18bps in the other categories. So it's really important to try to sell the higher value products.
My opinion
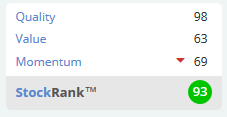
I still think this is a fine business, and am still keeping it firmly on my watchlist and contemplating a purchase. I'm just a little disappointed with myself for not buying it when it was cheaper! The share price was less than 30p for most of last year.
It's certainly something I'd like to build a position in, and Stockopedia agrees:
That's it for today and this week, cheers! See you next week.
Graham
Footnote:
Carillion (LON:CLLN)
- Share price: 22.375p (-46%)
- No. of shares: 430 million
- Market cap: £96 million
I thought I should briefly mention this construction/support services group, whose shares have crashed today and which was covered heavily in the mainstream media.
Today's update informs us that self-help measures will not be sufficient to reduce net debt/EBITDA to the target of less than 1.5x by the end of 2018, and so:
The Board is therefore in discussions with stakeholders regarding a broad range of options to further reduce net debt and repair and strengthen the Group's balance sheet. This will require some form of recapitalisation, which could involve a restructuring of the balance sheet.
This isn't too surprising. It's confirmation of what most people have thought for a while, including the many shorters of this stock. At least 16% of Carillion stock is still out on loan, according to the most recent disclosures (this figure was over 20% earlier this year).
Even my untrained eye, back in July, said that an equity raise could be on the cards.
What's more interesting and was not confirmed up until today, was that covenant failure would happen as soon as December:
The Group now expects that a combination of delays to certain PPP disposals, a slippage in the commencement date of a significant project in the Middle East and lower than expected margin improvements across a small number of UK Support Services contracts, partially offset by cost savings initiatives realised in the fourth quarter, will lead to profits for the year to 31 December 2017 being materially lower than current market expectations. Given the impact of delays in receipts and disposals, the Group now expects full year average net borrowing in 2017 to be between £875m and £925m.
Based on its latest forecasts, reflecting the items mentioned above, the Board now expects a covenant breach as at 31 December 2017.
It's the same old litany of bad news from support services contractors: delays, slippages and margin vulnerability.
That forecast average net debt range is significantly worse than the forecast range given at the half-year results, of £825 - £850 million.
What it means is that on an enterprise value basis (market cap plus average 2017 net debt), Carillion's valuation is still around the £1 billion mark. This does not include a pension deficit of c. £600 million.
Drowning in debt and uninvestable before it has been recapitalised, I'm afraid.
See what our investor community has to say
Enjoying the free article? Unlock access to all subscriber comments and dive deeper into discussions from our experienced community of private investors. Don't miss out on valuable insights. Start your free trial today!
Start your free trialWe require a payment card to verify your account, but you can cancel anytime with a single click and won’t be charged.