
Good morning, it's Paul here.
I've got a clear diary this week, so will be able to focus entirely on the SCVRs, after last week's rather poor coverage - my apologies for that.
Political chaos continues. It seems that Mrs May's bizarre plans for EU withdrawal in name only, are finally unravelling. What surprises me so much, is why she was given free rein for 2 years, to pursue a negotiation strategy that seems to please nobody! I read the "Chequers" white paper, and it's total nonsense, from start to finish. Perhaps it's been a deliberate strategy, to sabotage Brexit?
Anyway, all that matters for the purposes of these reports, is to what extent all this chaos has been baked into share prices already? Normally when news is widely known, then the market discounts this into valuations.
As previously mentioned here, I pruned my portfolio back over the summer, to leave just my large, high conviction holdings (which you can see here in BMUS). I'll hold these through any future volatility. Unless something goes wrong with the company fundamentals of course. All the political stuff will get sorted out, one way or another, it always does.
In the meantime I'm noticing a buyer's strike in many small caps that I follow. That's understandable really. After all, why buy now, with so much uncertainty around? There has to be a compelling reason and/or attractive valuation, to make me buy anything at the moment. One benefit of this, is that I've noticed the market is almost overlooking some good results statements. There could therefore be pent-up demand in those stocks, which could rise strongly when political problems get resolved. So I am searching for buying opportunities at the moment. If some investors/punters are panic or forced sellers, plus inaction after good announcements, this can all produce buying opportunities, selectively.
Anything that is rising in current market conditions, is worth looking at. If investors are prepared to buy now, then this suggests to me something good is probably going on at the company concerned.
Market timing - I don't try to time the ups & downs of any stocks in my portfolio. It's not possible to move in & out of small caps in any significant size, so market timing is impossible, unless your position sizes are very small. Plus, the spread is ridiculously wide in many small caps, when there's very little volume being traded. So people who think they can time the market, are best off sticking with mid to large caps.
Carr's (LON:CARR)
Share price: 160.75p (up 3.0% today, at 11:19)
No. shares: 91.4m
Market cap: £146.9m
Carr's (CARR.L), the Agriculture and Engineering Group, announces its results for the year ended 1 September 2018.
This has cropped up on my radar today, as the headline figures look strong - hence worthy of a closer look;
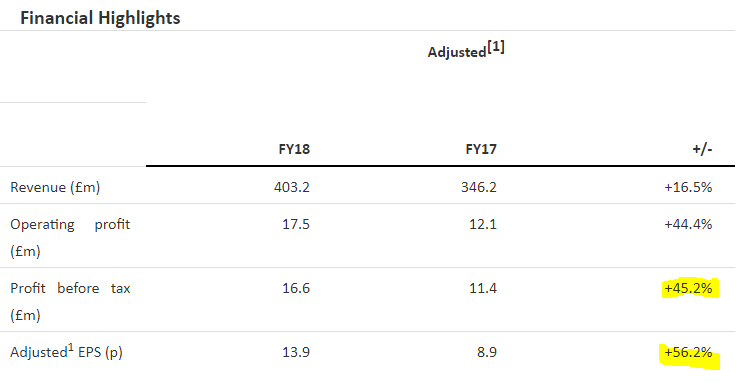
The first step with adjusted figures, is to investigate whether or not the adjustments are reasonable in nature, and size?
The footnote says this;
[1] Adjusted results are after adding back amortisation of acquired intangible assets and non-recurring items including acquisition costs (note 3)
I'm relaxed about adding back the amortisation of acquired intangible assets. This is because I'm not interested in seeing whether historic acquisitions paid for their own goodwill. It doesn't matter at this stage, because we cannot turn back time and undo previous acquisitions.
All that concerns me, is how much profit & cashflow the business is generating now, and is likely to generate in the future? So in valuing the shares, I routinely write-off all acquired intangible assets from the balance sheet, and reverse the amortisation charge - which is standard practice for most investors & analysts.
Here is what note 3 says, giving more detail of the adjustments;
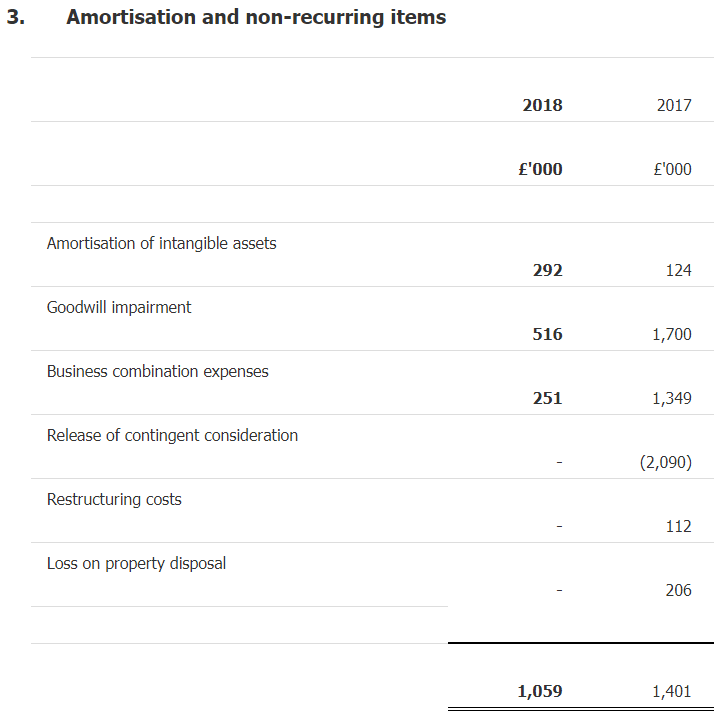
Explanations of each item are given further down note 3, but I won't repeat that here, as there's nothing worrisome in the explanations.
In the context of a company reporting £17.5m adjusted profit before tax, the items above strike me as genuine and reasonable adjustments. Therefore I am happy to rely on the adjusted numbers in valuing this share.
Balance sheet - I won't go into the detail, but it looks fine to me.
Net debt of £15.4m looks under control, and not excessive given the size & profitability of the business.
Cashflow statement - cash generation was lower than last year. Why is that, given that profit rose so much? The culprit is the working capital movements, which were positive last year, and negative this year. I'm generally relaxed about this, as working capital movements tend to be swings & roundabouts at decent companies. Worries only emerge if cashflow is consistently poor or negative - which is not the case here.
Everything else looks reasonable. Capex is not high. Very large dividends were paid last year, of £19.5m, which looks like it must have been a special dividend. A quick check on Stockopedia (under the "Accounts" tab on the company's StockReport) shows that indeed a 17.54p special dividend was paid in Oct 2016 - early in the prior financial year.
Having done my sense checks on the balance sheet & cashflow, let's go back to the P&L performance and outlook.
Earnings beat - results of adjusted EPS at 13.9p looks to be a decent beat against expectations. Stockopedia shows broker consensus forecast of 12.7p.
Note the positive trend of consensus broker forecast over the last 12 months;
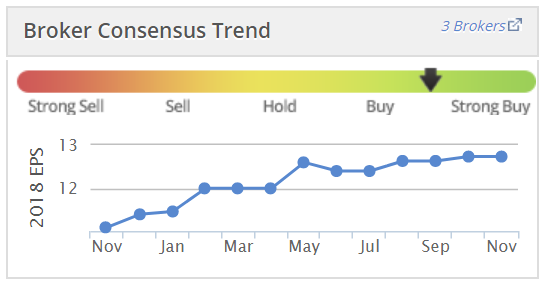
The PER is 11.6 - which looks good value for a company which is beating forecasts.
Why has profit risen? In overview the company says;
This performance was largely as a result of investments we made across the business in recent years, in addition to a recovery in our underlying markets...
Outlook comments - sound positive, although some doubt is expressed about trading relationships (Brexit, US/EU tariffs, etc). More detail is given, but this is a summary paragraph from the company;
"Trading for the new financial year has started in line with the Board's expectations. We made further progress during the year on our strategic objectives and continue to believe the breadth of our product offering, investments in acquisitions and research, and our international footprint leaves us well positioned for further growth across both our divisions in the medium term."
Note the "medium term" words at the end of that section. Perhaps implying that short term growth might not be so sure?
My opinion - this is not the type of investment that I would be interested in, as I don't understand its end markets. However, it's certainly worth me flagging that it appears to be performing well, and priced modestly. So readers might want to take a closer look, perhaps.
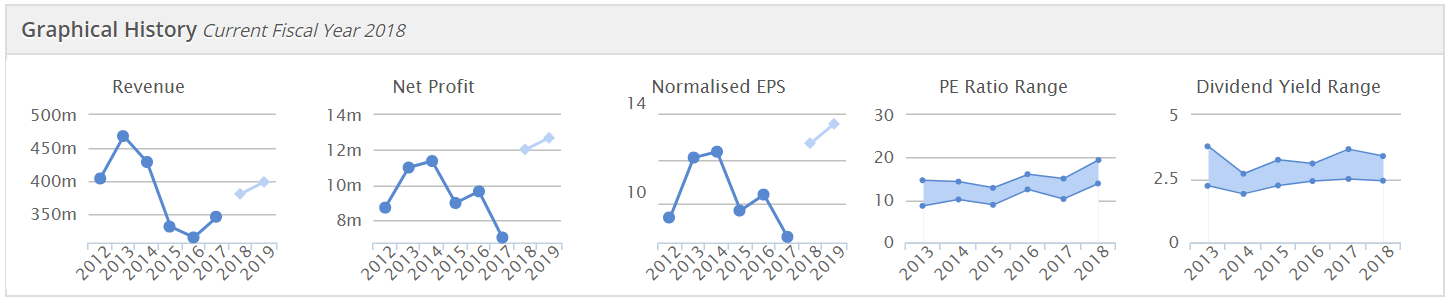
The Stockopedia historical graphs are helpful (see below). These show that improved performance is really just recouping from several years' poor performance. What is the future growth potential here? Is it exciting enough to justify parking some money in this share? I don't really know.
Restaurant (LON:RTN)
A quick comment on this deeply discounted Rights Issue.
My view is that management might be over-paying for Wagamama. Rather than abandon a poor strategy, they seem to have ploughed on regardless - perhaps Theresa May is advising them?!
The acquisition price looks too high on the existing numbers. However, EV/EBITDA drops to 8.7 once substantial anticipated synergies of £22m are taken into account. Site conversion synergies presumably means that poorly performing TRG sites might be converted in Wagamamas? That's not a bad idea actually, if Wagamama can generate a better return from some existing sites.
A massively discounted Rights Issue is a lousy way of doing things, in my view. It essentially forces shareholders to invest, rather than getting them to invest through enthusiasm for the deal. Plus the costs are likely to be substantial, particularly underwriting fees.
People who don't take up their rights would be heavily diluted. Although there might be a facility for shareholders to sell their nil paid rights, which I've seen happen before with rights issues. Ah yes, checking the details, the nil paid rights will indeed commence trading on 29 Nov 2018.
I wouldn't consider buying Restaurant (LON:RTN) . The problem is, the group has ongoing issues with its existing brands, which are looking tired & outdated. So why buy something else, when management attention is needed to improve the existing business?
Current trading information is interesting, and could have read-across for the sector more generally;
For the 11-week period from 20 August 2018 to 4 November 2018, Wagamama's like-for-like sales increased by 12.2 per cent. As of 4 November 2018, Wagamama's like-for-like sales had outperformed the market, as measured by the Coffer-Peach tracker, for 233 consecutive weeks
That's a remarkable performance, given that the casual dining sector is supposedly dying on its arse. Maybe RTN has spotted a good deal after all? I'm beginning to warm to this. The share price has only fallen 4% today, to 240p, so it looks as if the market is also warming to the deal - since such a deep discount (the Rights Issue Price is 108.5p) might have triggered a bigger sell-off today.
Trading at RTN has also turned positive in recent weeks, again perhaps a surprise on the upside?
TRG has continued to make good progress, and like-for-like sales are up 1.4 per cent. in the 14-week period since the end of the FIFA World Cup.
Overall then, it will be interesting to see how this pans out.
There's clearly life in the casual dining sector, after all.
Northern Bear (LON:NTBR)
Share price: 79.5p (up 1% today, at 13:33)
No. shares: 18.5m
Market cap: £14.7m
... unaudited interim results for the Company and its subsidiaries (together the "Group") for the six months to 30 September 2018.
This is a building services company. I don't recall ever having researched it myself. I tend to avoid building services companies, as they're often subject to lumpy and/or problematic contracts, and exposed to considerable cyclicality.
Looking into our archive, Graham has written about it quite a lot, and seems to like it.
Stockopedia's algorithms also like it, with a very high StockRank;

The financial highlights certainly look good, and remember this is just for the half year. Impressive numbers for a company with a market cap of only £14.7m, so at first sight it looks good value.
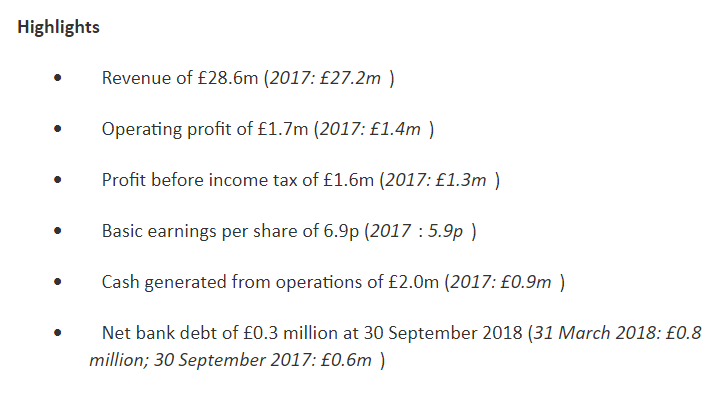
Net debt - the company's reporting on this important area is excellent, check this out;
The operating cash generation in the period was outstanding, although I would emphasise that this represents a snapshot at a particular point in time and our net cash/bank debt position can move by up to £1.5m in a matter of days given the nature, size and variety of contracts that we work on and the related working capital balances.
For information, the lowest net bank debt position during the period was £nil, the highest was £1.8 million, and the average was £0.9 million.
I absolutely love the reporting of lowest, average & highest net debt positions throughout the period. That is incredible helpful. Wouldn't it be great if all companies reported this information? It should be a requirement actually, as it would help prevent year end window-dressing of balance sheets.
Outlook - sounds positive;
The results for the Period were exceptionally strong and we continue to hold a high level of committed orders.
The Board considers the outlook for trading in the second half of the year to be very good and we hope to report another strong set of results for the full financial year.
Valuation - a bit tricky, as I haven't found any broker forecasts. Taking a guess, based on the positive outlook statement today, the uplift on H1 vs. H1 LY, and the seasonality of last year's H1/H2, then my best guess is that this year could come in around 13-15p EPS.
If that is correct, then at 79.5p share price, the current year PER range is 5.3 to 6.1 - that does look cheap.
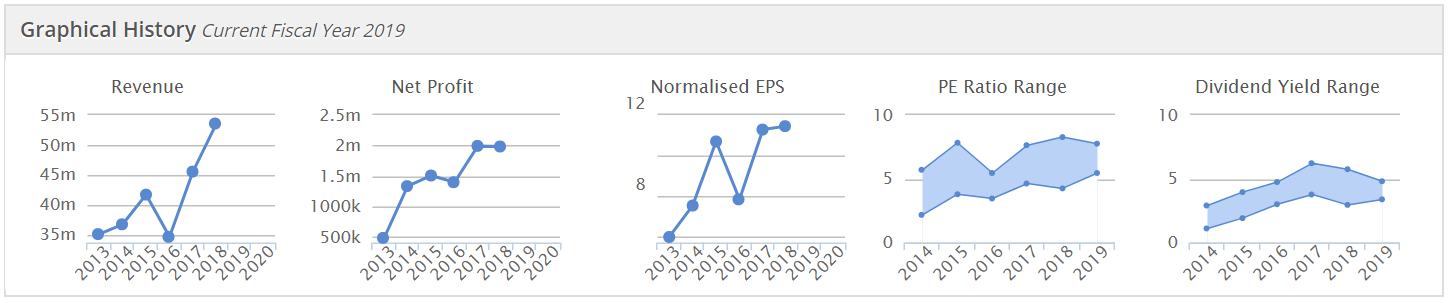
A word of caution though - this seems to be a permanently cheap share, as you can see from the PER range in graph 4 below;
Balance sheet - is pretty thin. NTAV is only £1.4m, so there's not really any support here, if something were to go wrong.
This also means that I wouldn't place any reliance on dividends - they would probably need to be cancelled in the next recession.
My opinion - the PER may seem cheap at first sight, but a small company, in this sector, should be cheap. I don't think it is well suited to being a stock market listed company - too small, and illiquid.
Overall then, it's not for me. Although I can see why some investors would see a good bull case here - there's a very nice upward trend in revenues & profits, from graphs 1 & 2 above. Plus strong current trading & positive outlook for H2, is quite impressive.
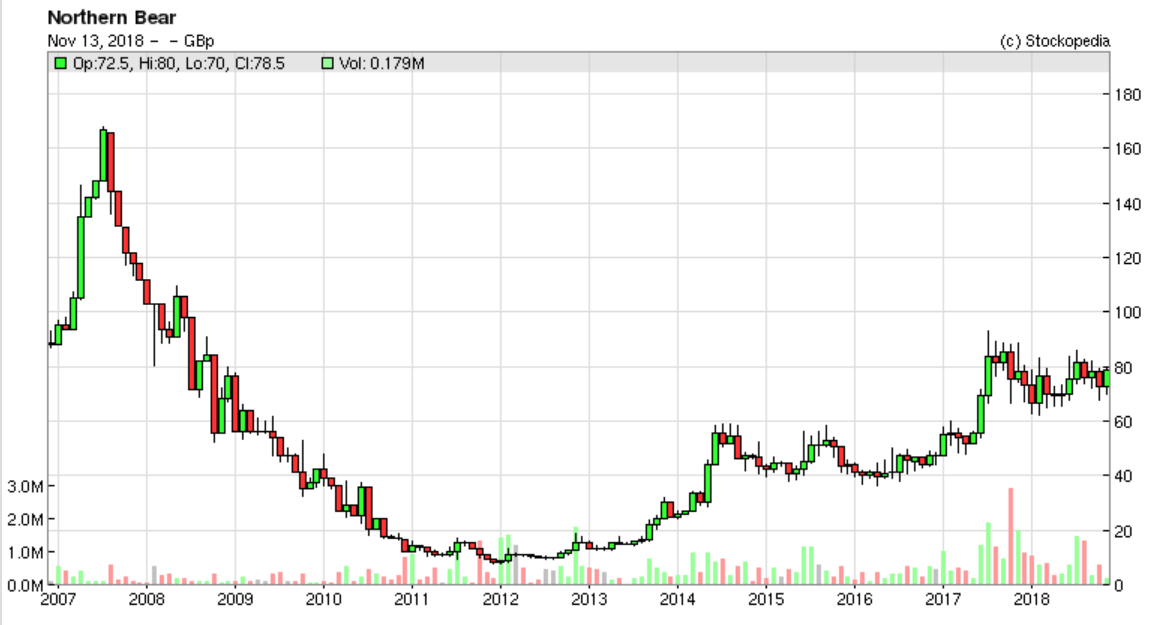
Here's an interesting long-term chart for you;
All done for today! See you in the morning.
Regards, Paul.
See what our investor community has to say
Enjoying the free article? Unlock access to all subscriber comments and dive deeper into discussions from our experienced community of private investors. Don't miss out on valuable insights. Start your free trial today!
Start your free trialWe require a payment card to verify your account, but you can cancel anytime with a single click and won’t be charged.