AIM just broke below its moving averages. Here’s why that matters.

If you invest in AIM stocks, you'll have felt the pain already. UK small caps have been hit by the Iran War, and last Monday, the FTSE Aim All Share dropped below both its 120-day and 200-day moving averages.
If your eyes glaze over with technical analysis, I don't blame you. But there's real power in simple indicators. I've been tracking them for years, as they have a remarkable track record for timing.
In October 2023, we noted that AIM was at its most oversold since the global financial crisis. The index was deep below its 120-day moving average and there were no buyers in sight. The market put in a bottom two weeks later. After another couple of months, AIM broke above its moving average and we called the trend change. AIM rallied strongly from those lows.
Now, the same signal that said be brave is saying be careful. So I’ve gone back through 30 years of data to understand whether to pay attention.
AIM - a game of two halves
Back in 1996, the FTSE AIM All Share Index (FTSE:AXX) was priced at 1,017. Today it’s 774. Yes, a buy-and-hold investor in AIM stocks has lost money over 30 years. Dismal AIM indeed.
But behind that grim headline hides something rather remarkable. AIM hasn't just ground lower - it has seen some glorious bull runs countered by equally painful drawdowns. Yes, AIM is full of many poor companies, but it trends. I treat it as the only genuine barometer of private investor animal spirits. Bullish and bearish regimes have unique characteristics - and a simple moving average can tell you which one you are in.
I've tested the 120-day and 200-day moving averages across 30-years of history to paint the full picture.
AIM vs 120-day moving average (MA):
| Regime | Days | % of Time | Annualised Return | Volatility |
|---|---|---|---|---|
| Above MA | 3,748 | 49.9% | +22.7% | 11.6% |
| Below MA | 3,762 | 50.1% | -20.4% | 14.7% |
| Buy & Hold | 7,510 | 100% | -1.2% | 13.3% |
When AIM is above its 120-day moving average, it returns +22.7% annualised. When it's below - the regime it just entered - it loses -20.4% annualised. That's a 43-percentage-point spread between the two regimes. Andl ook at the volatility difference. Above the moving average, you see higher returns and lower risk - below it, you suffer higher losses and more volatility - it's the worst of both worlds.
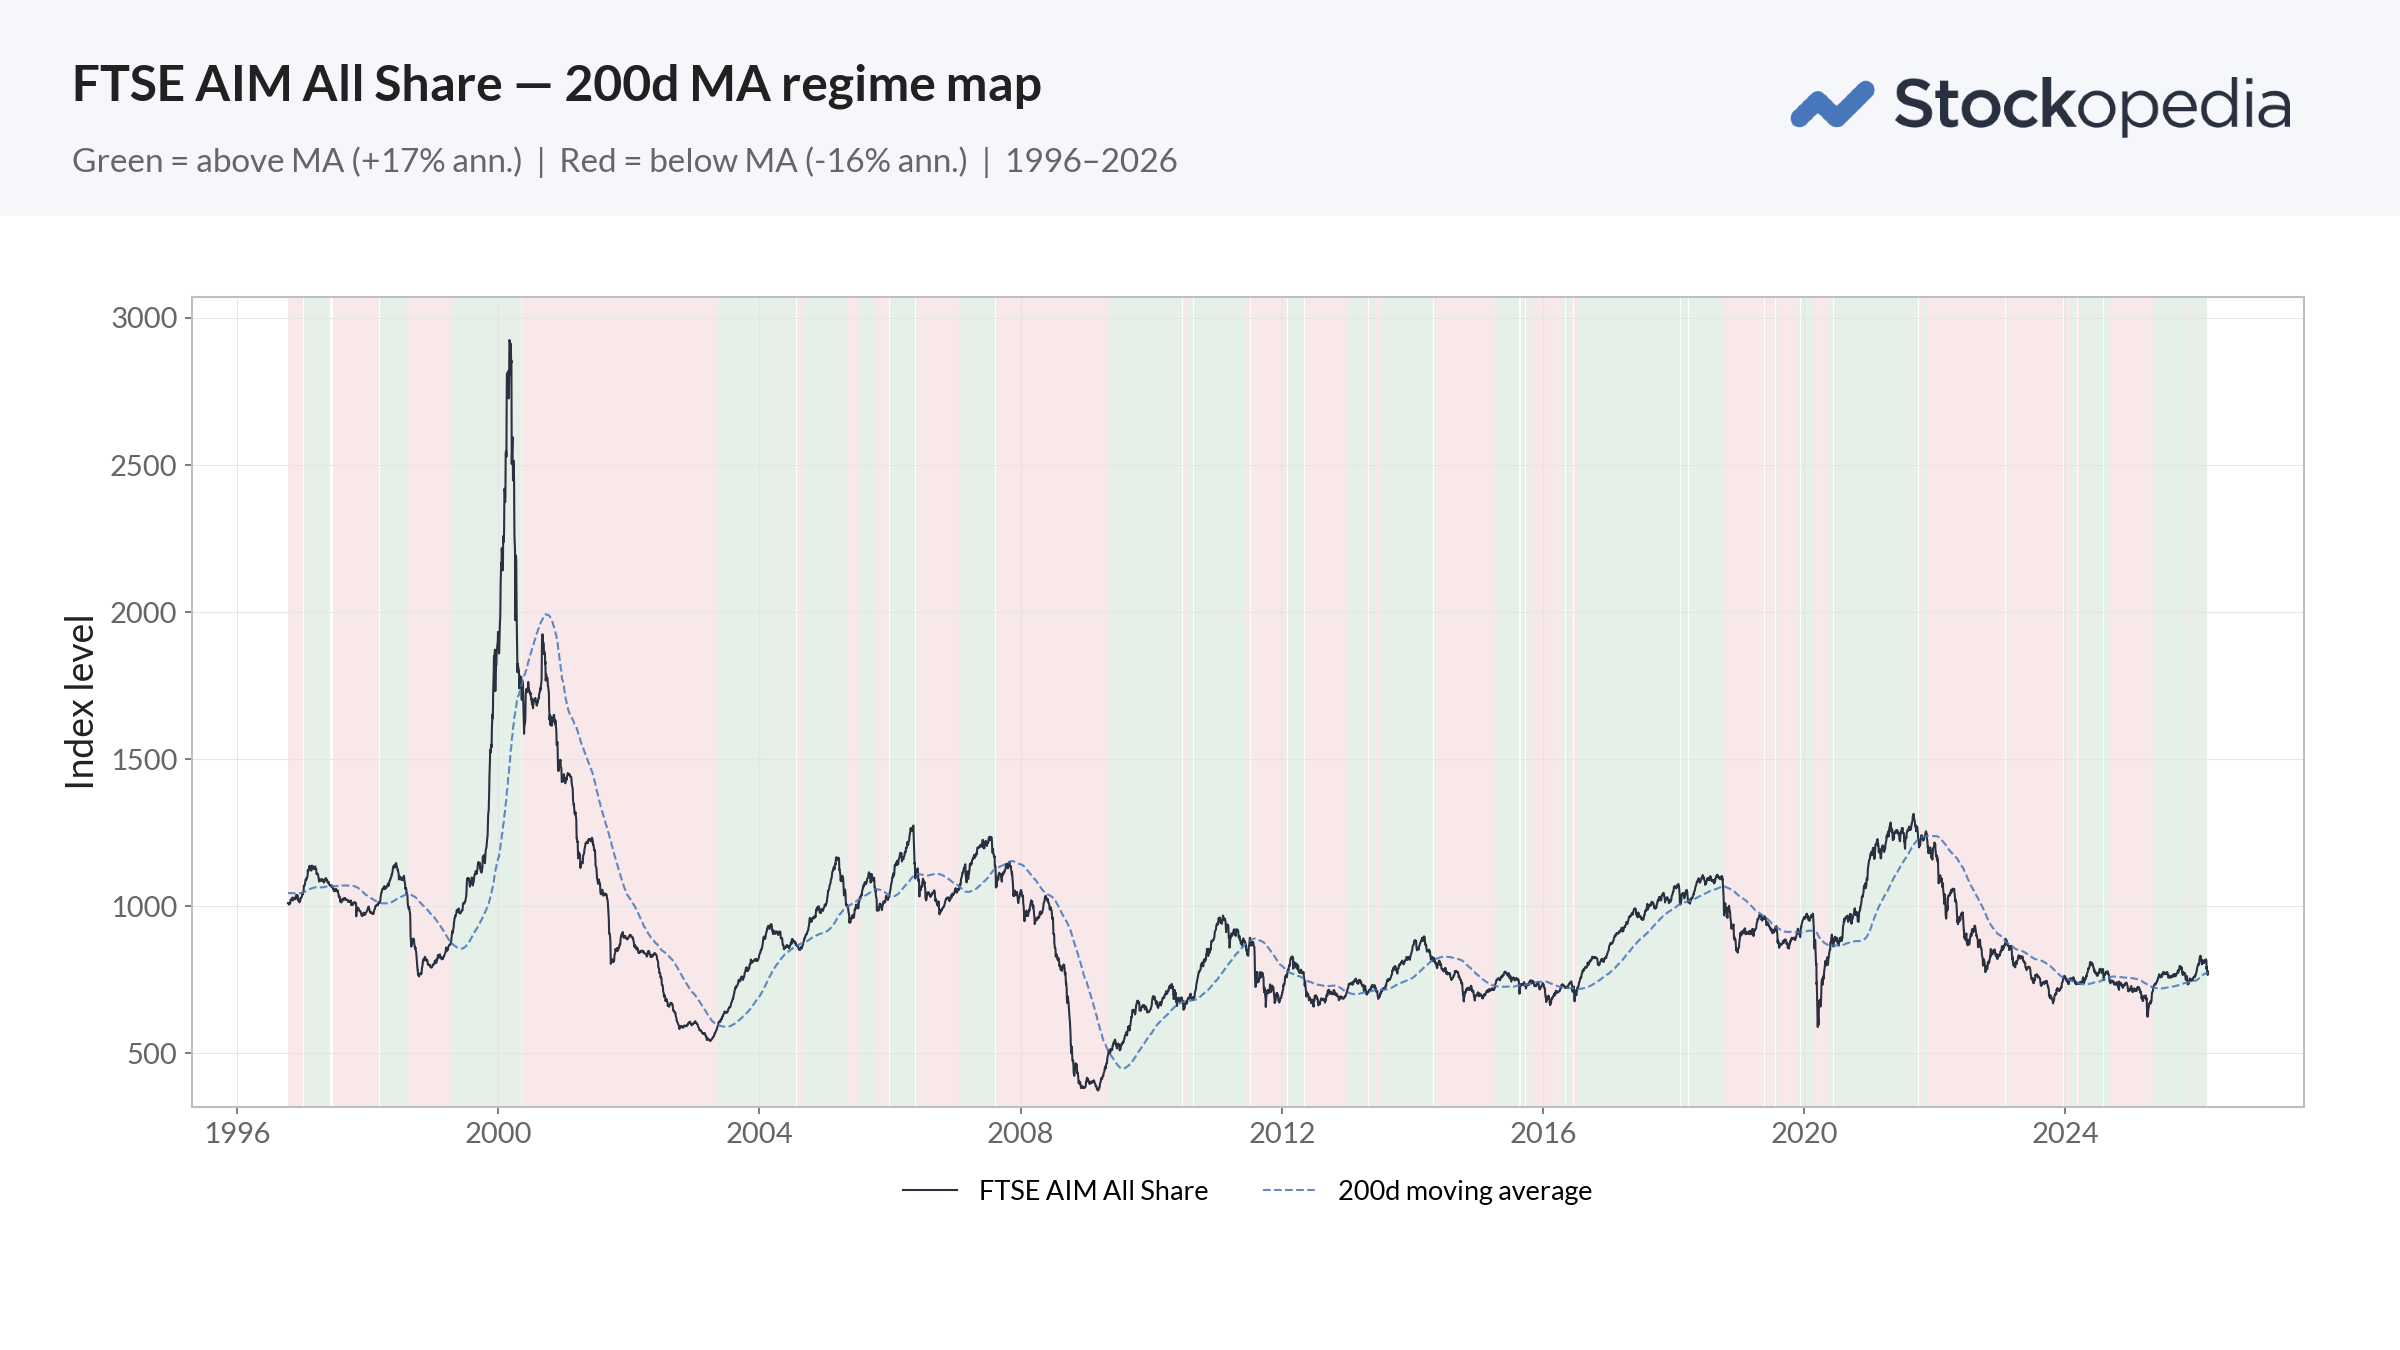
The 200-day moving average tells the same story with a 32% spread. AIM has now broken below both.
AIM vs 200-day moving average:
| Regime | Days | % of Time | Annualised Return | Volatility |
|---|---|---|---|---|
| Above MA | 3,656 | 49.2% | +17.0% | 12.2% |
| Below MA | 3,774 | 50.8% | -15.6% | 14.3% |
| Buy & Hold | 7,430 | 100% | -0.9% | 13.3% |
The chart below illustrates this pulse of red and green regimes.
What this signal has done in the past
We can set up a hypothetical trading rule from these observations. Own AIM stocks when the index closes above its moving average. Stay in cash when it closes below. No leverage. No shorting. Just long or out.
That seems unrealistic, brutal even, but the idea isn't new. Meb Faber's widely read research on tactical asset allocation showed that buying the S&P 500 when it's above its 10-month moving average and selling when below delivered better returns and lower drawdowns than buy-and-hold. It's one of the simplest rules in finance - and it works because markets trend. AIM, it turns out, trends as strongly as anything - but only 50% in the right direction!
If we assess this long-only strategy results over 30 years:
| Strategy | Annualised | Total Return | Max Drawdown | Signals |
|---|---|---|---|---|
| 120d MA Long Only | +10.7% | +1,992% | -41.4% | 117 |
| 200d MA Long Only | +8.0% | +873% | -41.1% | 128 |
| Buy & Hold | -1.2% | -30.0% | -87.2% | - |
The 120-day moving average turned a -30% loss into a +1,992% gain. That's roughly 20 times your money instead of losing a third of it.
So simply stepping aside in weaker market regimes appears to turn AIM's lead into gold. Who'd have thought?
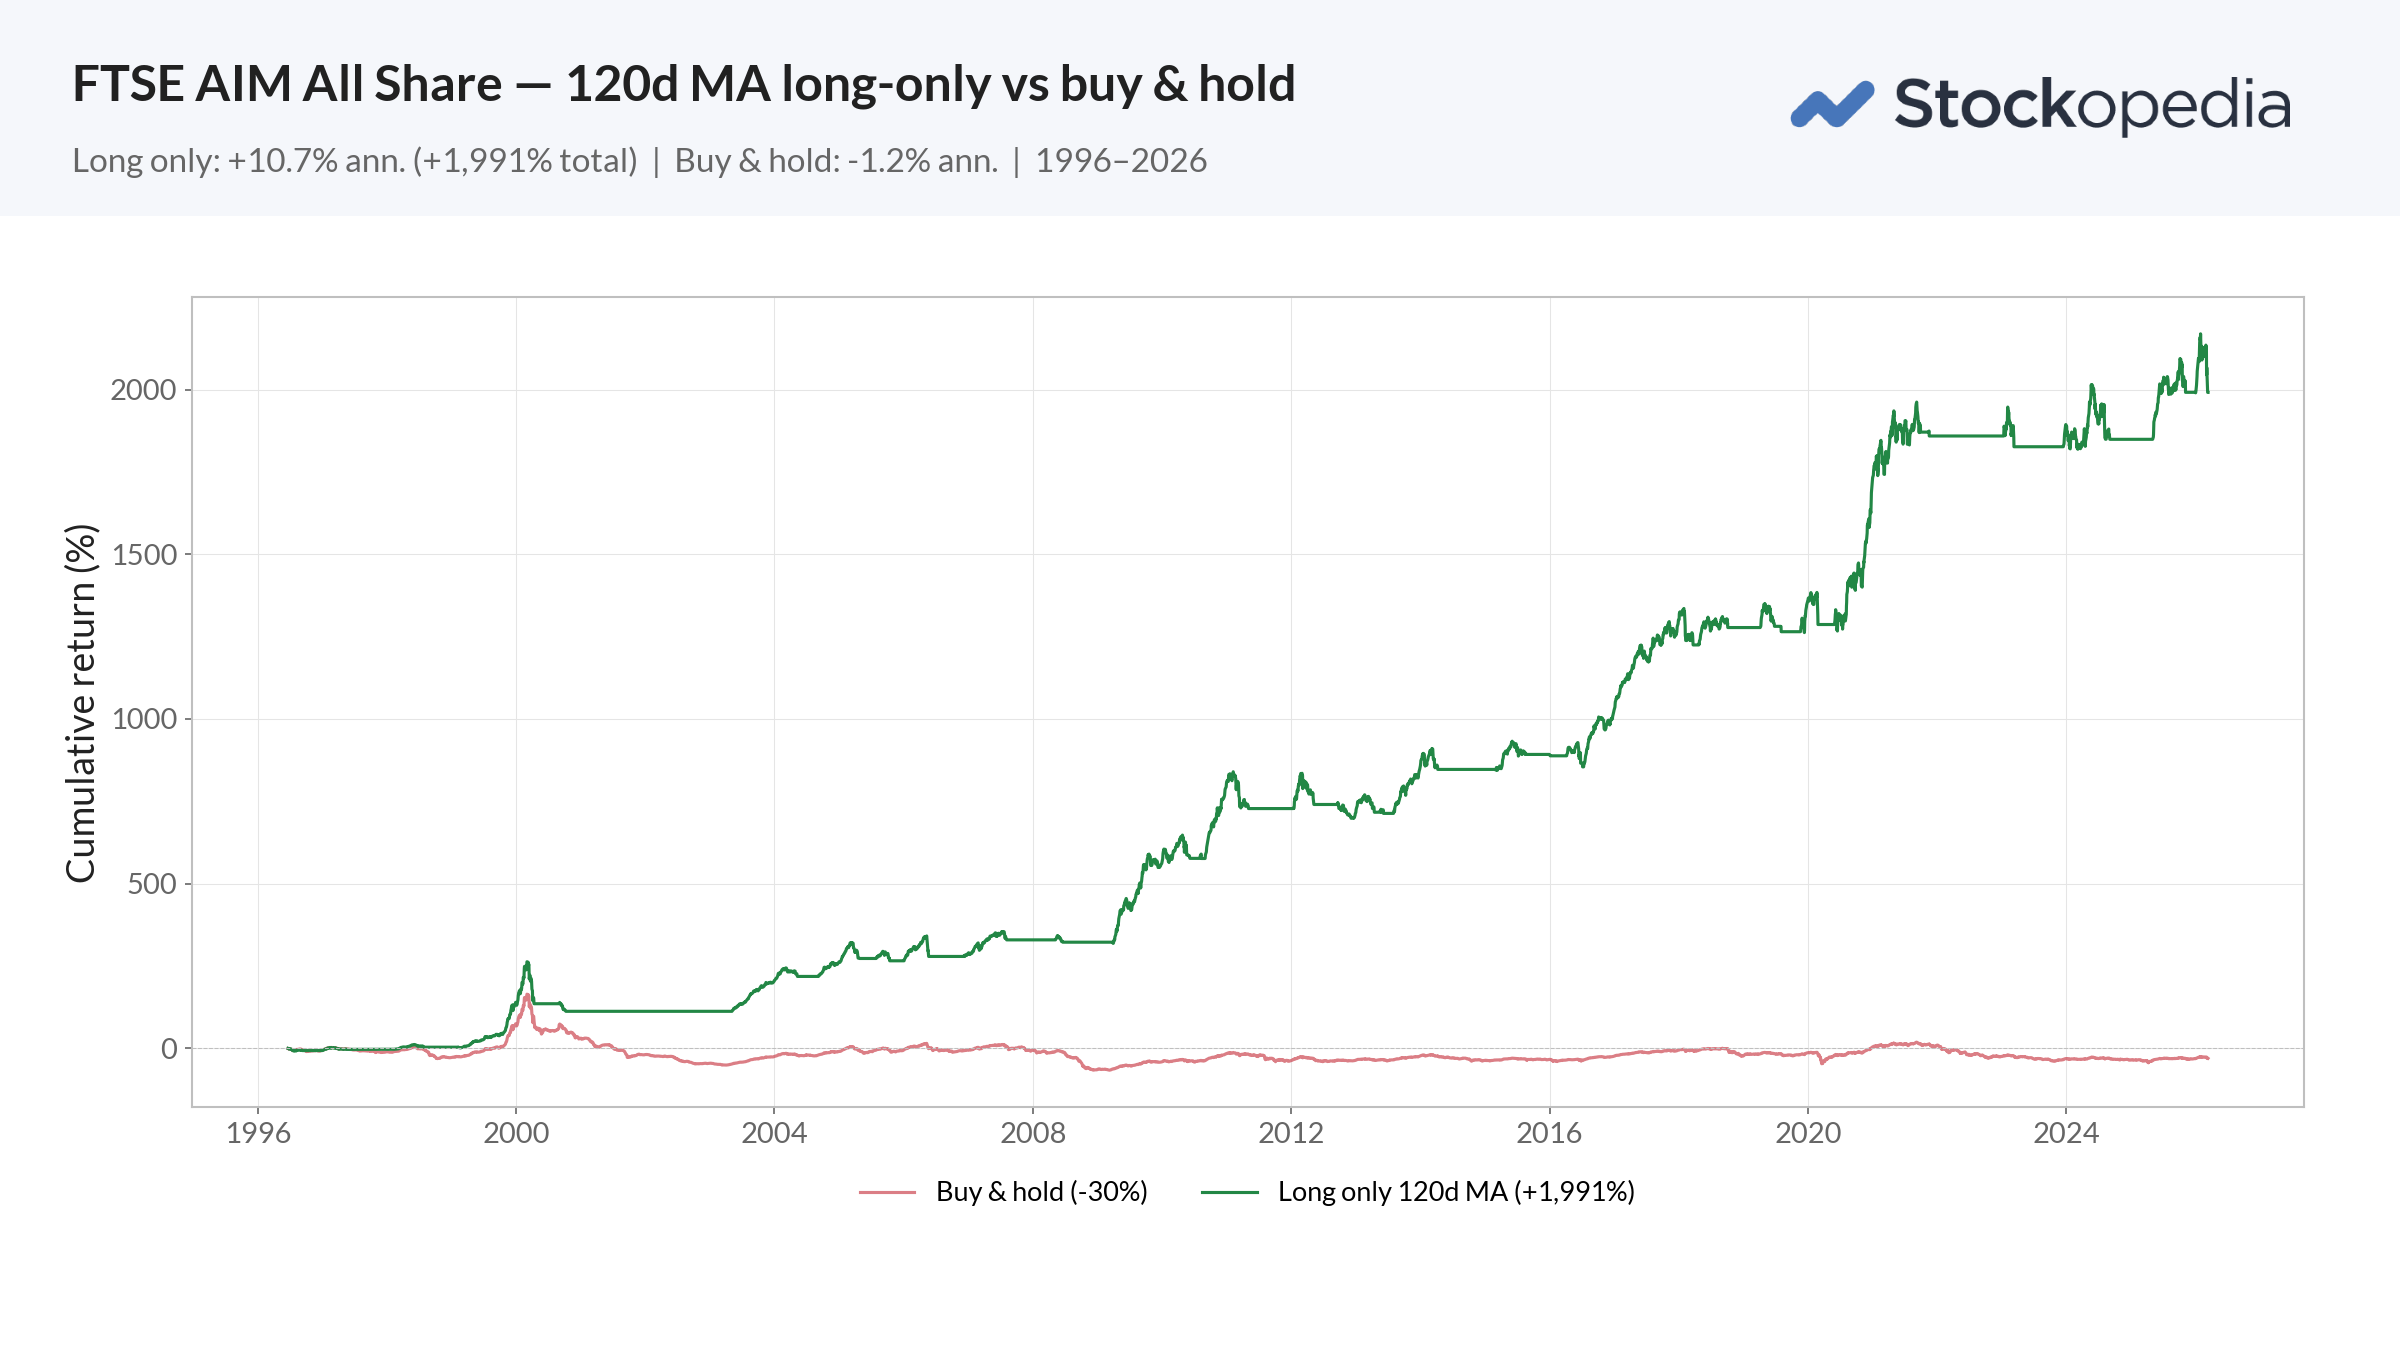
This simple rule could have helped any investor avoid the worst of every major AIM market crash - the dotcom bust, the financial crisis, the COVID crash. It doesn't flag at the top, and rarely perfectly, but it's usually early enough to avoid the worst of it.
Of course, a market-timing rule like this can be impractical. The results above assume zero transaction costs. Trading costs are real in AIM stocks. The mean, market-cap weighted bid-ask spread is about 2.2%. Even if you cut out microcaps, the spread costs are significant. With 58 round trips over 30 years, that friction really adds up and eats into returns considerably. The edge is real, but it's not as clean cut as the above numbers suggest.
But the short side is a stronger signal
For completeness, I also tested short-only variant of the 120-day strategy.
| Strategy | Annualised | Total Return |
|---|---|---|
| Long Only | +10.7% | +1,992% |
| Short Only | +12.1% | +2,880% |
| Long-Short | +24.1% | +62,235% |
| Buy & Hold | -1.2% | -30% |
The short-only strategy - shorting AIM when it's below the 120-day MA - actually outperforms the long side. Now, it’s not actually possible to short most AIM shares - it’s hard to borrow shares, and spread betters have pulled short side quotes for most small caps in recent years.
But, the fact that the signal works even more strongly on the short side tells you something about the signal quality. Weak AIM market regimes should be heeded.
What this means right now
The junior AIM Market is at the junkier, low-Quality Rank end of the London Stock Exchange spectrum. While the higher quality Main Market and its indices - like the FTSE All Share - have corrected, they are still in a longer-term uptrend. Good companies - profitable, cash-generative, competitively strong - tend to outperform even in down markets. If you own reasonably valued quality, don’t panic.
But these regime indicators are a prompt to prune riskier investments and even raise cash. If you’ve been invested in UK markets for the last two years, you’ll be sitting on some handsome gains. As Buffett put it: "It's only when the tide goes out that you discover who's been swimming naked." When AIM rolls over, it's the riskier, more speculative, highly indebted stocks that are punished hardest - the companies burning cash, carrying heavy balance sheets, or relying on sentiment to sustain their valuations. Companies find raising new money becomes very expensive in risk-off regimes.
So active investors should look at their holdings honestly. Trim speculative positions. Keep the quality. And when it comes to deploying new capital? It may be prudent to wait. Yes, there may be bargains in great businesses in a decline, but the market regime indicator will turn green and bullish again. It always does. It's so much easier to make money when animal spirits are working with you, rather than against you.
Disclaimer
This is not financial advice. Our content is intended to be used and must be used for information and education purposes only. Please read our disclaimer and terms and conditions to understand our obligations.
38 comments
A big thank you for making this post Ed. It prompted us to review our position and move to into cash. So many who make a living from working with the investment community fall short of reminding investors that cash is not a bad option at times of great uncertainty.
Excellent article. My interpretation is that AIM is an indicator of market sentiment. When more speculative low quality shares move out of favour AIM falls. Ed's article suggests that we are now rotating into a more 'risk off' environment.
I dont hold a lot of AIM shares, so the big question is what are the implications for the wider FTSE250?
It would be extremely useful to replicate table 1 and note the annualised return for the FTSE250 after AIM rises above or falls below the 120 moving average.
It would also be useful to see how the Stocko Quality and other ranks perform after those turning points.
Timing models don't really work that well on other UK indices... but I've run for the FTSE 250 and from a long-only perspective it pretty much matches the performance on the buy and hold side but doesn't improve it. What it does do is reduce the drawdowns, which certainly would help some people sleep at night, but I would think after costs it's going to impair returns.
Red - FTSE 250
Green - Long Only - above 120d MA
Orange - Short Only - below 120d MA
Blue - Long/Short
Thank you.
The signal works for AIM presumably because it has a lot of low profitability, high debt, operationally geared growth plays. Which swing in and out of fashion.
The signal does not work for the FTSE250 because it is more of a mixed bag.
My take on this is to focus more on solid quality companies until AIM recovers.
Good quality AIM outperforms the FTSE 250 significantly of course. I haven't found any difference between good quality AIM stocks and good quality small caps on the main market.
The FTSE 250 has struggled in recent years, after decades of great outperformance.
At the moment 12 of the 20 NAP 2026 holdings are AIM stock with several nudging into my standard stop loss zones. In previous years I've resisted intervening but as Keynes said: When the facts change, I change my mind.
I was in a very similar position. Most of my NAPS shares were AIM stocks. I closed both portfolios yesterday. The one from May last year was up 25% (down from 39% at its high point). I started a larger portfolio in December and this was up 5% (down from 10% at its high). In light of the current situation I was happy to take these gains.
Ed's research certainly focussed my mind but also I don't believe the Americans have control over the end of this war. Or really any coherent strategy. Economic mayhem will probably continue well after the bombing ends. If Iran has even the the minimal capacity needed to continue this disruption why would it stop?
So now I am just over 40% in cash. Prepared to miss any immediate recovery but still think there will be plenty of bargains when the time comes. I'm already making a list of potential companies I might want to consider.
NAPS has served me well so I have not ruled out starting a new portfolio at a later date.
My take away was it's the low quality stuff you want to trim. The 12 NAPs AIM shares have an average quality rank of 90. I'm also down a lot on these shares YTD but I'm inclined to sit on them (as per the original NAPS strategy) rather than realise my losses. These high quality AIM shares are likely companies that can weather the storm (and maybe even benefit from the demise of weaker competion) and should rebound the strongest when the end of the war is announced. Hopefully I'm not just blinding myself with loss aversion!
The question is whether this is the start of an extended bear market, or just a correction? The MA signal's usefulness depends on whether this geopolitical shock evolves into a sustained risk-off regime, or whether it resolves and animal spirits return. If it extends, the signal will prove its worth over the coming months as Ed predicts. If it reverses sharply, the MA signal will have been a false positive — it will give a re-entry signal in due course, and we will have missed some upside by sitting in cash.
This is really a bet on how long the Gulf conflict lasts; which nobody knows. So my view has been to move to circa 50% cash, so whatever happens I will be only 50% wrong. A false positive costs me some upside on half my portfolio. If this becomes an extended bear, it protects half my portfolio from maybe -20% annum loss while AIM remains below its moving average. Because losses compound the loss will become even greater over time.
Hi iwright7 my gut instinct is to agree with this. But the moving averages move in response to all types of upheaval, and yet the signal remains. Depending how the orange moron behaves in his amoral and consequence-free present we could easily be in for six months of slide....
Dave,
I am assuming that the Orange moron is the cause of what happens next - False signal or Bear market?
No doubt about it!!
I was reading that Larry Williams (famous trader/technician) had made an extreme bearish call, but also stated that the market will bottom in May. At which point he's anticipating a huge rally.
That's probably tea leaf reading. Nonetheless, many of the MA crossovers do whipsaw in the other direction. I will probably write a follow up on this in the coming week.
On the aim index surly it's obvious that the index is lower today as all the decent companies have moved to main market or have been taken over. More trash on aim now then respectful investable companies.great article about mas. No ipo market
Ed, interesting but do you get the same results when you perform similar tests on the FT100 and the FT250? Have you tested against different moving average days?
Has any reading tested this out on the FT100?
We decided to move into cash today and bank the gains we have made over the last year. As we are in our late 60’s we don’t want to risk the war in Iran affecting the remainder of our retirement years. We will review the situation when things have cooled down a little.
Buy gold, the banks are.
We have made a nice little profit on gold as a part of our portfolio, but things feel so uncertain at the moment that I sleep better at night knowing that the only thing to fear is inflation.
"The junior AIM Market is at the junkier, low-Quality Rank"
As they say in Glasgow, "You're nae wrang."
Looking at the stats page, the TTM shows PE of 14.8, EPS growth 4.35, div yield 3.33%.
The EPS growth hasn't been bad at all, and remember, that includes the garbage.
Checking the FT250, PE 13.35, EPS growth 5.54%, div yield 3.77%.
The corresponding figures for the FT100 are 13.8, 6.37, 3.64.
The FT100 has been running a bit hot of late, but now the valuations seem reasonable.
One little surprise is that the FT100 has been growing faster than the FT250, which is quite unusual. The mid-caps are offering a greater div yield than the large-caps, something that is also quite strange.
The dividend yield on the AIM is comparable with the mid and large caps. Something that doesn't seem to happen often either.
We live in strange times.
As they say in Glasgow, "You're nae wrang."
I say old chap, we’re not all Rob Roy McGregors don’t you know. (Hancock, the Blood Donor sketch, black and white)
In the old days in Kelvinside (posh area) sex were used to deliver coal.
Ed
What if you only held AIM stocks with say SR >80?
My thoughts are -- Thank you Ed! I've read enough over the last week by sensible people to have me in selling mode anyway, I've fought against Mr Market too often and lost so I'll raise some more cash and be very patient.
Such a good read. Thank you.
Excellent.! Many many thanks Ed.
I read at article which stated that the charts are suggesting the best time to buy back into the stock market is around the end May.
Does anybody know if there is any truth in this statement??
The best time time to buy back into the stock market is when uncertainty ends, whenever that may be
I prefer low prices when there is peak uncertainty
That is great provided we knew that was the lowest price and that it wasnt going to go much lower
The old adage is "Sell in May and go away, come back on St Leger's day"
That adage ties in with the idea of the best seasonal returns being at the end and start of the year - certainly Santas Rally, January Effect and other anomalies do back this up.
The adage is old, old. It refers to agricultural money flows. By May farmers had sold an all their old-crop grain, invested a lot in the new crop and with substantial harvesting costs ahead are running out of cash. They sold their gilts and stocks and shares and didn’t buy again till post harvest.
Long, long ago nations went to war in the spring and summer which was also a good reason to sell. Some things don’t change.
Thanks for this analysis it is certainly an interesting one. I have held several AIM shares and have come out mostly frustrated with volatility rather than positive on gains over time and I think your analysis clearly shows that trading is more important than holding in this space. Due to volatility I’m surprised some of the better companies like Jet2 (LON:JET2), Cohort (LON:CHRT) etc have stayed in this exchange.
Does this pattern apply to AIM stocks of all sizes - there quite a number of stocks over 500m and some that would not be out of place in the FT250
Or put the other way round, does this pattern apply to the FTSE250
I think an excellent heads up by Ed echoing previous posts I have made showing a gradual weakening of the highs and lows to favour the lows. I think its also worth pointing out looking at the chart after breaking the 50 MA you have a pattern of lower highs and lower lows, a signal of weakness. Also worth pointing out as aim stocks are smaller caps the spread will tend to be higher which means a larger rise needed to break even and make profits. In a good market AIM stocks can provide terrific positive returns, but in a weak market the falls are also potentially greater
I've just read an article in the Economist entitled 'Time to buy the most rubbish stocks you can find' based on research by Adam Parker of Trivariate Research. 'Mr Parker has analysed low-quality shares’ historical performance after oil spikes, which he defines as price rises of more than 35% within three months. He found that the trashiest stocks rose by 8% on average in the six months after the spike, compared with 4% for the highest-quality ones'
If you have full article access to the rubbish stocks article, I would be intereted to know how he defined "rubbish" and "quality" stocks?
Article short on detail - 'Though today investors differ on exactly which parameters determine a stock’s quality, most agree that they include profits which are high, stable and, preferably, growing. Low debt (relative to profits) also helps.'
I heard the podcast. One reason given was that high forecast growth goes with high quality and in uncertain times this future growth is less certain so the price suffers. Low quality (i.e. low growth) shares have prices more based on near-term earnings which are more certain.
Very good work on AIM stocks Ed no wonder over the past 50 years I have rarely made serious money in them!