The AIM Market is at its most oversold since the Global Financial Crisis - an opportunity for the brave

The FTSE AIM All Share has been suffering an extreme October sell off. It’s in an almost unbroken 25 month downtrend and appears to be entering a capitulation phase. Is now the time to buy AIM Shares?
It’s easier to make gains on shares when investing when the tide is rising, rather than falling, but if you can pick up shares at the point of maximum pessimism, gains can be dramatic, especially among small caps.
Let’s have a look at two approaches that can answer the question of when to get back in?
1. Trend following - wait for a confirmed change in trend
The first approach is to follow changes in trend using a simple moving-average crossover. The idea is to wait until the index moves above its medium-term moving average, and then buy. Similarly, you sell and move to cash when it moves below. The 120 or 200 day moving average (MA) have been fruitful for timing AIM for the last few decades, and I’ve written about this several times throughout the year (here and here).
As the index is still well below its 120-day MA, it’s waiting on a buy trigger. I have to admit that I watch this indicator like a hawk.

One portfolio I’m investing from scratch is using this trend-following approach to gradually deploy capital. The first trigger to invest was in January when the AIM index moved above its 120-day moving average. The plan was to invest a third of the capital on that trigger, then wait for confirmation of a continued uptrend. The six shares I bought in January have returned 25% on a price appreciation basis and yield 3.5%. Two of the six were AIM shares which have driven the lion’s share of the gains - Yu Group and Kitwave.
Maybe it was a lucky set, but the shares were selected due to their strong value and momentum characteristics at the time (the highest VM Rank shares across different sectors). The trend soon turned down again, so I’ve patiently waited on additional deployment since.
While the MA trend following approach is the safest approach, it does mean you enter the market slowly and can miss the initial gains from any lows.
2. Counter-trend punch - swing trading the lows
The second approach is to try to identify the swing lows and highs in the market, and trade counter to the trend. This is more of a “reversion to the mean” approach and has higher risk. Simple indicators can work quite well, but they can be more prone to failure than the longer term trend following signals.
One indicator I like to look at for AIM is the Monthly RSI (available in “Indicators” in our Chart Package). This is a standardised overbought/oversold indicator that scales between zero and 100. The general rule of thumb for the RSI is that it’s overbought when above 70 and oversold when below 30.
Currently, the FTSE AIM All Share’s Monthly RSI reading is 29. It has only been this low twice in the last twenty years. The first was between August 2008 and April 2009 during the global financial crisis (GFC). The second was in March 2020 during the pandemic crash.
You can see the RSI added at the bottom of the AIM index chart below.
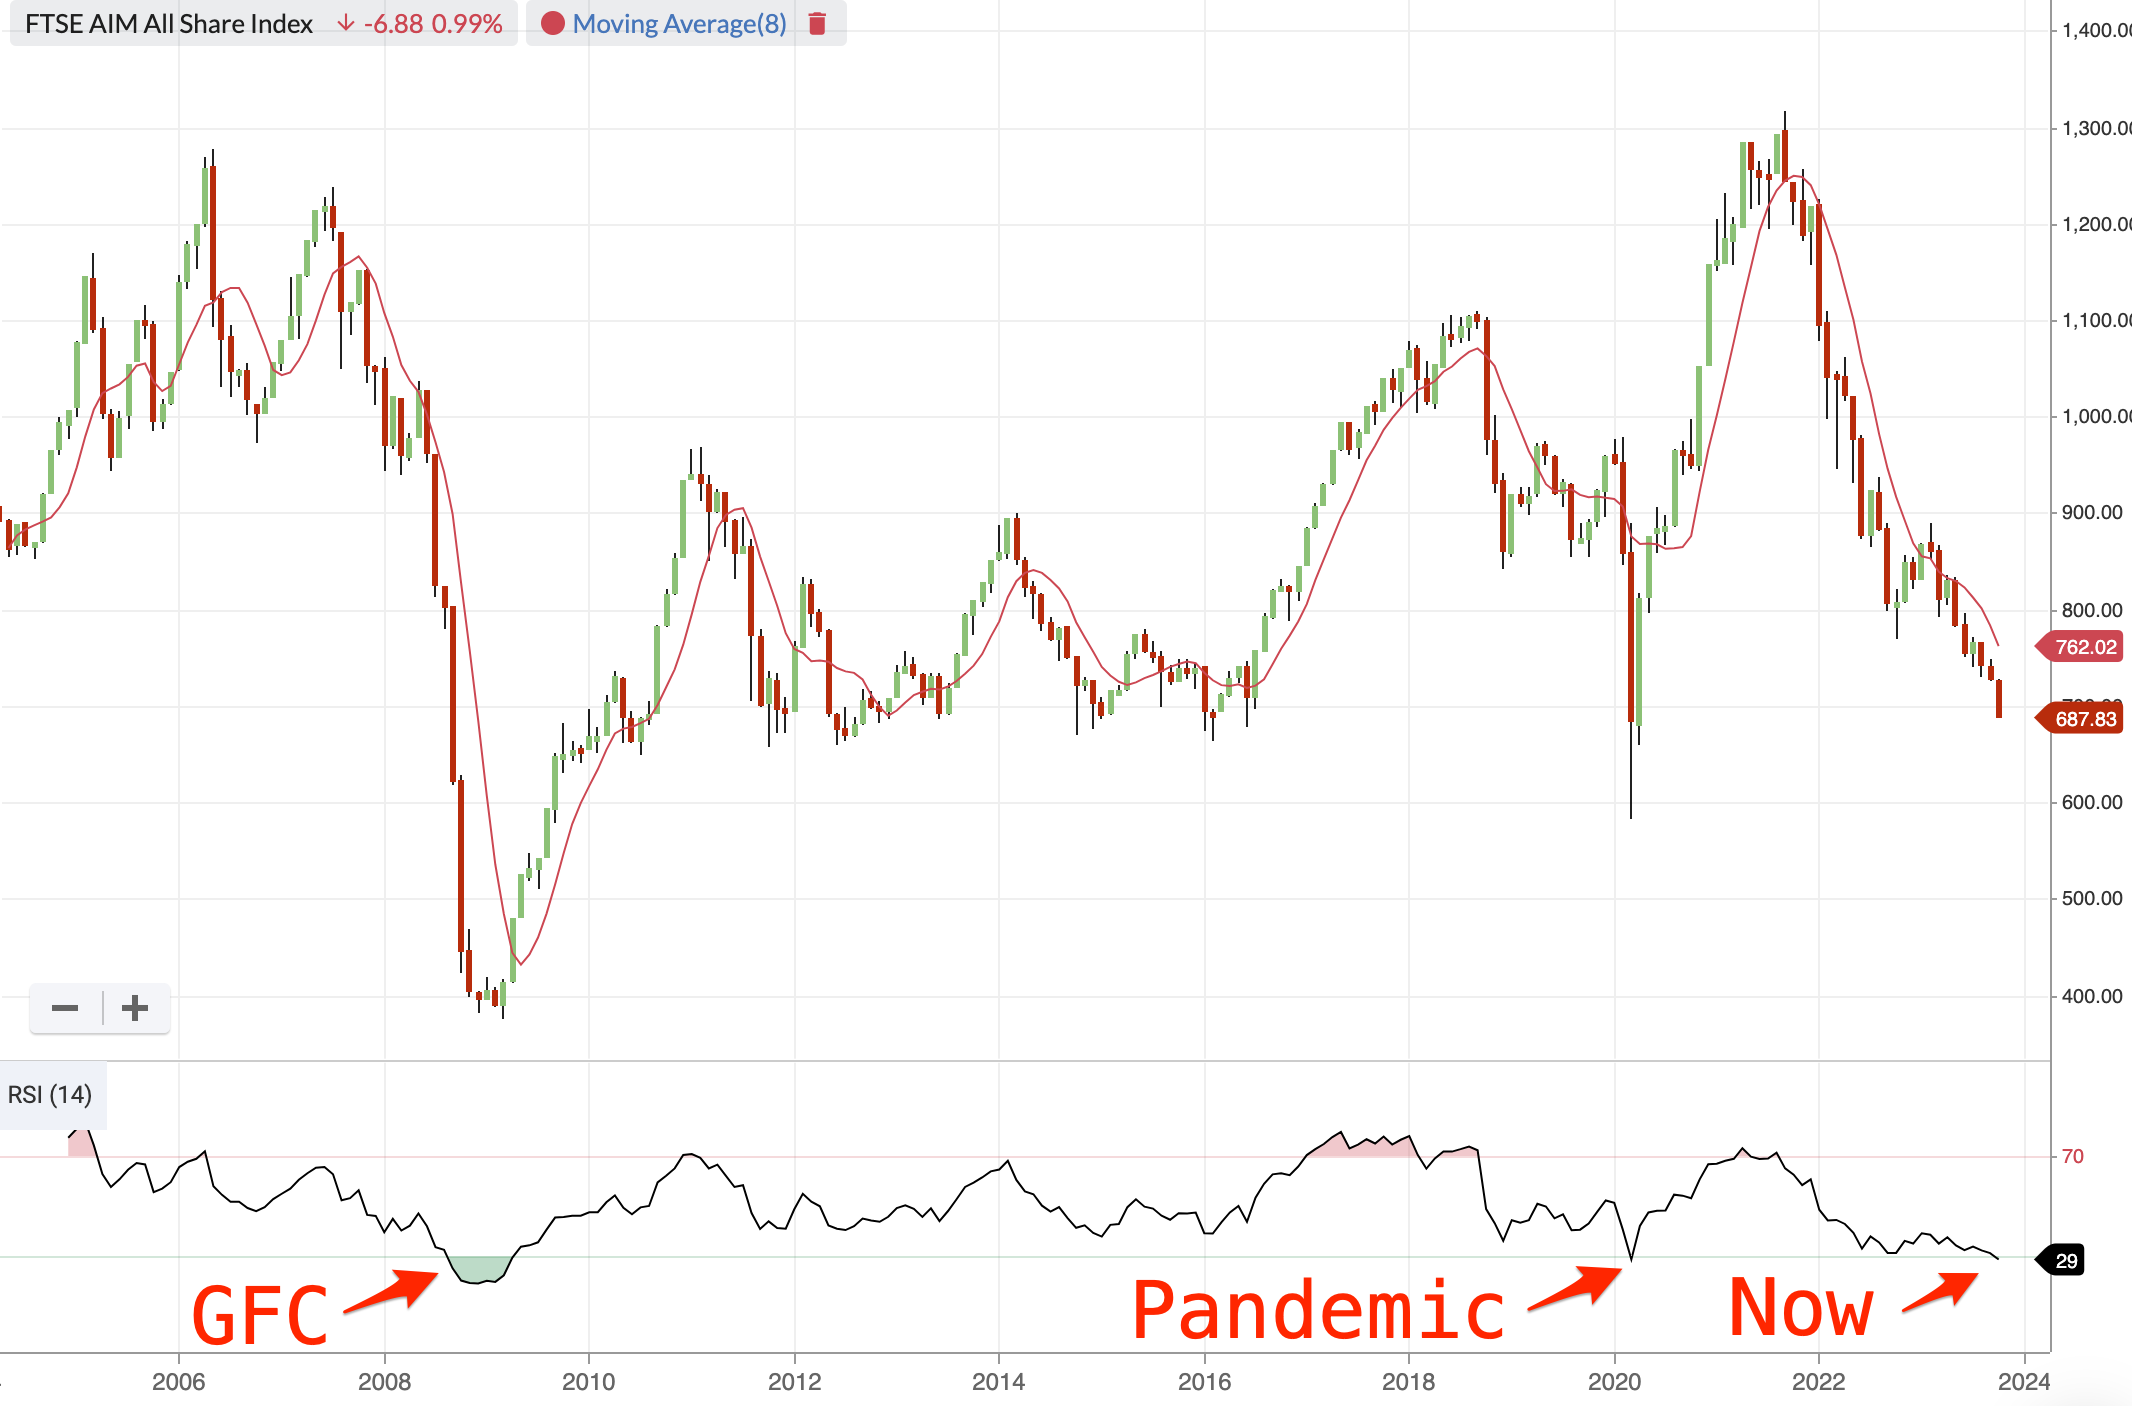
In both cases, at the other side of the recovery, strong gains were made. It is worth noting, though, that in the GFC, the index continued to plummet for some time after the initial RSI reading went sub 30. It did though trigger earlier in the decline when the speed of the sell-off was more extreme.
So should you buy now?
Well, what we do know is that the index is in an oversold condition. There are clearly funds dumping stock, and the selling wave is not yet through. There has to be a capitulation at some point. Lots of bad news, war in Israel, rates higher for longer, economic weakness, October panics, we all know the drill.
I would never time my entries on one indicator, and I’m not a tactical swing trader. Most swing traders would look for confirmation that the extreme is in, i.e. entering as soon as buying strength returns. When markets get this oversold, they often act like a rubber band and snap back. Quick gains can be made IF you get your timing right.
At some point, these indices will bottom. Let’s see if the RSI reading marks the spot. For my portfolio described, I’ll be waiting for a confirmation of a new uptrend, but brave investors may be willing to choose the counter-punch approach and seek oversold opportunities now.
If you are looking for small-cap opportunities, then the den for stock pickers is The Small Cap Value Report. Daily analysis is led by our prolific team of Paul, Graham and Roland with all of you in the community making it the best place for small caps on the web. Not sure what we’d do without you all.
Disclaimer
This is not financial advice. Our content is intended to be used and must be used for information and education purposes only. Please read our disclaimer and terms and conditions to understand our obligations.
27 comments
Just an update here. The AIM All Share's 687 (at the time of this article) proved not to be precisely the recent bottom, but the rapid bounce back from the lows shows the usefulness of counter-trend indicators in timing purchases.
Trend following signals, of course, always trigger "later". The 120d MA for the AIM All Share is at 737, just 20 points above the current 717 mark. The January breakout failed. It will be interesting to see if the recent momentum continues and if we get a clear breakout. It's certainly the best surge since last October - so fingers crossed.
AXX is also getting close to a level that provided support / resistance from ~Oct 2009 until ~July 2016, and then again during the COVID crash.
Until recently, I could click on the index on the home page and it would list all the stocks in it, then arrange by mcap, this feature seems to have disappeared now, unless I'm doing something different.
The Aim100 fall is even more surprising as some of the largest stocks, such as Burford Capital (LON:BUR) have done well this year, up about 37%, HUTCHMED (China) (LON:HCM) is also up.
Majority of my portfolio has always been in AIM stocks but earlier this year I had an electric light bulb moment and did a recce of FTSE. Best investment decision of the year especially with a couple of choice selections, namely BAE and RR. They have certainly set the cat amongst the pidgins and will be roosting there for a while.
It's an opportunity for the meek (and patient and analytical)
The brave are those who see the future in NVIDIA (NSQ:NVDA), Tesla (NSQ:TSLA), etc...
Nvidia still has a real advantage over competitors and therefore a bright future - the only question is whether that bright future is already priced in.
Tesla, though, is a company that had a bright future in the past; Musk foresaw the transition to all-electric cars before anybody else, and for a time, Tesla had that market to itself. Today every car company that wants to stay in the business of making cars has a range of all-electric models, and some of them are better value than Tesla. I don't think the stock market has woken up to that. I wouldn't short Tesla - but I'd consider buying put options on signs of a downtrend.
Looking at the big aim listed stocks i count 4 have or will be taken over so the index size will fall to make for this adjustment? Its not like a fst100 stock that will be replaced by something a bit smaller.
Hi Ed. A very interesting article. Thank you. I appreciate articles like this that expand my (sadly inadequate) understanding of the technical indicators of the markets and individual shares. One point you may be able to clarify. You talk of the monthly RSI figure, but I notice that the RSI under Indicators in the Chart section is for 14 days. Is this significant?
Interesting, but I'm afraid this perpetuates a fundamental misunderstanding about the nature of the AIM All Share Index (AXX) that I have seen promulgated a lot recently.
The AXX is not an index like the FTSE 100, FTSE 250, S&P 500, CAC, Nikkei etc: There are no trackers, no spread betters will let you take a position on it, you cannot buy it and you cannot sell it. It should never be used as a benchmark and discussions of buying and selling it are pretty moot.
There are a few ways of looking at why this is, but as a thought experiment imagine a parallel world where somebody tried to start an AIM All Share tracker of any kind.
The principal problem it would have is that all rational participants would take a look at its history, go short and stay short. The smart ones would back this up with a long portfolio of AIM companies which have actual businesses and prospects, but there has never been a time and likely never will be a time when it makes sense to buy the whole index. There are two ways the provider of the tracker could deal with this: either short the underlying shares, which is simply not possible in 90+% of cases, or let it trade at a starting and ongoing discount. You can't start let alone maintain any conventional fund at a discount, so you're talking about some kind of complex instrument like a synthetic ETF or OTC spread bet. There are some very weird and wonderful ETFs out there so I'd never discount this as impossible.
The next problem is the high running costs of such a tracker. If run on a fully replicating basis then the initial costs of starting the fund would be very large due to the spreads and the large number of shares. And if you wanted an open ended fund with a fixed discount (I'm not sure this would even be possible), then the fund flows would create significant extra expenses. Companies moving in and out of the index would be expensive too, though not on the same scale. More likely you would have some kind of hedge fund backed entirely synthetic instrument, which, given the volatility of AIM, would also entail very high costs with the added risk of it blowing up.
So what you'd end up with is something a synthetic instrument (ETF or OTC) with very high ongoing holding costs. Indeed it would have characteristics very much like a VIX ETF or spreadbet, with their option decay. In my view this is not a coincidence as this is exactly how the AIM All Share Index should be interpreted - not as a benchmark, an indication of long term performance or something to be invested in, but a measure of the health of the market where only short-term movements have any meaning.
So actually, for those than find the VIX a useful indicator, perhaps the delta between the AXX 120-day moving average and the nominal is not such a bad metric after all?
Interesting. Can you expand on the delta between AXX 120 day moving average and the nominal. I am curious.
How about the Aim 100 then, because overlaid there seems little difference, so I wonder if the main point of looking for an index reversal stands?
@LeoInvestorUK - you do make a great point - but just be to clear, I'm not suggesting buying the index - I know there are no index trackers for AIM. If it wasn't completely clear, my bad, but the article (and previous ones) are very much about timing individual stock purchases at the point when the index trend changes.
There are plenty of people out there wondering when to deploy new cash, and trend models do help to assess opportune times to invest or reinvest.
There's a useful study by Meb Faber called "A Quantitative Approach to Tactical Asset Allocation" about timing the S&P 500 - buying the S&P 500 when it's above its 10 month moving average, selling when below. NB the drawdown and volatility reduction below.
I like timing models - they can help manage equity exposure and risk. I'm sure many have noticed that staying long-only in difficult down-trending markets can be very painful!
Hi Ed. I share your interest in timing models, although personally I'm doubtful that many can successfully time the market and it can be a bit of a mugs game. I've found it easier to stay pretty fully invested most of the time and benefit from time in the market rather than trying to time the market in a big way. Indeed the Faber model after succeeding in the GFC probably went onto fail badly due to being whipsawed in the subsequent Central Bank induced bull market of everything as they manipulated interest rates down to and through the floor in some cases!
I came across research along the way (see links at the end if of interest) that suggested it could be improved on by ignoring sell signals from it IF the US was not either in or headed for a recession. This is because the worst draw downs tend to come with recessions etc. Strangely, given its reputation as a lagging indicator, US unemployment against its 12 month trend has apparently been a good guide to this with a few months to a years notice of impending recession. See link at the end for more detail on this. In addition the US yield curve has been inverted for about a year now, which also suggests a US recession could be due soon.
Thus when US unemployment is trending up above it 12 month average this is when one should pay attention to and follow any triggering of the Faber timing signal. This is the situation that has been triggered in the last two month in terms of the unemployment rate, but as of the end of September the S&P 500 TR index was still above its 10 month moving average (See graph) but if this should break in the near term and assuming unemployment is still trending above its average then this would trigger a long awaited sell signal ahead of the much forecast recession presumably arriving at some point next year.
I have been following similar indicators for the UK indices and as of the end of September FTSE was still just in a bullish trend above it average while the Mid 250 & Small Cap indices have slipped below their trend lines / turned bearish in the last two months. (see the 2nd graph with Mid 250 at top and FTSE at the bottom.) Given the developing situation in the US and competition from more realistic bond yields these days on the back of central banks raising rates and talking about higher for longer. It still seems like it might be too early to be calling a turn in the market. But hey what do I know as market timing is a mugs game!
Links to market timing research etc. Beware very detailed not for the faint hearted / time pressed.
https://www.philosophicalecono...
Unemployment as a recession indicator.
All the best
Jamie
Great article Ed, thanks. Certainly you can smell the fear on these pages. The mood is sombre and the doom lies heavy. Everyone is standing back watching the slow motion car crash, but that means there is a lot of cash to be mobilised. Buying now ought to look both smart and uncontentious in five years' time.
At some point they will bottom- they always do. But , based on forward earnings multiples , quality, liquidity and prospects , AIM will always underperform the US major indices (Dow, S&P and the Nasdaq).
Always is a strong word.
What is clear from the history is that AIM outperforms other indices in risk-on environments.
What timing models help us understand is when we are in those risk on environment.
Clear is a strong word as well.
AIM has outperformed these indices in risk on environments? for example the environment we are experiencing post Covid (inflation and the rise in bond yields).
I don’t think so.
Timing models on illiquid indices and stocks should not be taken seriously.
But , opportunities in selective stocks will always be out there and this is the reason I will always be a subscriber!
Thanks
"Risk-on investing happens during economic growth and is characterized by high-risk investments. Risk-off investing happens during economic decline and is characterized by low-risk investments."
This is a risk-off environment, and has been since end 2021/early 2022 imo.
Risk-on environments are those like the massive liquidity pump from the March 2020 pandemic low.
Hi Ed "March 202" low ? Please can you edit to say which year you meant?
That’s one explanation and I am sure there are many.
Mine is totally different and has to do only with investors mood or appetite.
Thanks
Thank you Edward.
Do you attach equal importance to volume - whether it be a single share or an index?
I'm reading Stan Weinstein's book: Secrets for Profiting in Bull & Bear Markets (1988) - on oldie but a goodie! Some subscribers might be interested.....
Stan's Don't Buy Commandments are:
Don't buy when the overal market trend is bearish.
Don't buy a stock in a negative group.
Don't buy a stock below its 30week MA
Don't buy a stock that has a declining 30wk MA
Don't buy a stock that has poor volume characteristics, even on 'breakout'.
Don't buy a stock with a poor RSI.
Don't buy a stock that has near overhead resistance.
Don't guess a bottom. Instead buy on a breakout above resistance with good volume and RSI.
I know these tenets are probably aimed more at (swing) traders but they seem like some sensible rules.
Cheers,
Matthew
Stan's is one of my favourite books on stocks ever. There's a few nice points from that book in this breakout momentum piece I wrote in the summer.
I do value volume signals on individual shares, but less so on indexes. That may be an oversight by me, but I find volume on indices quite noisy.
Don't buy a stock that has poor volume characteristics...........
This is the point. AIM shares are illiquid.
They are interesting because little researched but that means little turnover.
One large transaction produces an RSI that makes no sense, either extremely oversold or over 70 i.e. extremely overbought.
Swing traders in AIM stocks make money for the market makers, the spread is too wide for the trader.
Granted news items will make the price explode in both directions.
One needs to be on the right side.
The article reminded me of a statistic that Joel Greenblatt produced from tracking users of his 50 stocks on magicformulainvesting.com. Those who bought 50 did better than those who tried to select a smaller number. So buying the whole AIM index in its present state might produce profits. How? There is no etf because liquidity is so poor. There are UK small cap etfs, trusts and funds. Some of the managers interviewed by Tamzin Freeman convinced me to invest in their expertise but results have been poor.
Anyway AIM listing has more to do with reporting requirements than market cap (Correct me if necessary). Some constituents have volume and some main listed small caps have little. So the state of the index overlaps the small cap indices.
I am active but whenever it is considered money lost in the short term.................., unless the price jumps.
Please can someone either tell me directly, or tell me where I can find out, how to define "poor volume characteristics" ?
Volatility on low volumes.
Bid and ask difference greater than 2%. Most of the times it can be over 5%!
Closing prices that can be manipulated on a £5000 trade (even less!).
Ed ,Ive been watching this index closely - Is there a fund/ETF that gives you exposure (apart from a spread bet) cheers SL
I don't believe so. I was looking on IG for one this morning.
There are a few AIM VCTs out there (search on the site - Unicorn, Octopus and Amati), but they all seem to have underperformed the index.
Personally, I just stick to high QVM shares (increasingly VM in these markets). I'm not looking for AIM stocks uniquely, but happy to own them wherever they are qualifying for my buy rules.
I'm just using the AIM All Share as a timing indicator to try to assess when "animal spirits" return, but also for discipline on further capital deployment.
Cockney Rebel had mentioned how he's been moving up market to full list shares as the market has fallen. A time to go "down market" might be when the AIM trend changes. Though to be honest, I don't expect a rapid turnaround at the moment - though stranger things have happened.