Bowled over or getting the hump?

Last week, I wrote an article looking at some ways investors could take a more objective approach to assessing one of the more popular chart patterns: bowls. This was in response to a challenging article that Ed wrote, asking whether such patterns were actually more logical than the sceptics, such as myself, might believe. The reason is that they may represent different time periods of Momentum that academics agree impact stock prices. This generated some fascinating debate in the community, so I thought it would be a topic worth expanding on in a subsequent article. But first up, an apology.
Erratum
I appear to have made a mistake in one of the calculations in my original article. When calculating the possible returns to investors, if the share price follows a parabolic (bowl-shaped) path, I used trading days to calculate the CAGR. Since the graphs actually use all days, I understated the possible annualised returns. The actual figures (from 27th October close prices) would be more like this:
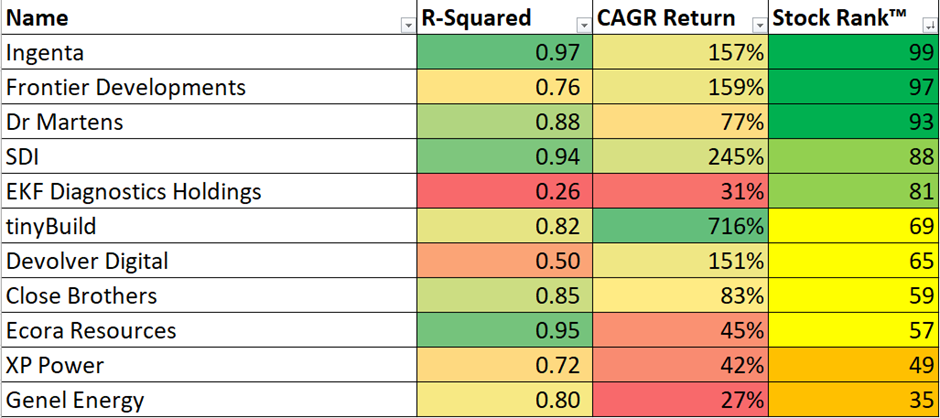
Of course, these are highly theoretical and depend on the share price following a specific recovery path. Although the difference between my original 134% calculation for SDI (LON:SDI) and the new 245% is unlikely to disappoint anyone who invests based on the chart shape, I apologise for getting this wrong in my first article.
Some more ideas
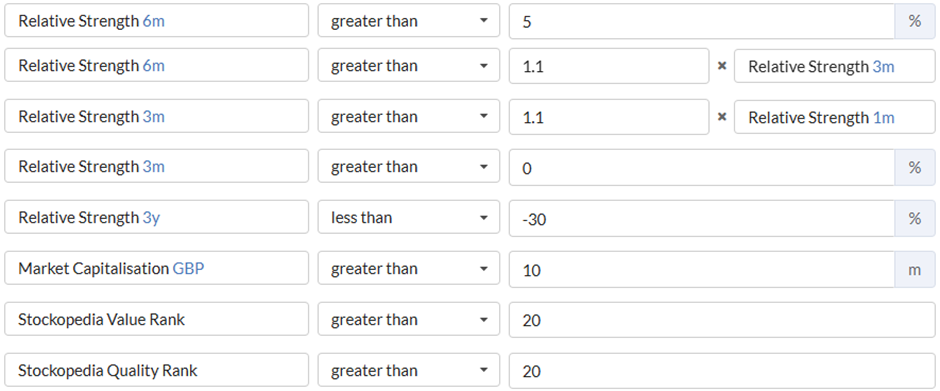
The mistake above made me think I could have been more relaxed about how far a stock had fallen in this screen. After all, a relatively rapid 50% recovery in a stock that has already shown signs of a turnaround will still give an incredible annualised return. Investors are often reminded of the maths of compound returns; that if a stock has fallen 30% it takes a 43% gain to get even. This is usually quoted as a warning for investors to minimise losses. However, this calculation works both ways, and I may be able to relax the 3-year relative strength criteria and still find good recovery stocks:

One enhancement that subscriber Jon F suggested was to ensure that the 3-month and 1-month relative strengths were positive, indicating that a recovery is underway. I think an argument can be made that adding 3-month positive relative strength makes sense. However, I would specifically avoid restricting the 1-month relative strength. The academic research on which Ed based his article shows that, over this period, mean reversal is more common. Very short-term weakness is actually a good sign for future recovery. Essentially, the short-term share price is likely to be noisy in even the smoothest of bowl-shaped recoveries, and we don’t want to be fooled by that noise.
Here is what a screen looks like on these adapted criteria:
And (at the start of this week) I got 23 results:
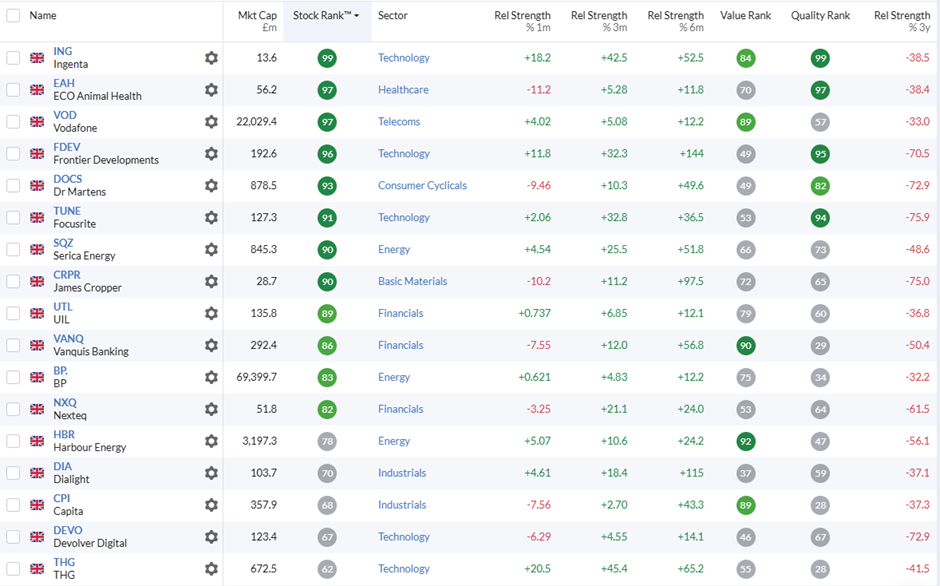
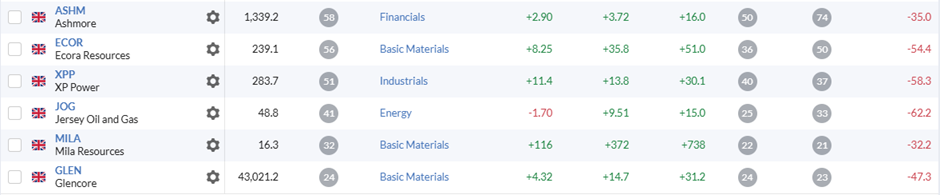
Some of these are on the original screen, but this generates 13 more ideas to explore further.
Calculating the R-squared
One subscriber, Paul Walton, suggested that it is possible to calculate the R-Squared directly in Google Sheets. This prompted me to create a spreadsheet that does this. Subscribers can create their own copy of my version and play around if they like. While this initially saves some time, it is not a panacea. Investors will still need to look up the date they want to start the curve fitting from. Also, the Google Sheets tools for extending the range are not as good as Excel. At the end of the day, investors can choose which tools work best for them.
Before calculating any R-Squared values for the new list, I need to check for dilution. Several of these companies have had significant dilution, hence the upside isn’t large enough to consider. (I am using the chart pattern as a signal of where a recovery stock may get to in terms of market cap when fully recovered, and where we may be in that recovery. I don't consider a specific price on a chart some magic number in itself.) I exclude Serica Energy (LON:SQZ), UIL (LON:UTL), Dialight (LON:DIA), and Mila Resources (LON:MILA) on this basis. Also, for some reason, Vodafone (LON:VOD) looks better on this screen than it does in the chart. I am going to exclude that too. Here are the R-squareds for the rest:
| Name | R-Squared |
|---|---|
ECO Animal Health (LON:EAH) |
0.89 |
Focusrite (LON:TUNE) |
0.91 |
Vanquis Banking (LON:VANQ) |
0.9 |
BP (LON:BP.) |
0.6 |
Capita (LON:CPI) |
0.72 |
THG (LON:THG) |
0.84 |
Ashmore (LON:ASHM) |
0.66 |
Jersey Oil and Gas (LON:JOG) |
0.7 |
Focusrite (LON:TUNE) comes out as the highest R-Squared. However, we have the same issue here as we did with RWS and others last week: it is not clear whether the downtrend part of the bowl has finished. The recent strength at Focusrite (LON:TUNE) looks a lot like noise on the 3-year chart:
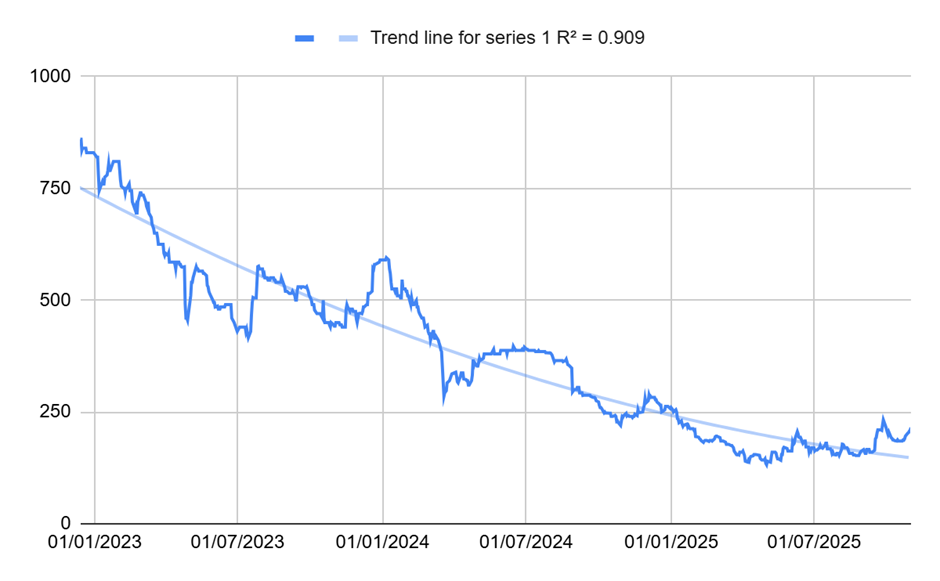
BP (LON:BP.) and Ashmore (LON:ASHM) have the same problem, even though their R-squared values are reasonable.
An updated list
Adding in the new recovering bowl candidates and updating for any price changes in the original list, I now get the following for the key metrics:
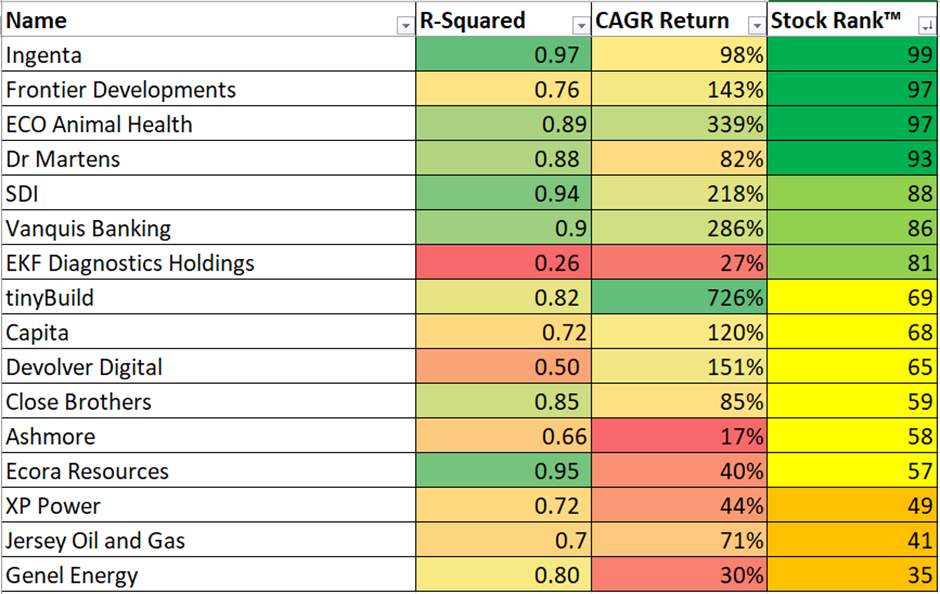
What is interesting is that a couple of stocks, such as ECO Animal Health (LON:EAH) and Vanquis Banking (LON:VANQ), don’t have huge upside, but if the bowl shape completes, the annualised returns are quite impressive. The reason is that the recovery would be quite rapid compared to some of the other stocks:
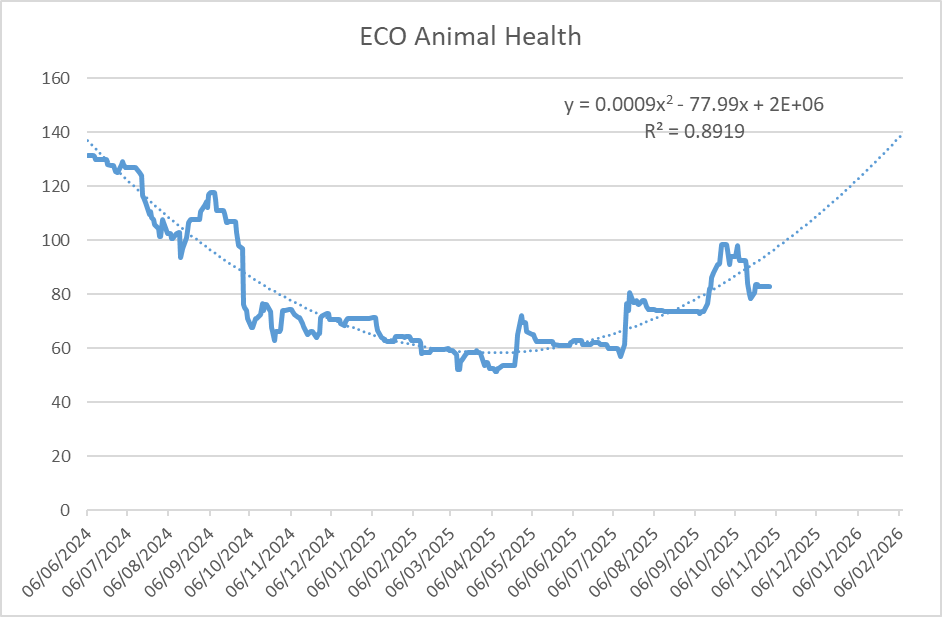
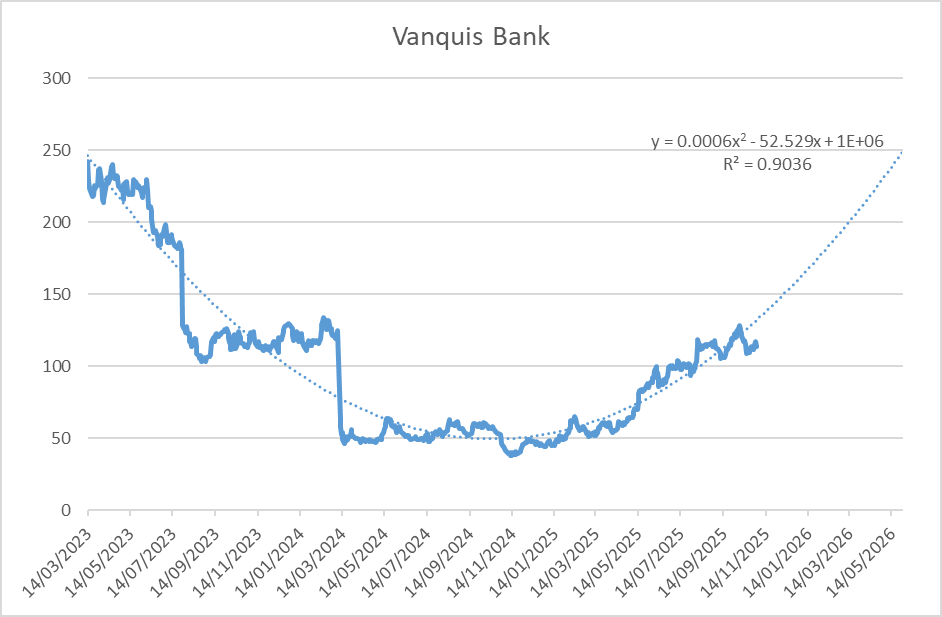
Investors who see predictive power in the bowl shape may want to add these to their lists to consider together with the original three from my last article: Dr Martens (LON:DOCS) Ingenta (LON:ING) SDI (LON:SDI). All of these also have high StockRanks, which helps make the case that these may be good investments for more than one reason.
Getting the Hump
There is another side to investing based on Momentum: getting out of a stock when the Momentum turns. One problem investors face is that by the time the Stockopedia Momentum Rank has fallen significantly, the share price may be well into the downslope. This is because a lot of the academic research (on which the Stockopedia Ranks is based on) uses 1-year price changes, and a lot can happen in a year! This has led some of us at Stockopedia to suggest that the rate of change of Momentum Rank may be as important as the absolute value (for example, here). However, the evidence is far from clear-cut. I wonder if the opposite of The Bowl, The Hump, may give investors an early warning sign to get out before losses increase further.
When I screened for bowls, I looked for stocks that had performed badly over the last few years but had started to recover, showing accelerating relative strength. Here, I am looking for the opposite: stocks that have done very well over the last three years but may now be subject to mean reversion in corporate performance. I want this mean reversion to be reflected in a share price that is accelerating downwards:
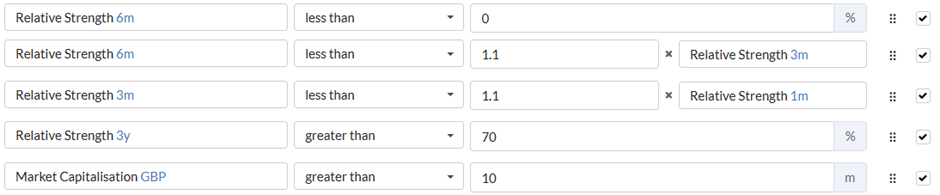
For Bowls, I added some basic quality and Value checks, but I turned them off here. Stockopedia subscribers are unlikely to be invested in Sucker Stocks, but if they are, this may act as a double warning to get out.

The screen currently generates 15 results:
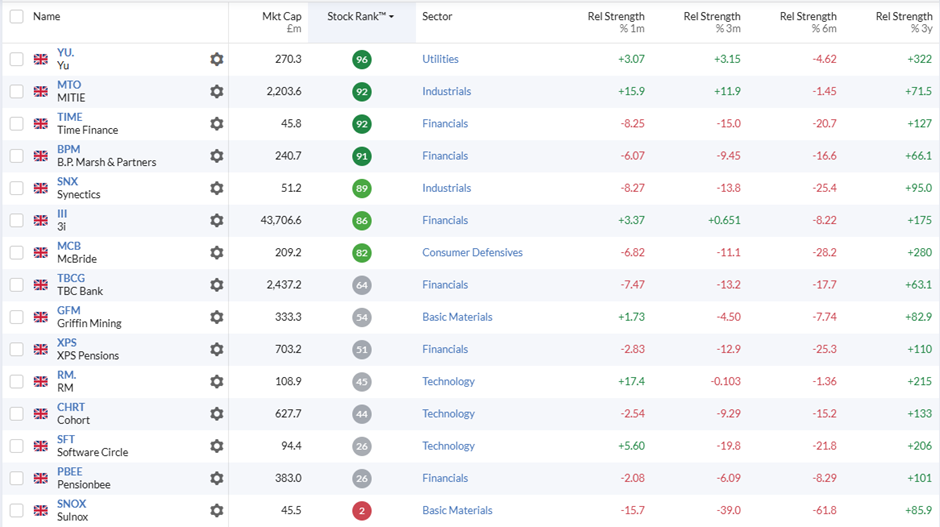
The interesting thing is that some of these are high StockRank investor favourites, which are showing signs of being on the downside of the Momentum “Hump” with some reasonable R-Squared values:
Yu (LON:YU.)
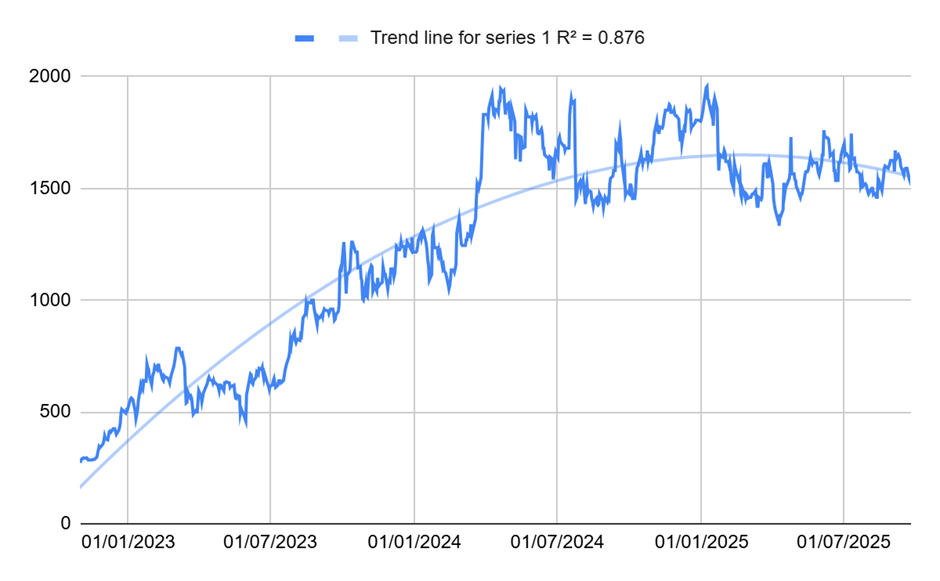
Time Finance (LON:TIME)
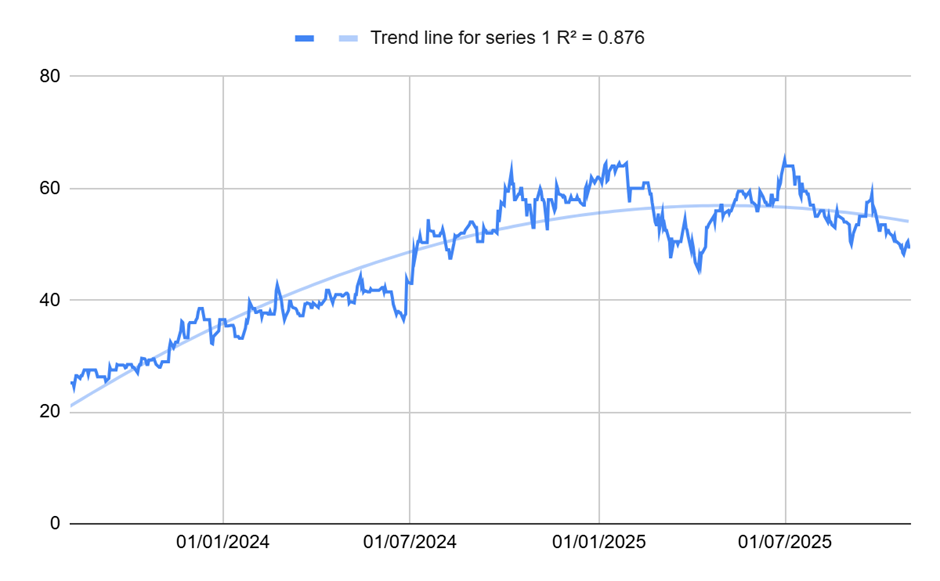
Synectics (LON:SNX)
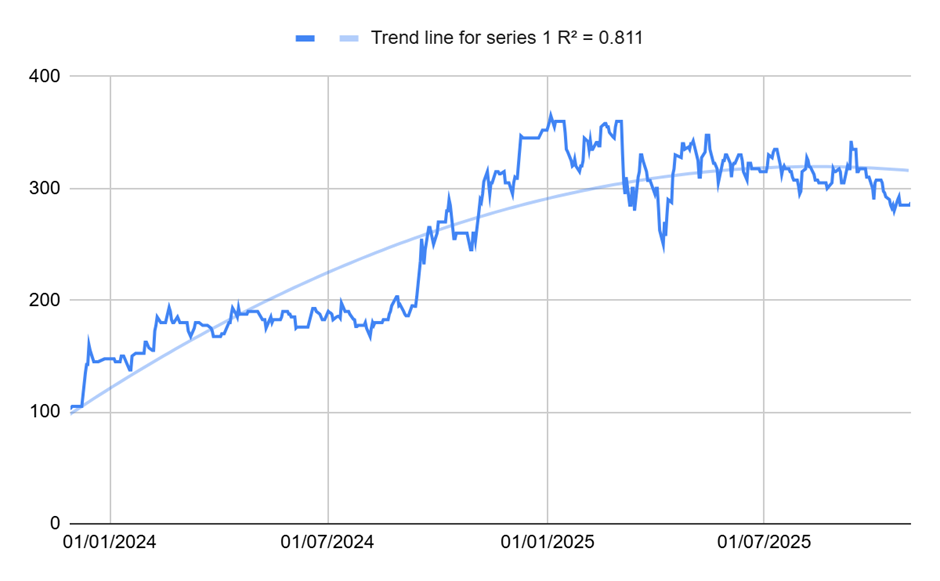
McBride (LON:MCB)
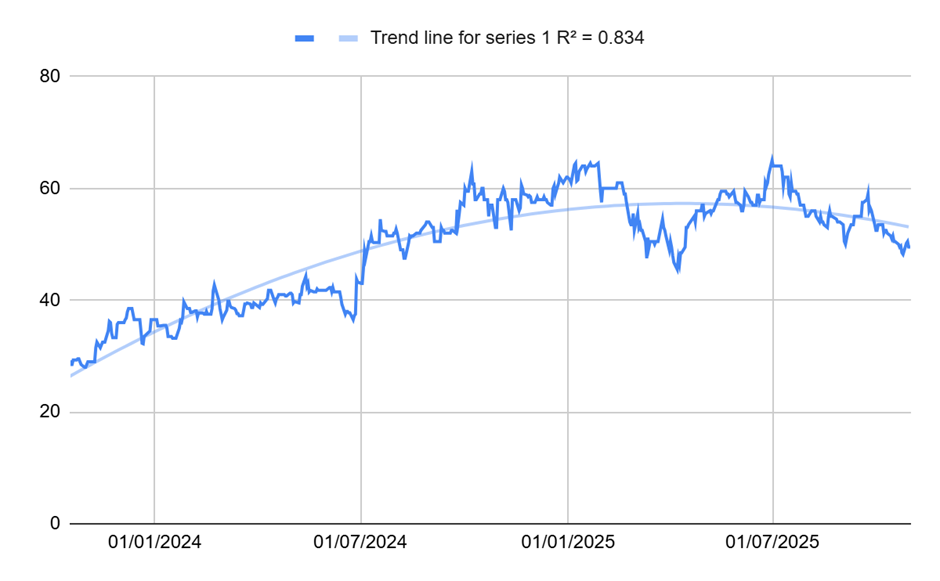
Plus, highly-rated Pensionbee (LON:PBEE) looks like an avoid on this chart pattern:
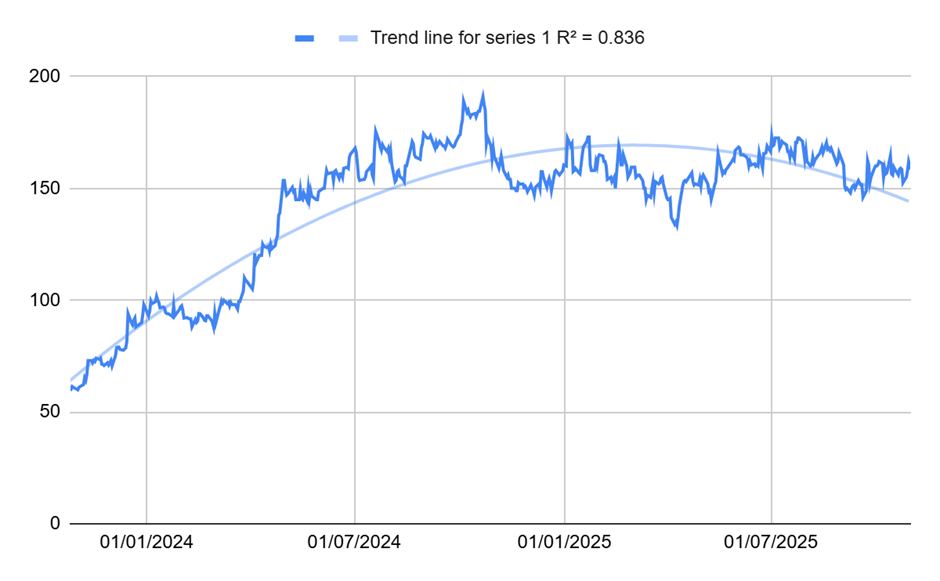
Again, I’m not sure if I’d make an investment decision based on these chart patterns alone. However, for investors who are fans of bowl-shaped recovery stocks, there is no denying that these humps make it look like a good time to take profits on these winners that are now showing signs of downward Momentum.
[Disclosure: Mark owns shares in Ingenta (LON:ING)]
Disclaimer
This is not financial advice. Our content is intended to be used and must be used for information and education purposes only. Please read our disclaimer and terms and conditions to understand our obligations.

8 comments
A number of UK and US stocks have nice bowls, thx to Mark for the idea and Stocko for the ability to show charts on one screen, although I think bowls show better over 5 years rather than 3 or 6
Thanks Mark for sharing the spreadsheet. I have updated Focusrite (LON:TUNE) chart in the link below to start from August 2021 and it still shows R-Squared value of 0.95. If the share price follows the chart, it can be expected to be in the region of £4 in a year's time. Here is me hoping being an existing shareholder with a biased view: https://docs.google.com/spread...
If you use Tradingview for charting, you can add a polynomial indicator (Polynomial Regression Extrapolation) to get the 'Bowl' or 'Hump' and extrapolate into the future e.g. Ingenta (LON:ING) . Change the parameters to those on the screenshot. Looks pretty good imo especially being able to see when a strong run is rolling over
Another excellent article Mark,
Thanks for expanding on my idea for ensuring positive momentum was continuing. I hadn't considered mean reversion (or refreshed myself with the contents of Ed's original article, so some background re-reading required there!).
Anyway, a point well made, regarding the 1 month relative strength, though in my version of the screen, it more than doubles the list of potential candidates when I remove the rule.
Thanks again, Jon
I would be careful about taking too much notice of the 1-month short-term reversal effect, which was first documented in the seminal Momentum paper by Jegadeesh in 1990.
Recent evidence indicates that this effect has faded significantly over the decades, due to factors like increased market efficiency, arbitrage, and changes in trading dynamics. A 2023 paper by David Blitz, analysed this decline, concluding that classic short-term reversal has, "steadily weakened over time, to the point of now having vanished entirely in most regions" by the 2020s.
Interesting. Thanks Ian. Especially as I’ve been critical of the Stockopedia Momentum Rank in the past for excluding this part of the Momentum effect. Perhaps it was just ahead of its time!
Although I’d argue that unless the 1-month mean reversion effect has reversed and now exhibits positive autocorrelation then it makes sense to exclude the requirement for it to be positive from this screen as all of these candidates will likely have noisy very short term returns which is more likely to unnecessarily exclude some good ideas rather than give better ones.
Interesting articles Mark and thought provoking.
Here are my initial (loose sketch) thoughts about how I could integrate this into my approach.
1) Use the r squared approach in relation to loss of momentum in my trending stocks. As the hump flattens into consolidation I'm already keeping a closer eye on the candidate, ready for exit. But the hump shape and the r squared might have some degree of prediction about when the hump might occur. Any positive difference from the prediction would increase confidence in holding.
2) I'm wondering if bowl candidates could be identified (through screening) then combining that with my method of using Ichimoku to follow the uptrend of the bowl completion. Again use of r squared as a measure of bowl adherence could be a useful addition for exit criteria.
Thanks for the articles.
Fascinating thoughts. Stocko personnel are always pushing the envelope and challenging the consensus.