Can investors ride the Contrarian momentum wave to beat the market?

In Martin Scorsese's 2014 film, The Wolf of Wall Street, Jordan Belfort (Leonardo DiCaprio) is taught an important secret of Wall Street elite: the aim of the game is to “move the money from your client's pocket into your pocket.”
Although based on true events, the film is, of course, fictional but it captures the core challenge that investors struggle against. Brokers do not always have our best interests at heart.
They are often hired by big corporations who want to raise money on the stock market. Towards this end, brokers produce research notes which encourage investment in client corporations. This research is often positive, but biassed and not objective. It’s rare for brokers to recommend selling a stock. Investors will often find themselves asking, ‘When do I sell?’

So what’s an investor to do?
Investors may choose to sell a stock when it becomes fully valued. But what does that mean in practice? Valuation is not a precise science. It is often subjective. There is not always a clear price which indicates a selling point. ‘Should I sell at £1.50, or wait for £1.55?’— these are questions that often trouble investors and burn up precious mental energy, especially when managing a diversified portfolio.
At some point we have to draw an arbitrary line in the sand, if anything to save ourselves from becoming like Buridan's Ass…
For readers who may not be familiar with the parable, the paradox of Buridan's Ass is as follows…
A thirsty donkey stands halfway between two buckets, each containing the exact same amount of water. As the donkey contemplates which one to choose, its indecision puts it at risk of dying from thirst. It would be better off making a simple, arbitrary choice. This parable is relevant for stock market investors: while we deliberate on whether to sell, we risk the share price moving against us. We also risk missing out on better opportunities.

How can we prevent ourselves from becoming the stock market equivalent of Buridan's donkey?
My colleague, Mark Simpson, offers a rules-based remedy with clear guidance on when to get out of a position. We have tested the performance of his framework by constructing model portfolios using a set of clear-cut rules and shown that the strategy can materially outperform the market.

Between 2013 and 2024 the average performance of a portfolio constructed using these rules was 102%, compared to a 32% rise from the FTSE 100 in the same time frame.
How to ride the Contrarian momentum wave…
Mark suggested that we should become StockRank Surfers. Readers will likely prefer being likened to surfers rather than donkeys—after all, who doesn’t want to conquer the waves of the market? A typical StockRank surf will looks like this:
Paddle: At this stage, an investor is analysing a high quality company that may be undervalued. It is likely to show up as a high QV stock – a Contrarian stock – but momentum will be low as the investor is pushing against the current.
Turn: Once the surfer has paddled past the crashing waves, they can position themselves to catch the rising wave. At this stage, the investee company will have a high ValueRank and momentum will be low, although beginning to pick up.
Ride: Since value and momentum often move in opposite directions, the ValueRank will decline as price momentum begins to accelerate. At the same time, the stock will trend higher as momentum takes over. Surfers can stand up and enjoy the ride.
Dismount: The surfer is now tempted to ride the wave for as long as they can. However, the wave will eventually close out, crashing down in one last unpredictable surge. If the surfer remains on the wave at that moment, they will wipe out. Instead, if the surfer can jump off before that moment, before they hit the white water.
The strategy can be summarised, as follows:
Start riding the wave when momentum is low and value is high.
Hold the stock as the price gains momentum. We are effectively riding the momentum wave of Contrarian stocks.
Eventually dismount as momentum slows down.
… towards a systemic surfing strategy
By introducing a series of quantitative rules, we can turn Mark’s approach into a systemic strategy…
Bull signals
Momentum Rank <= 25, AND
ValueRank >= 75, AND
QualityRank >= 60
Admittedly, some of the cut-offs might seem arbitrary. For example, readers may wonder why I chose to focus only on stocks with a MomentumRank of 25 or lower. Other investors might prefer targeting stocks in the bottom decile, with ranks below 10.
My choice was somewhat arbitrary—you have to set a threshold somewhere—but I also wanted the portfolio to be diversified. If the rules are too restrictive, the number of qualifying shares is too small. When I applied cut-offs of 25 and 75, the portfolio typically included over 100 stocks.
Bear signals
MomentumRank drops by 33 or more points within a single month; OR
MomentumRank falls for three consecutive months.
Again, these rules might seem arbitrary, but by establishing clear guidelines, we can at least take action and avoid getting stuck in endless deliberation…

Q&A: Portfolio construction
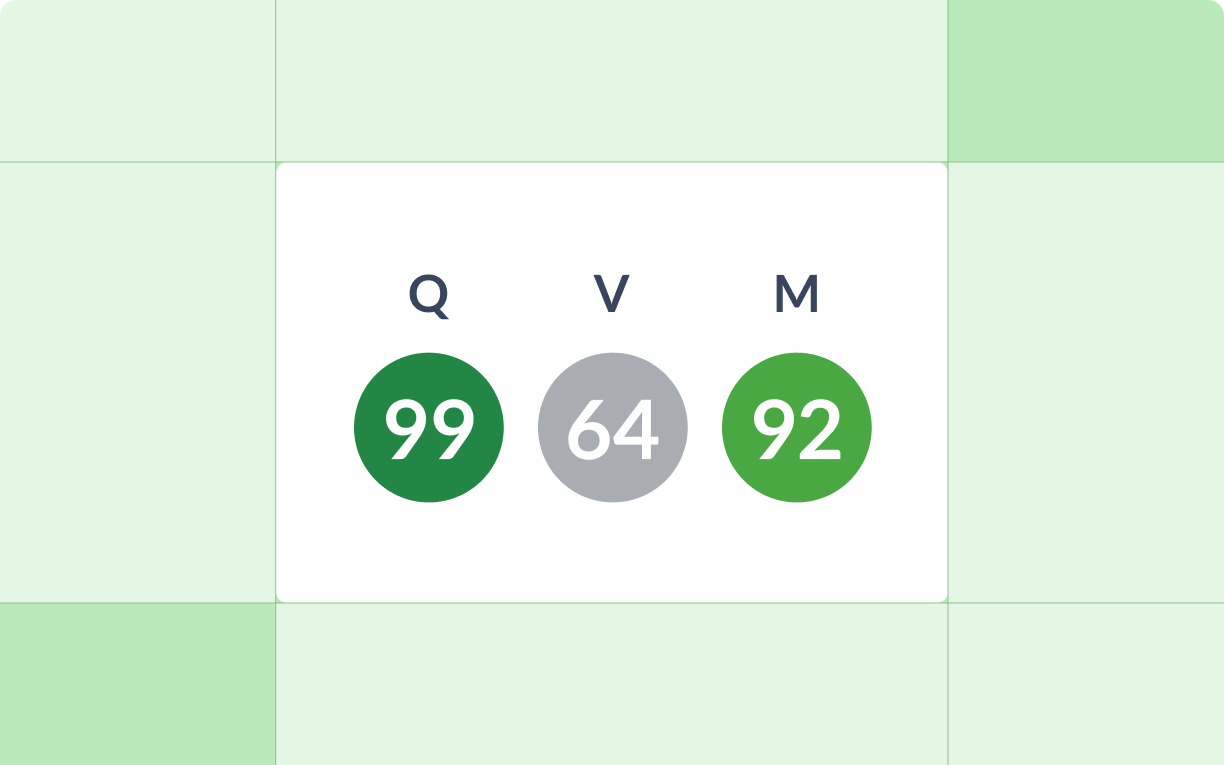
How did you identify investment candidates? A stock became a ‘holding candidate’ if it had the bull signal described earlier. A stock retained ‘candidate’ status until it had either of the two bear signals defined above. Let’s use LON:AAL as an example. In December 2015, the company had high quality (65), high value (94) and low momentum (21). This was the bull signal. The stock retained ‘candidate’ status until early 2017, when the MomentumRank dropped for three consecutive months.

What happened on rebalance day? On the rebalance day, we filtered the UK market for stocks that met the ‘candidate’ criteria. All stocks with ‘candidate’ status were added to the portfolio on an equal-weighted basis. We dropped stocks that had lost their ‘candidate’ status since the prior rebalance day. The backtest simulation tracked the same portfolio of stocks from one rebalance to the next, without changes in between.
How often did you rebalance? The portfolio was rebalanced every two years, with the backtest simulation starting in spring 2013, then rebalancing in 2015, 2017, and so on.
How did you decide the rebalancing period? We rebalanced biennially because the strategy follows a 'Contrarian' approach, targeting companies with high value and quality characteristics. This approach typically involves longer holding periods—at least one year (see below)—to allow the investment thesis to play out.
What about rebalancing more frequently? The backtest simulation suggests that investors would have gained very little by rebalancing their portfolio more frequently. Indeed, rebalancing quarterly only outperformed a biennial rebalance by 5%. Given this small difference in returns, why would investors want to incur the extra transaction costs that come with more frequent rebalancing?

Example holdings
The tracked portfolio usually contained more than 100 stocks. Let's take a closer look at one or two of those holdings.
Evoke
The table shows why Evoke (LON:EVOK) (formerly 888 Holdings) qualified for the surfer strategy.
In early 2020, value was high and momentum was low.
Momentum eventually started to slow one year later.
Momentum dropped to 94 in January 2021.
Momentum dropped further to 90 in February 2021.
The rank dropped even further, to 87 in March 2021.
As such, the MomentumRank fell for three consecutive months.

We would have bought in January 2020 (at around 135p) and sold in early 2021 (above 300p). Notice that we would sell as momentum starts to tail off…

Anglo American
Anglo American (LON:AAL) qualified for the Surfer Strategy between December 2015 and January 2017. During that period, the stock went from £3 to comfortably above £10. We would have sold in February 2017, while momentum was still high (above 90) but falling nevertheless – from 99.9 (December 2016) to 99.6 (January 2017) to 96.5 (February 2017).
It is worth noting that between January and July 2017, Anglo American dropped from around £13 to £9. By ruthlessly following a rules-based approach, investors would have gotten out before the momentum crash. Such is the advantage of arbitrary rules. They remove the need for excessive deliberation and save us from unnecessary frustration.

Rules over narrative
There is another advantage of following a simple rules-based approach. We have a system that can be scaled across multiple stocks and across multiple industries. Evoke is a betting company that owns brands like William Hill. Anglo American is a mining company. To implement the Surfer Strategy, we don't need to be experts on licensing in the betting industry. We do not need to fully understand the nuances of copper supply and demand. Sure, that context helps, but we can gather key insights from just a few metrics, like the ValueRank and the MomentumRank.
Readers who are interested in the Surfer approach will likely be wondering about the next steps. The first step is to identify investment opportunities using a rules-based system. This is where a screener tool can be beneficial. The following criteria can be applied to focus on stocks that exhibit the characteristics of a Surfer Stock.

Disclaimer
This is not financial advice. Our content is intended to be used and must be used for information and education purposes only. Please read our disclaimer and terms and conditions to understand our obligations.
19 comments
Would it be better to compare this surfer strategy (+102%) to the 90+ stock ranks (+394%) over this time period rather than the FTSE 100?
Yes, why has this strategy performed so poorly. It obviously had some big winners but many must be underperforming? If you just select the top VM stocks over the same period it is up over 490%.
Hi Alex. Very interesting article. I very much like this approach - it is logical, intuitive, and objective. And being rule-based, it avoids subjective decision-making and it can be backtested. I have a couple of comments/questions.
1. The basic strategy is intuitively sensible - buy when momentum is low and value is high, and sell when momentum slows down. But to backtest, this must be turned into quantitative rules with numerical cutoffs, i.e. Momentum Rank <= 25, AND ValueRank >= 75, AND QualityRank >= 60. My question is how were these values set? Were intuitively sensible values chosen and fixed, or were they tuned to achieve the performance quoted, i.e. "between 2013 and 2024 the average performance of a portfolio constructed using these rules was 102%"? If they were tuned, were they tuned on the entire dataset from 2013 to 2024, or only on part of it? It is standard practice when training AI systems, to train using only part of the dataset and hold back part of the dataset so that the performance can be tested on 'unseen' data. Has this strategy been tested on data that was not part of the dataset used to tune the parameters?
2. It's not clear to me what "average performance of a portfolio constructed using these rules was 102%" means. The "Surfer Strategy Performance" graph presumably shows the performance of the portfolio constructed by using these rules and investing in all the stocks that meet the 'buy' criteria - so it's not an average, it's just a single simulation. But as the portfolio typically consisted of 100 or more stocks, if I were following this strategy, I would not be investing in 100 stocks - for practicality and affordability, I would choose maybe 10 to 20 stocks. Which begs the question, what additional criteria would I use? If I'm not seeking to improve on the basic strategy, I would choose at random from the 100 or so candidates. If you were to backtest multiple times selecting different stocks each time then you would get a different total gain each time. I would be very interested to know the mean and standard deviation of the total gain. And I would suggest using log(1+gain%) to calculate the mean and SD.
I don't want to sound overcritical - I think this is an excellent approach, but I'd like to understand the performance that I can expect to achieve before implementing it myself using fewer stocks on 'unseen' data.
Best regards
Colin
Its brilliant I am very much in favour of rules based systems but i feel they must be Amenable to tuning to improve even further,please keep me informed
Hi,
Thanks for taking the time to read and to reply.
At the moment, it is not possible to use the site to access the MomentumRank change on a month-by-month basis. I did download the data and calculate the numbers manually.
What you can do as a workaround is use Absolute Price Change (see here). You could filter for companies with positive price momentum. You can also use the more traditional signals that can be analysed on the charting page (link here).
I have noted the feedback - i.e. articles should ideally be more actionable. I'll bear it in mind for next time. I hope the above helps in the meantime.
Alex
Again, i don’t think it’s possible to alert from it on Stockopedia but I suspect you could use an Ichimoku cloud signal to determine the point at which your momentum was running out and sell. This would be easier to see in a chart than tracking momentum drops over several months. So although you couldn’t alert from it you could still look at the chart for a specific signal every few days (I can’t remember which of the bear signals would be the ones to look for from the top of my head) and then use that as the point you would sell. Many years back a subscriber PhilHofGrowYourDough and others used to discuss which signal to use but I can’t find the posts now. We are talking pre 2019. Being able to alert on these signals would be a great feature now I think about it. Maybe there is a way for you guys at Stockopedia to test for those signals in your data for the shares you backtested instead of the past 3 months method?
Even with the issues for screening when to sell I found 2 candidates I like which I am going to watchlist. They are, Saf-Holland Se (ETR:SFQ) and Aumann AG (ETR:AAG) . I was specifically screening the whole of Europe and not just the UK. I plan to see when the momentum turns and then see if I can surf the wave.
I don’t yet know much (enough) about these companies to know if they are somehow duds but they look to me to be oversold and due a change in momentum.
Saf-Holland Se (ETR:SFQ) looks to have turned from a momentum rank of 23 on Nov 2nd to 30 today Nov 6th. Results are due for this company next week and I can’t see any reason why they wouldn’t beat expectations and so I’m cautiously in with a small holding.
Well, that experiment didn’t go so well. The Q3 results weren’t great and I couldn’t see any obvious level of support so I got out again for a 6% loss. It was only a small experimental amount. Might try another one from my list of potential candidates but maybe there is a lesson in waiting for the next results first before buying in? You would miss out on any results day bump but you would have better safety?
I have to agree with other views on the difficulty of setting up a bear screen. What is needed is the ability to download rankings over a multi-year interval as a csv file. It is mildly frustrating to be shown a good system that we subscribers can't readily reproduce!!!
Alex - thanks for this, but I have the same issue as raised by NorwaySpruce below - how can the historic momentum ranks be screened ? I assume this is easy with access to the full Stocko dataset, but not so for subscribers.
I started the process of trying to back-analyse just one stock I hold, Warpaint London (LON:W7L) , and it's a tedious process to have to use the "Print" button and extract the data item by item, the spreadsheet and graph it.
I certainly haven't the appetite to run and update a spreadsheet to hold the data for a portfolio of 20+ stocks. Is there an automated, subscriber way of extracting this ?
Alex - thanks for this, but I have the same issue as raised by NorwaySpruce below - how can the historic momentum ranks be screened ? I assume this is easy with access to the full Stocko dataset, but not so for subscribers.
I am not sure what you are looking to acheive exactly here - but if we are simply trying to avoid stocks that may still be in clear down trend - can we not simply look at the normal charting indications that would likely indicate whether the downward momentum has stopped. It does make sense that one doesnt go against the flow if the current position is that there are still more sellers than buyers - it is tricky though as stoicks can turn quickly and if one is always waiting for soem positivity one is likely to be paying more (upward tick).
In summary what would a chartist say ref Warpaint? is it in a downward trend right now still ?
Thank you. I really appreciate a rules based approach. I am prone to agonising over investment decisions and should probably consider changing my username to Parched Donkey.
It appears easy to screen for the bull signals.
However, the bear signals, particularly the second ‘MomentumRank falls for three consecutive months’, I’m not sure how to screen for.
Setting up a stock screen for these, or a follow up article demonstrating ‘how to’ would be helpful.
For a relatively novice private investor, a rules based system is great for ideas but the signals needs to be easily screened.
Looks a good system to follow . In life afew rules or routines reduce the " what shall l do ? " moments .
Excellent, thought provoking article. Thank you
Hi Alex
I found this article fascinating, thank you.
Is it possible to set up a screen to show Ranks 1/2/3/etc...months ago?
If it isn't possible yet, is anything in the works?
Thanks
A
Good article, would like to hear more about this approach.
As a surfer i approve this message.
But i would suggest that you do need the wave to be coming towards the shore. So the momentum score should be rising. It does not matter if it is below 25, just that it is getting better.
Agreed. I went surfing yesterday and would also warn that you can surf a wave all the way into a catastrophic beach break.
Other surfers can drop in on you ( a good sign here but generally bad form) but if you see no other surfers it's because its getting dark, or the tide has gone out and everyone but you knows about that rip and that reef.
Worth remembering too that there are lots of other beaches out there and you don't have to catch every swell...and often the hardest bit is waiting out the back.
Finally if the tide goes out really quickly and really far. That's a tsunami :)