Can the NAPS trump the market in the USA?

As UK readers will know, I’ve been running the systematic NAPS Portfolio on UK stocks for many years. The NAPS is my “no admin portfolio system”, based on the StockRanks, which takes less than an hour to put together every year. In spite of its simplicity, it has returned almost 15% annualised in the UK and beaten all but 4 out of 275 UK Equity Investment Funds over the last five years.
In essence, the strategy buys the top 2 ranked stocks in each of our ten economic sectors and holds them for a year. Then it does the same thing the year after, rebalancing into a new set of high ranked stocks across sectors and holding again for the next year. Rebalance, Hold, Repeat.
Common questions I receive are on this theme are around whether this strategy “works” internationally:
- “how does the NAPS perform in {country}?”
- “can you publish a NAPS for {country}?”
While it’s too much for me to publish a written NAPS portfolio for every country we cover, I have spent some time building a system to test the strategy in other markets. We’ll start with the USA.
First, some context - Value has struggled in America
Many will be aware that while momentum has fared well in America in the last decade, value has suffered and it is only in the last couple of years that it has bounced back. By “value” I mean stocks that are cheap on historic measures of valuation. Over the last hundred years value investors, who hunt in the bargain bucket of the market, have done very well. There has been a persistent, profitable return to buying cheap stocks which has become known as “the Value Factor”.
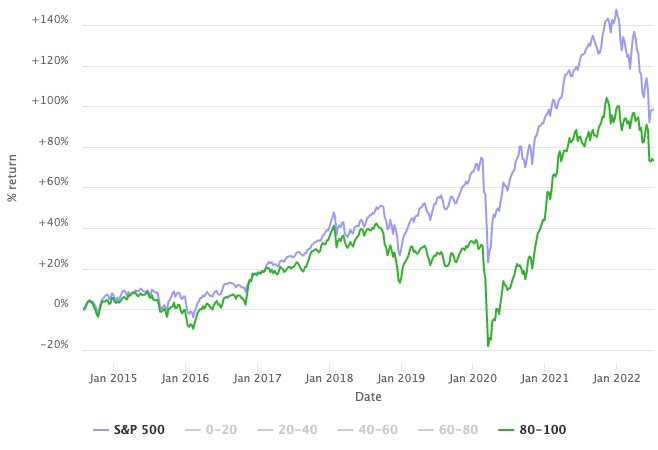
But the Value Factor struggled since the global financial crisis as a surge of liquidity drove capital into momentum stocks. As the StockRanks contains an equal weighted blend of Quality, Value and Momentum measures, the performance of 80+ ranked shares has struggled against the S&P 500. As can be seen below - the 80+ ranked shares (green line) has underperformed the S&P 500 (blue).
But thousands not a portfolio be
Of course, the green line above is composed of probably 2,000 shares at any one time, and those shares are unevenly distributed across sectors and industries. As a private investor you are likely to own just a subset of shares - normally no more than 20 or so.
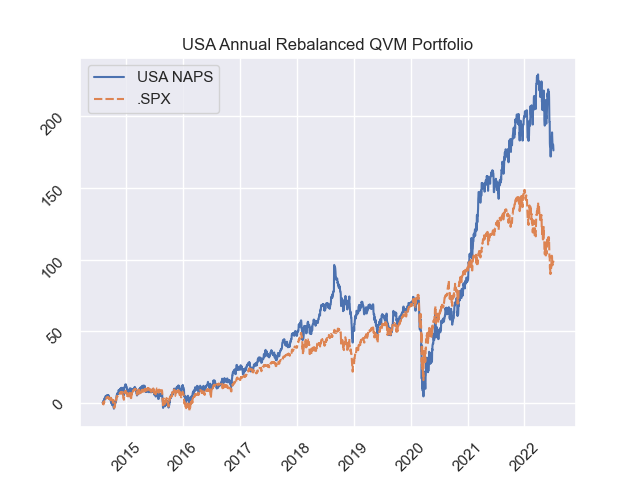
So let’s look at how a more realistic 20 stock diversified portfolio of US stocks has performed. Let’s test the two highest ranked stocks in each sector from the two primary US exchanges (Nasdaq & NYSE) above a £20m market cap, rebalanced annually. The chart below shows this NAPS strategy performance in blue, with the S&P 500 in orange.
Nasdaq a struggle?
Interestingly, the strategy has been quite reliant on NYSE shares - rather than Nasdaq shares - to drive the performance. This is perhaps common sense. The Nasdaq is the USA’s more dynamic ‘growth’ market, often dominated by tech stocks, whereas the NYSE (known as the Big Board) tends to be the bellwether market. Perhaps unsurprisingly the “Value biased” NAPS strategy has struggled on the Growth dominant Nasdaq. While there has certainly been a good return over time of more than 10% annualised, there has been consistent underperformance versus the index.
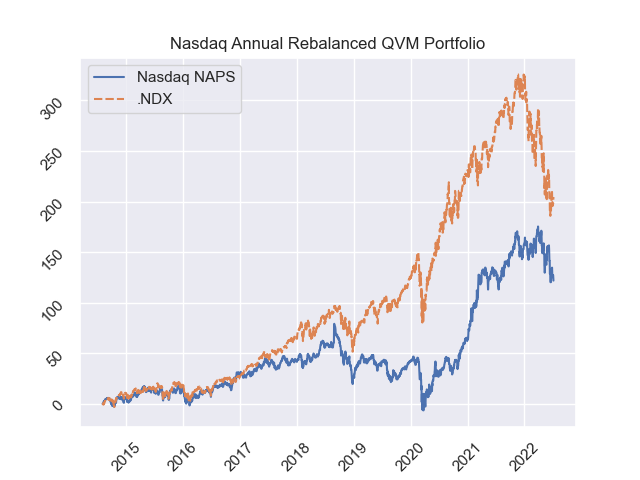
While the end result in the above Nasdaq study has been ok, I am certain that not a single investor would have stuck with it after six years of zero returns while Nasdaq index funds doubled!
What about micro caps?
But finally, what about a micro cap only portfolio? The great thing about the US market is that it’s vast and you can actually build a full NAPS portfolio out of very small shares. Much harder to do in the smaller UK market. So for the following test I’ve done the same general rules (two from each sector by StockRank) but limited the set between £10m and £250m market cap companies.
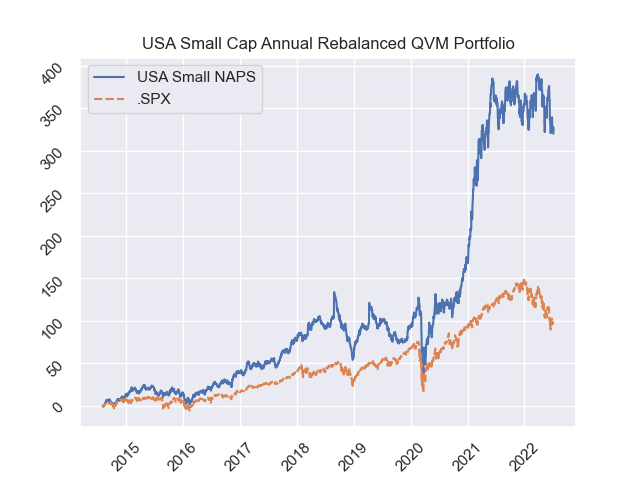
The above shows a 20% annualised return over 8 years, but dominated by pandemic period returns. But even before then the strategy had done extremely well, beating the market throughout.
Interestingly 2020 to 2021 saw a lot of triumphant returns heralded by US small cap funds and investors. There are many Twitter gurus who were running small funds who posted astonishing one year results. It was a “once in a lifetime year” for small cap value investors in the USA. One such that I follow is @hkuppy on Twitter who writes the “Adventures in Capitalism” blog - well worth checking out - but with a pinch of salt as the exceptional returns from 2020-2021 are unlikely to be replicated.
More to come
The above results show some robustness to the NAPS Strategy in the USA, albeit with an achilles heel if used purely on Nasdaq. Of course past returns are no indication of future results etc etc, but it’s gratifying to see the cross sector, diversified approach work so well in a market that hasn’t suited the StockRanks generally. The key point here is that portfolio construction can be of as much value as individual stock selection.
I’ve now run the NAPS in a wide range of other international markets, across Europe, European segments, individual countries, Australia, Asia, India and more - with great results. I will be publishing further on this in coming weeks.
Do let me know your thoughts below.
Disclaimer
This is not financial advice. Our content is intended to be used and must be used for information and education purposes only. Please read our disclaimer and terms and conditions to understand our obligations.

28 comments
Are there NAPS for the US and European markets, this year?
Just looking at the US, notice that top Superstocks have a poor performance, best performing were Value traps. Superstocks + 40%, Value traps +122% from inception. Year to date Superstocks-5%, Value Traps + 19%.
So maybe we should be picking Value Traps in the US markets?
Edward,
I used to have a UK sub but now just Aussie as I decided not to invest in UK shares. I went back to try to read the NAPS blog and now I don't have access. Can you confirm the rules you will be using when you publish the results for other markets? From memory NAPS used to use just Stockranks, but now it uses both highest QM and VM stocks? This is very important for me and I am sure others.
The UK NAPs does select the top QM and VM stocks, over £20m mcap, in each sector but usually only 1 utility and 1 telecoms.
Presume the international NAPS is the same.
Of course you can add your own rules, I exclude stocks with wide spread and high debt.
Surprised you can't see any UK posts.
Thanks for the clarification. Yes, after the recent changes I no longer see any posts regarding UK stocks which is disappointing. The NAPS posts seemed relevant to all subscribers.
Strange as I can see posts about Australian shares and other international shares even though I don't subscribe to those areas.
I have been following a NAPS portfolio in Australia since April before the market really struggled. So far it is outperforming the market quite well but early days yet.
As some have mentioned. Twelve months seems a long time to hold especially in these changeable times. I wonder which factor is better for a 6 month holding period. My guess is that value would do worse and momentum better, quality the same.
Anyone have any thoughts?
BTW trading costs also become more important.
Well SNAPS is done after 6 months, I don't have the figures but from what I understand, NAPS has outperformed SNAPS, although that may have changed in the last year. Trading costs maybe low but the spreads can be wide in the UK market. QM has performed poorly in the last year.
A VM based NAPS may perfrom better in these type of markets.
It all depends on the year. For me, the point is to not worry about timing the market etc. The one year time period for the naps gives it a chance to adjust. For example, this year is around 15% down now , but could easily get in to profit by the end of the year . It’s an individual choice I guess. All years are different but the naps is proven over time so I’m inclined to stick to Ed’s proven time of one year. If it’s not broken , don’t fix it ( but tweak and experiment occasionally!)
I would be very interested to see how this NAPS system has worked in the Australian market. Hopefully you will publish those results soon. I would also like to know how you decide on the top 2 in the sector based on Stockrank when there are often more than 2 stocks with the same Stockrank value in each sector.
Or in the US markets you will find numerous stocks with the same scores. If you go into the sectors or the top ranks it lists them in order, presumably the the highest scores are at the top. The old site was much better at doing this as you could dual sort by ranking and sectors.
Hi Ed
Thanks for the analysis, very interesting.
I wonder whether there has been any consideration for a "Rolling NAPS" system, whereby a share is sold if, for example, the Stock or Momentum Rank falls below 85, and is then replaced with the highest Stock Rank pick from the same Sector?
I ask in the context of the Stock Rank of Atalaya Mining (LON:ATYM), which I believe is in the 2022 NAPS, falling below 85 today.
Presumably one would still only work a minimal amount per year, yet be able to take advantage of a holding going out of favour or losing momentum.
I must admit to never really understanding the rationale for holding for a fixed period. Why not sell when the story changes? It would certainly be fascinating to see if the NAPS would perform even better with this tweaked approach, or if possible extra trading costs/CGT would make it a worse proposition.
Cheers
A
A quick look and around 15 would have been replaced this year already, some maybe were below SR of 85 anyway at the start, as its based on top QM and VM.
The spread on of one the stocks selected is very wide, I would still be using the old rule.
What if its still the top pick in the sector, such as Airtel Africa (LON:AAF) ?
NAPS has worked well in the past up until about 1 year ago.
Does it make sense to sell and replace stocks because the market falls?
Atalaya Mining (LON:ATYM) momentum score was only 76 on 15th March, 2022.
Hi Rustbucket
Thanks for that, and interesting to know that there would have been 15 trades already.
I should add that the Stock/Momentum Rank threshold of 85 in my previous post was purely arbitrary.
Nonetheless, and as a genuine follow-up, I'd be interested to know if performance would still have been better with those additional trades.
As to the comment on NAPS working well so far, so why change it - I've thought about this too. If it ain't broke, then why fix it?
But I've since changed my mind. I think we should always be looking for improvement, even on the strategies that already work well for us.
Cheers
A
It would be very difficult to tell if performance would be improved, as not knowing which stocks would replace the sold ones, there are very small margins between some stocks, maybe Ed has access to that information.
I'm all for tweaking to improve results but not too much. The change from top QVM to top VM and QM worked well.
This year is fairly unusual, stocks may recover but I'm pessimistic.
I did try to do a US NAPS folio today but found it very frustrating with many of the choices not being able to trade on my platform or were foreign companies such as Chinese, Korean, Brazilian etc. I'm only interested in US companies, dont suppose its possible to exclude these?
Have you tried updating quarterly or monthly?
Coincidentally this podcast was published this week;
https://www.infiniteloopspodca...
A discussion between Ian Cassell, founder of micro cap club who researches US micro Caps in exhaustive individual detail, and Jim O'Shaughnessy (a spiritual Godfather to Stocko) who of course takes a factor/quant based approach similar to Ed's.
A mountain of useful knowledge from both of them!
I look forward to seeing the analysis of other regions, particularly Asia where there is some extraordinary value potential.
Thanks Ed, I am glad you are researching this - for the selfish reason that my retirement savings are in the USA while I am living Germany for the time being. I am currently pulling 2.4% of my portfolio each year (dividends) to support my retirement so I will take a serious look at your NAPS strategy to see how it might be adapted to my dividend growth strategy.
Capital flows to where it's treated best. Capital is escaping the economic vandalism currently underway in Europe. Wealthy Germans are not concerned about a Piotroski score or a Greenblatt screen. For money seeking refuge in stocks, "big is beautiful." Escaping capital appears to go mainly into the DJI and of course US treasuries as interest rates rise. In order to capture some of this effect I like DJD which is a dividend weighted DJ30 ETF. Low expense ratio too.
I would strongly recommend adding Total Return calculations to your guru screens (reinvested dividends). This could, for example, push Dreman's high dividend guru screen up the rankings. However it would also improve many of the other guru screens that feature companies with dividends including Fisher's price to sales. At the moment we have to approximate by adding the average yield% to the price growth% to get a rough adjusted total return. It gets more complicated when there is dividend growth too.
This would all be easy if stocks traded mainly on fundamentals but unfortunately its sentiment & momentum, interest rates and our best guess as to the relative degree to which economic vandalism and government meddling is likely to affect future stock prices. Despite this, I still like to check the QVMG fundamentals at Stockopedia because I think it gives me a long-term edge in safety and return. For example I needed some shipping stocks so I picked best 5 of "Freight and Logistics": bargain prices and nice yields. Small nibbles at each. I don't have any special expertise but have been burned too often thinking "finally, I understand". I am pretty cautious right now because I think US rates will continue upwards while the majority seem to be betting that J. Powell will back down. Economic vandalism is in the US too, so my humble advice to other Americans is to keep plenty of cash on the side and move cash from savings to checking - more protected under US laws!
Another metric I would be interested in is international capital flows with one click! Many Thanks
EuroNAPS would certainly interest me. The American market is hard to follow and I have largely steered clear of it apart from a tragic case of “bear capitulation” need the top last year, thankfully only for 4% of my otherwise Deep Value Dave strategy. NAPS is fascinating. Has it just piggybacked the bill run or is there true merit in the philosophy??
I ve used this strategy in the past and it has worked well. I am basically a "buy and hold for ever " investor so this annual buy and sell has a disadvantage in that it crystallises profits ( and the tax to go with that ) . if you dont sell then you have the benefit of a government loan from the unpaid capital gains tax on the unrealised profits.
I suppose I m just being to picky and ungrateful - but any ideas ?
John bradney
John yes of course... the taxability of an account has implications. In an untaxed account like an ISA then the turnover doesn't trigger CGT.
Great work Ed and very interesting. Perhaps you should be publishing a NAPS for UK, Eurozone and US each year.
Various questions.
1.I wonder if the returns of the three have all mimicked each other at the same time?
2. Are these total returns or just share prices?
3. I presume there will be currency effects at times too?
4. Was one of your conditions that the stocks are big board and not pink sheet?
In terms of diversifying risk it would make sense. Anyway, thanks again for an interesting piece.
@MH1
Maybe people should have a Value orientated NAPS for NYSE, and a Growth orientated NAPS for Nasdaq?
Interestingly, while pure Nasdaq underperforms, the NAPS performs best when combining NYSE & Nasdaq. The broader universe improves performance.