Didn't buy Warpaint? Why clear uptrends are the best uptrends and 20 stocks to consider now

Ever been in a situation where you’ve loved a stock, but waited and waited for the correction that never came? I’ve been watching Warpaint London (LON:W7L) for a long time as it has many of the traits of multibaggers, but I couldn’t bring myself to buy as the price trend never corrected. I should have known better!
It turns out that shares that stocks that have the clearest price trends have the strongest momentum effects. A recent paper titled Trended Momentum delves into this idea in depth.
The authors demonstrate that shares with distinct price trends more than double the returns to a standard momentum strategy. This has pretty profound implications both for stock pickers and systematic investors who wish to improve their investment results.
More than this, I’ve found that separating the 80+ StockRank universe at Stockopedia.com into a high Trend Clarity set enhances the returns of a 20 stock UK portfolio to more than 14.8% annualised since 2013. Let’s dive in.
What is trend clarity?
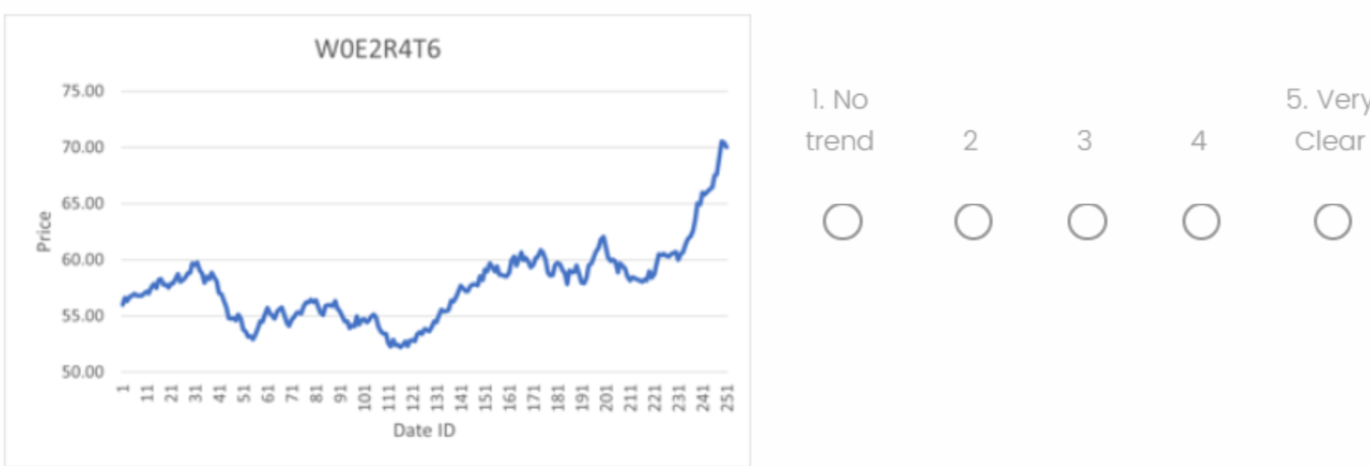
The authors of the study theorised that clear and distinct trends are more favoured by investors. They devised an online experiment involving 128 participants who were given charts to assess and rank for trend clarity. They were asked to evaluate the trends of charts from “no trend” to “very clear”.
If you remember statistics classes from school then you’ll have a fair memory of drawing lines of best fit across scatter plots. This is called Linear Regression, and is used extensively across many domains. As you can see below Price Path A (left) has a much better line of best fit than Price Path B (right). It has more trend clarity.
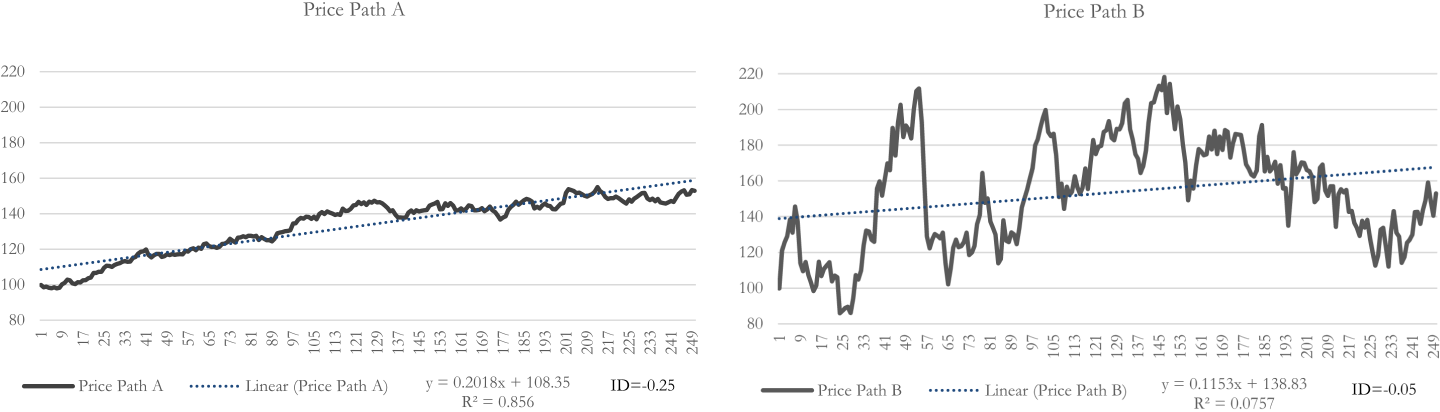
There’s a number, called the R-Squared (or R2) which defines how accurately the scatter can be defined by a line of best fit. A has an R2 above 0.8, B only 0.07. This allows a numerical calculation of the trend clarity. The authors found that using the R2 is a great proxy for finding the same kinds of charts that the survey respondents identified intuitively as having clear trends.
This is a simple approach, and can be replicated in any spreadsheet application - Google Sheets or Excel.
How useful is trend clarity?
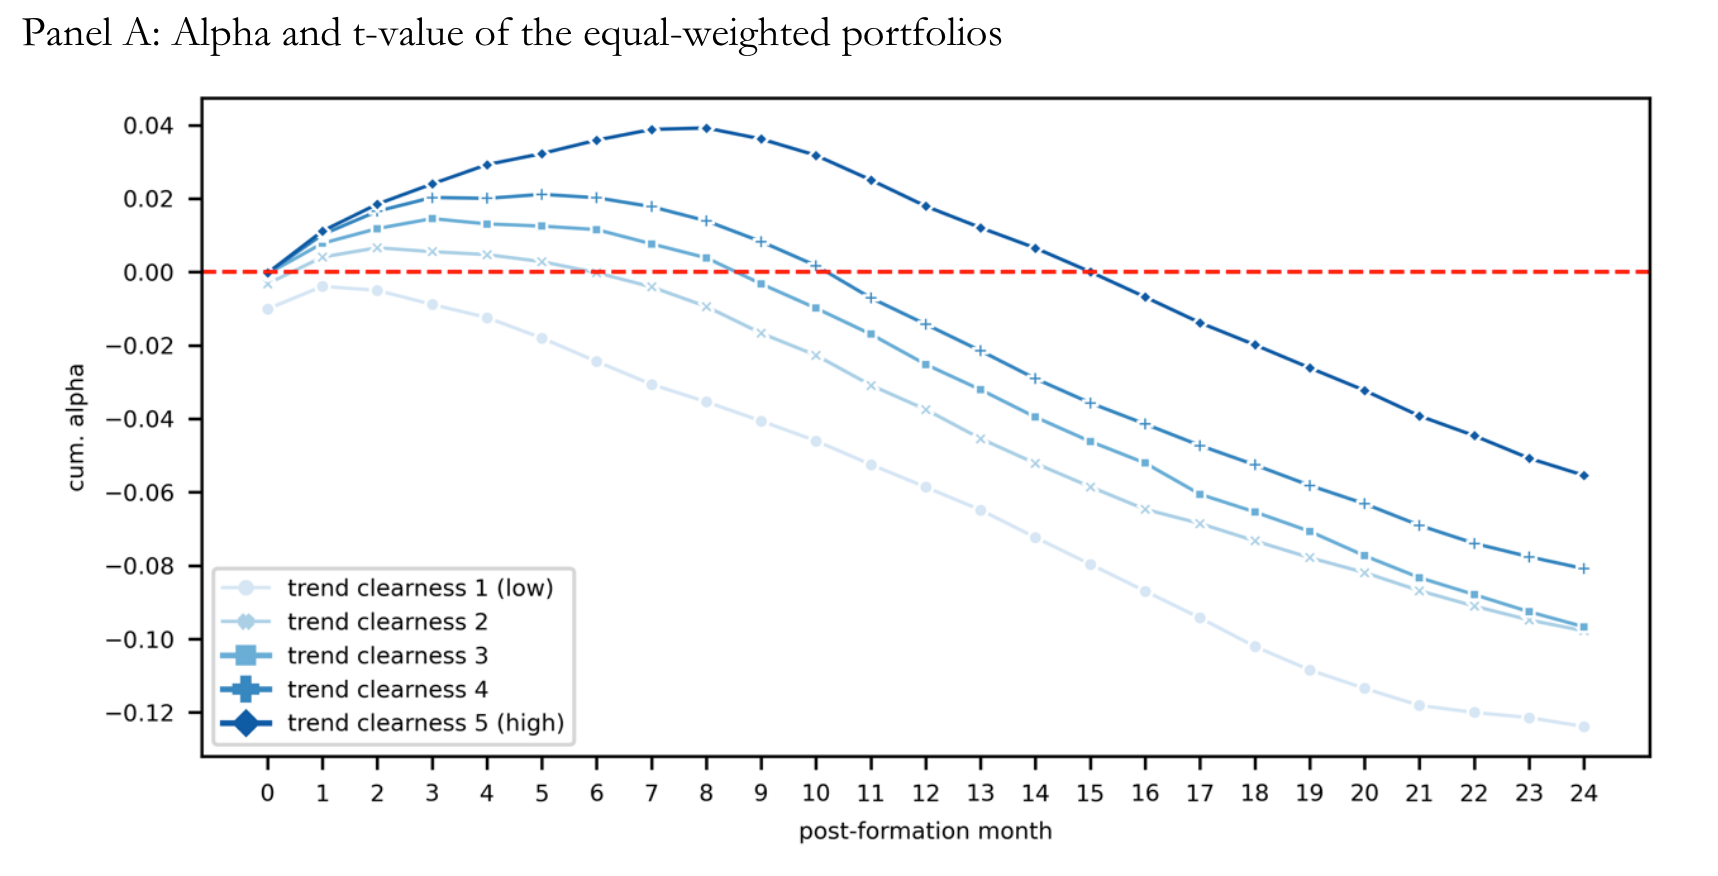
The authors separated all the stocks in the market into five buckets (quintiles) based on the 1 year historic price performance. The top bucket being the best winners, and the bottom the worst losers. They then split each bucket into five more subsets according to their Trend Clarity.
It turns out that the winner portfolios with the highest trend clarity generated significant outperformance (dark blue line below). It peaked at 8 months, but persisted until the 15th month. This outperformance is independent of any other return drivers (like quality or value or size). Ultimately they found that clear trending, high momentum portfolios generated an 11.34% annualised return - almost double that of a traditional momentum strategy.
They also found that:
- high trend clarity stocks were less likely to see longer-term momentum reversals. Good news for longer holding periods.
- higher trend clarity stocks had a higher likelihood of having consistently beaten analyst expectations in the year before the portfolios were formed, and the year following.
- results were strongest in more mature, developed markets. Good news for UK investors.
This study backs up some of the work done by Andreas Clenow in his excellent book “Stocks on the Move”. He also used the R2 of a regression to generate smooth trending portfolios of S&P 500 stocks with similarly impressive results. If you want to add a book to your reading list - I'd highly recommend it.
Taking it further
I’ve run an adapted study on UK stocks using 6 month price strength, as many studies have shown 6 month momentum to outperform 12 month momentum. I wondered if this approach could improve the returns to the 80-100 StockRanks set. Starting from April 2013, which is when our archive database begins:
- Starting from about 330 stocks in the 80-100 StockRank set.
- Separate out the top fifth by historic 6 month price performance - about 66 stocks.
- Calculate the trend clarity for each. (Linear regression → R2)
- Select the top 20 by trend clarity.
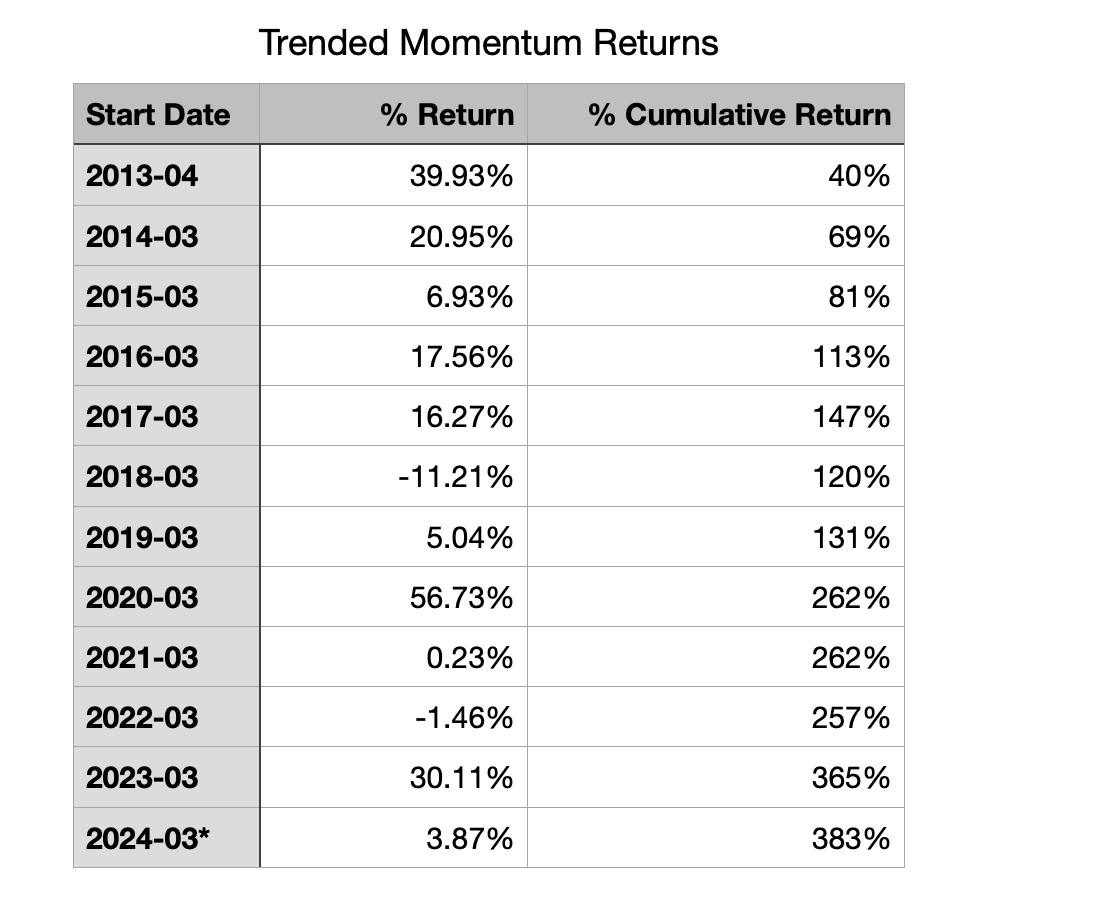
The results are very eye-opening. A portfolio constructed in this way, and rebalanced annually has generated a capital return of 14.8% annualised. This is a 380% return over the time period - far above the results of annually rebalanced 90+ StockRank stocks over the same time period (at 214% and 10.9% annualised). (For reference, using a 1 year lookback period is not quite as strong at a 270% return.)
Rules of thumb for investors
Ultimately, we all need some good takeaways. Let’s be clear, if you see a very smoothly rising price trend, like with Warpaint, you are unlikely to be an early buyer as you will wait for a correction. You’ll then end up buying too late. This is a mistake.
We should train ourselves to buy stocks that have clear and strong price trends, as these are likely to exhibit stronger and more sustained momentum. The survey shows that we all have a very intuitive sense of what a clear trend is. You don’t need to do a linear regression - just eyeball the chart.
The top Trended Momentum stocks in the UK market now
I’ve run this process for UK stocks to generate the top portfolio right now. It’s skewed towards mid and large caps, with only 1 microcap in the set.
It's particularly interesting that three gold miners and a copper miner are in the set. Hopefully that's a good set for you to dig into!
Disclaimer
This is not financial advice. Our content is intended to be used and must be used for information and education purposes only. Please read our disclaimer and terms and conditions to understand our obligations.

140 comments
Rusty, that's interesting. Did you select the smoothest charts just from a visual assessment? How many shares in the portfolios?
Yes just looking at the charts. Smoothest had 16 stocks and Large trending had 20. I'm surprised at the results but large caps have done well lately.
Looking the charts now, there not many smooth ones, probably due to Trump.
Doing the selection this time looks more difficult.
Well it's now a year since this article was posted so perhaps we will get an update soon.
The portfolio I set up of the shares mentioned is showing a one year gain of about 20% compared to around 5% for the FTSE all-share index and about 10% for the top (90-100) stockranks.
So, an impressive performance, although the portfolio benefited from a strong gold price and a bid for Bakkavor.
Yes a good performance but not sure it is better than NAPs. I did a NAPs, 1st May 2024, it is up nearly 29%, in 13 months, 24.8% over the last 12 months.
I also did a trending folio but picked the smoothest charts, that is up over 40%.
Trending Large caps, also up over 40%, in a year. Every stock was up.
The trend/multibagger model portfolio has been running for a year now with only 4 stocks left, 2 of those being gold, 1 defence (which ties in well with sector trends) and 79% in cash. Ended with a 32% gain with a max of 45% at one point. Worth pursuing imo when markets pick up
Some of the stocks that are or have had recent clear trends. I own six of them.
LON:IAG International Consolidated Airlines SA (LON:IAG)
LON:SNX Synectics (LON:SNX)
LON:SRB Serabi Gold (LON:SRB)
LON:CHRT Cohort (LON:CHRT)
LON:MGNS Morgan Sindall (LON:MGNS)
LON:WISE Wise (LON:WISE)
LON:BPM B.P. Marsh & Partners (LON:BPM)
LON:IHG Intercontinental Hotels (LON:IHG)
LON:OTB On Beach group (LON:OTB)
LON:JUST Just (LON:JUST)
LON:CRN Cairn Homes (LON:CRN)
LON:ELIX Elixirr International (LON:ELIX)
LON:ANP Anpario (LON:ANP)
LON:BKS Beeks Financial Cloud (LON:BKS)
LON:CNC Concurrent Technologies (LON:CNC)
LON:SGE Sage (LON:SGE)
LON:MPAC MPAC (LON:MPAC)
I've been using a mix of multibagger (thanks Ed) and trend clarity features in a model portfolio since April last year with buy and sell rules, re-balancing if required once a week. So far its made 40%. I'm slowly building a portfolio using the lessons i've learned along the way. Some great info coming out of Stocko lately
That's so great Paul !
Paul,
A great result. Could you, or Ed remind me of the Multibagger screening rules please?
P.S. An interesting trend clarity list!
There's a series of videos from which I gleaned all the information but cant find it on the site.
An example screenshot below. I have expanded it to all stocks regardless of mcap as I found I was missing stocks like Rolls-Royce Holdings (LON:RR.) and International Consolidated Airlines SA (LON:IAG) for example. There's lots of valuable info in the videos
Wow Paul - I have never seen so many metrics incorporated into a screen. I will try it. Ian
Yeah - that was the leftfield screening approach! There were a few screening approaches mentioned. Check out module 3 on this page.
Erased. (link not working for other people)
That link does not work, just goes to the home page.
Sorry. It works for me, but there are extra parameters at the end of the url compared with what Ed has now linked to. Got rid of it now.
Ed's does not work, for me, either. We have had this problem before on here.
You could try the shortest working version of the url https://why.stockopedia.com/mc...
Other than that, might need to use the green button if you want it.
If l press on it as usual, to open a link, it goes to the today screen. However if l press and hold it, does open to the link.
Strange l don't have this problem on other sites.
10.55% after 7 months is pretty good. In practice you'd have some sell rules in there so gains would be more. Biggest winner was Serabi Gold (LON:SRB) which 1 bagged
Removed ERRATA!
But it's only been 8 months since the article appeared. I make it up an average of about 12% since I took a snapshot on 31st May in a google sheets spreadsheet. (Unless your selection was made earlier than that and then published a couple of months later.) I didn't check for any stock splits though, just in case there were any.
The article was posted on May 30th 2024, about 8 months ago. I set up a Stockopedia folio of the shares listed and it is showing a gain of about 6% since then compared to a drop of 2% in the All-Share index.
Blissgull and Stehuk - you are absolutely right. Apologies - I have removed the erroneous information. I should be wary of doing maths late on Sunday evenings in future!
I set it up also, mine is up 10%. I did not see Ed's post.
A lot of these trending momentum folios have been hit recently. The US one was down 12% at one time.
Hi Rusty, yes you are correct. I was trying to make adjustments to the chart on a phone screen and didn't adjust the dates correctly. My mistake.
Super
Great article, thanks
I expect Ed will give us an accurate update on this in due course. For what it's worth I set up a Stockopedia portfolio of the stocks mentioned when Ed posted this. Looking at the charts as far as I can tell since 30th May when the post was made the portfolio is up about 8% compared to a fall of about 1.5% in the All-Share. The 90-100 stockranks seems to be up about 4% over the same period.
I've been doing a bit more work on trend clarity and related measures recently. Will come out with some more pieces on this soon as the effect is especially strong in small caps, but also seems to consistently improve high StockRank returns. Even built myself a nice little chrome extension to use for stocks on the site.
Ed,
I had a look at the Warpaint London (LON:W7L) price graph and having eye balled it I would classify it differently to your chrome extension.
i.e. My Trend Analysis
Trend Clarity - Weak
Direction - Down
Strength -Weak
I wonder is the difference that you are using 6M Absolute Price Momentum, rather than say 3M?
Thats not to say that "typically" 6M combined with regression arnt the best metrics for producing excess returns though.
P.S. I am using Trend Clarity as a primary screen in my share selection process and am very happy with it.
Yes Ian it does depend on timeframe. My script is running on 1 year price histories. 3 month trend is obviously in the other direction !
Ed,
I have been experimenting with 3M or 6M relative strengh combined with a 3M or 6-12M regression slope respectively. The 3M data gives an early indication of a up or down trend, so Warpaint London (LON:W7L) currently becomes a Sell, but a 6-12M timescale positive trend typically gives a more reliable Buy signal.
Given that Momentum typically lasts about 15 months, (although trended momentum stocks typically persist longer), I think there is mileage in eye balling and/or calculating both the short and longer term trends.
As an example Cairn Homes (LON:CRN) is a lovely Buy example of a 3M and 6-12M trend clarity company with a strong 88 SR too. Cranswick (LON:CWK) is simalar.
Hi Ed. This is great! What I would really like to see is that 1) Subscribers able to use this. 2) Subscribers able to set the timeframe. 3) Make it possible to screen for clarity, direction and strength. Am I just fantasizing?
Yes l make it 8%. Top Super stocks are up about 11%.
Interesting indeed to read your article today as a new joiner to Stockopedia. Previously relied on poorly performing funds to maintain and hopefully increase my investments now I am retired, but with little luck. I have already seen the benefit of the data available to me through your company and purchased shares in Serabi Gold and Mears, mentioned in your Momentum stocks article, but thought I would mention that the only fund I still remain invested in is Artemis UK Select, which I notice has 5% holdings in both Rolls Royce and III-3i, which are also listed in your article for their continued momentum.
I remember tuning into a webinar where this paper and 'stocks on the move' was discussed but I can't for the life of me find it again - in the unlikely event that anybody is still checking this thread and has a link I'd be grateful if you could share it!
Hi Ed - thanks for sharing.
The authors cite Jegadeesh & Titman's excellent 1993 paper on Buying Winners & Selling Losers - which was the inspiration of my Master's thesis as I looked to take the principle and to find winning unit trusts and holding them over different time frames.
I read "Stocks on the Move" and thought the methodology was interesting but the issue I had with the approach is the availability of stock price history to perform linear regression. If I wanted to perform linear regression on uptrends, I would first need to eyeball 2000 UK charts for unsuitable candidates and then download price history for each candidate from SharePad or Yahoo and manually regression test in Excel. Is there a way to present R-squared in Stockopedia? Or can you suggest a way (probably how you did it) to perform this analysis.
Thanks
Yes - I'm very keen that we create something based on this. I can do it via python, but I've got privileged database access! I do think it would be great if we can add something around this.
If anyone is reading automating this analysis and DOES NOT have access to price database - you can set up a spreadsheet and use the STOCKHISTORY() function to return price data for a given share, ETF or IT (does not work for unit trusts). Then use RSQ() and SLOPE() functions to calculate the statistics Ed has presented in this discussion.
Excellent Richard. Any chance of sharing a Google sheet with this?
can you suggest a way (probably how you did it) to perform this analysis.
You don't need daily price data. I tried it using weekly data and it gives a good approximation.
In sharepad set up a table with columns for price, price 1 wk ago, 2wks ago etc. If you have a way to divide up your investment universe into groups of 200 shares the live table export works well in sharepad. Then, in excel or other spreadsheet do the slope and R2 calculations. Because of the live table function, the data can be updated with ease.
Obviously I meant suitable candidates for liner regression, rather unsuitable candidates!
Hi Ed, this is a fascinating study. Is there any chance you could share the Trended Momentum screen that you used so that users can duplicate and have a play around with it?
A comment on the SNAPS article prompted me to review the ongoing momentum in this portfolio.
It's too short a timeframe to make any serious judgements of course, but there's been a 6.5% return since publishing on 30th May to the 17th July.
When to sell - 6 Month R2 < 1 year R2
Well-defined rules for why you buy would avoid missing out and momentum alone would make it difficult for me to justify an investment.
Looking back as to why I invested It was all related to value investing and being able to buy it at NAV for an average buy price of 36p. (see graph below).
My Valuation from March 2020 data.
$W7L has become my largest position due to stellar performance over the past 4 years. You have to give credit to management's growing experience and skill for improving business and potential valuations. My rules mean I have been a seller at predetermined prices, as the company keeps exceeding expectations and dominates my portfolio.
Valuation from June 2024.
Today I can still see the company being able to improve the business and resulting valuation. (see above graph). I wish all current and future holders well.
As always DYOR
BSV
These are the stocks at the moment with the cleanest trends according to Andreas Clenow's method if anyone's interested. The only stipulation ive made is not to include any Sucker stocks
Could you somehow provide a US/EU equivalent list using that formula? Or could you share the formula itslef so I do it ? Thanks
The formulas are in Clenows book, Stocks on the Move.
Hi Ed
I'm not sure if this is the place for it, but I'd certainly be interested in seeing research on a Value Strategies over longer time periods, say 2-3 years.
I don't generally follow a Momentum Strategy as I personally try to position my portfolio between:
Obviously with the latter I'm very dependent on when that value is realised, hence the longer time frame required.
I have made my largest gains from Value, hence my interest here, and I imagine that if I looked at those holdings on a 6-12 month timeframe they might look like failed investments compared with something like the NAPS Portfolio.
But would that still be the case over say 2/3/4 years?
It would certainly be interesting to see some insight behind this.
Thanks
Hmmm what is the causing factor here for these shares to be moving upwards ???- we say for this specific group they have a higher than average prior history of beating expectations - ok no no shit Sherlock - if we take a group of shares doing better than previously expected - where would we expect the price to trend in the next 12 months up or down?
So what is the cause of these shares doing well ? is it the clear trend or the fact we have picked a sample group that are known to have performed well compared to prior expectations.
By picking a biased sample the results will obviously look good. Compared to the whole where there are more companies that have had poor updates. To get fair comparison here I would like to compare results against sample of stocks that have similarly beaten expectations but ignoring the trend - and see which ones perform better on future basis.
It is very interesting that these stocks continue to beat expectations into the future - that seems like genuine good news - the reasons though seem common sense related - if stocks have decent short term history of beating expectations it shouldn’t massively be a surprise that this subset of companies hitting a sweet spot should hopefully be expected to perhaps continue that good form.
In summary are these strong trends not the obvious result of having started with subset of shares that have known to have done better than previously expected. Note by comparing against similar set of beating companies “trend ignored in reference period ” it will be interesting to see if the results for that subset is beaten.
Note I am not doubting that this could be a good screen - there will be many companies that perhaps beat due to random reasons - that don’t really then have great plan going forward - so it could be that the proof of the pudding has been delivered by shares with rise in price in that the test of the market has also been met that they have satisfied the market in respect of past and future.
rmillaree - not sure why you'd say it's a biased sample. It's just a set of stocks in an uptrend with a good fit regression line. It's all historic information, available at the time of portfolio construction - why is that biased?
Do read/scan the paper. There's a lot in there, especially on earnings surprises (SUE). High momentum, clear trend stocks do have higher historic earnings surprises.
I wouldn't be surprised though if the trend clarity factor was a better predictor of future returns than the more salient earnings surprise factor. But that needs research.
Is the good regression fit simply low recent volatility?
I wouldn't be surprised though if the trend clarity factor was a better predictor of future returns than the more salient earnings surprise factor. But that needs research.
I wouldnt want to presume either way - but i would be very interested for comparisons to be run between this method and a method based on "earnings surprise alone" - as this sample clealry has bias in that direction ref consituent parts - imho its possible that that could be the reason the data beats the market on average as clearly there is less of the crapola companies dissapointing being included - one would have to run the comparison to find out though - that would be interesting test from my viewpoint. One other test would be trend plus excluding any companies failing to meet expectations as perhaps that could trump both results.
rmillaree - not sure why you'd say it's a biased sample.
if you run the test on companies beating earnings alone (ignoring trend) and that came up with the same results that would suggest to me the reason for the good performance may be the earnings beat as much if not more than the trend.
with any sample of data being used you have to be careful not to pick a biased susbset to get fair results or find out what is causing the outperformance imho. its so easy done to choose subset of data that can have other reasons for results than what you may be looking at as your main indicator. Whether that matters ot not is another matter - i dont knock that this method appears to work - just trying to understand what is the reason for the outperformance - to some of most it may not matter as to why it is so.
Hi rmillaree. Like you, I would be interested in the reason for the outperformance. I did consider trying to find out what the news was that started the price rising, and putting this as a step in my process. But in the end I ruled it out because of the work involved and my lack of clarity as to how I would use the information. In the end I settled to just make use of the fact that shares with a higher degree of clarity of the 6m share price uptrend are likely to do better than those with no, or an unclear uptrend.
In a bull market, all stocks rise. If you follow Minervini or O'Neil you will know the best performers start with some form of catalyst and the price trend would be sustainable through market pullbacks. These stocks will also be leaders in their sector and the catalyst could be an earnings upgrade, new product launch, earnings accretive acquisition, new board, etc. all of which will be in a RNS or analyst research (e.g. Research Tree). So it should not be too hard - but if the trend is fully established (Minervini has a 4-month rule to confirm a Stage 2 uptrend) then does it matter what the catalyst is, if you are purely buying the technicals.
Relying on Trend Clarity is after the fact and if this is selection bias then, as a trader, this would be my edge. My only issue (sorry Ed) is that I wait for consolidation or pullback before entering a position rather than "getting on" the trend, an unfortunate hazard because I missed Warpaint. That said, I found alternative shares to War Paint, such as XPS Pensions (LON:XPS), that have done well and I was early to the trend.
Clenow's approach is mechanical. You could adapt it by applying some discretion (removing Sucker Stocks and Value Traps) to your list. This may be your edge and requires a little bit more work. If was to adopt the process I would look for shorter timeframes and trailing stop losses.
Could we have a monthly post on a separate thread on stocks meeting the criteria to keep this in focus and current? Ken’s monthly update on investment trusts is always a must read and feel this topic deserves the same.
Barbara - I can't commit to it at the moment, but trend clarity is a factor that quite a few of us here are keen to explore more.
Hi Ed
Would appreciate your thoughts on BAKK
In Jan Paul and Graham gave this co Amber/Red, quite rightly. But now it has a stock rank of 99 and the share price a great momentum! Can you give any explanation
Ps should I be asking Paul/ Graham
Cheers
Darei - re. Bakkavor - definitely don't ask me. I do some stock picking, but I'm a statistics guy at heart these days!
99 StockRank - my statistical view would be - it's a high quality, high momentum stock. Looks a bit over-extended right now technically, but many stocks in the UK market are getting re-rated.
Have you considered looking at "downtrend clarity"
I would expect the indicator is symmetrical and would give insights.
One of my consistent bad habits is buying while a stock is still in a downtrend and not selling when a stock enters a downtrend.
Also, stock price movements on a day to day basis are pretty closely correlated to the relevant stock index. Wouldnt you want to look for a clear trend of outperformance/ underperformance of the index.
I haven't, but I would imagine this is exactly the same but in reverse. All the biases we have against buying uptrends, we have against selling downtrends. So smooth downtrends keep people in far longer than they'd like - the momentum will likely persist.
I have improved my process to take account of this idea. I really like it when I can introduce improvements which are based on academic research!
"I have improved my process to take account of this idea. I really like it when I can introduce improvements which are based on academic research!"
Absolutely - glad to hear it's useful. That's really my point of view on the academic stuff - if we can pull useful heuristics (rules of thumb) from academia, it helps with everyone's stock selection. Whether as stock pickers, or as more mechanical investors.
I think improving one's judgement is about developing good rules of thumb!
Last June, l picked the top 20 momentum stocks on Stockopedia, the only rule was maximum of only 4 per sector. It started on 13th June, 2023, so just under 1 year, the return is just over 29%. Not sure if Ed can run a back test to compare the results?
The top 2 stocks are Rolls-Royce Holdings (LON:RR.) +201% and Yu (LON:YU.) +165%, the worst 2 are Abrdn (LON:ABDN) -28% and Ramsdens Holdings (LON:RFX) -27%. Warpaint London (LON:W7L) was not selected.
Browsing the Top Stockranks. Top Momentum is up 422% since June 2013.
So does Trended outperform the Top 25 Momentum stocks?
I think Serabi Gold is worth a close look, albeit I am biased as it is for me a significant holding.
It may on the surface, just look like a beneficiary of the recent gold price rise, but there is more to it than this.
They have credible plans, to double production from what was achieved in 2023, by 2026, which are already bearing fruit, by investing in some additional equipment and a reopened mine. What is particularly interesting is that the increased utilisation of existing equipment and sharing the fixed costs of the company over greater production should reduce their all-in sustaining costs by approximately $300/oz and thus significantly increasing their margin.
If the gold price remains at the current level that gives a further margin improvement from 2023, so that we have a multiplier effect of increased production * increase margin, giving much higher profits. Apparently the increased demand for gold has been caused by China wanting to move their foreign currency reserves from the Dollar to gold, so this is likely to underpin the rise.
There are also grand plans to actually not just double production, but to then triple again, but this is reliant on exploration working out and major investment taking place, so I am not confident about that ever happening.
Obviously, this is a small gold miner, with what is effectively a single site, in a remote location, in Brazil, so has all the expected risks, but I could see the share prices doubling or more in the next year and then continuing to increase.
The news section on the stockopedia entry has good links to presentations, and the all important detail for your own research.
Serabi Gold (LON:SRB) looks like a call option on the gold price to me only without the time decay component.
Having been a holder of Warpaint London (LON:W7L) since 2021, I think that there are times when the chart is the last thing you should look at, especially when you get in early, before the big gains. I bought in June 2021, based on the fundamentals. At the time there was almost zero investor interest, low volume and after peaking at around 222p in Sept' the chart kept dipping and looked ugly until Nov' 22. I didn't sell because it kept issuing outstanding interim trading statements and figured investor sentiment would eventually catch up with the fundamentals. In the case of WZL, it was a case of fundamentals first, chart second as Robbie (Naked Trader) says.
Hi Ed, It is an interesting concept and I had a look at how I would score each of this group based on the first 6 months and how it correlated with the second six months.
GFM, MPAC,DWHT,SYS1 were clearly level first 6 months, clearly up for 2nd 6 months.
NWG was 1 clearly down then 2 clearly up.
RR.,III,PAF,RTC,W7L were 1 clearly up then 2 clearly up
PLUS,CKN,CRN,RNWH,CMCX,CAKK,TKO,MER,KITW,SRB were 1 unclear, 2 clearly up.
As everything went rocketing up from end of Nov I don't think this year's data is a good example to test on, only RR. etc support the hypothesis.
It might be useful to do it on another year's data where the overall trends are not so clear.
Maybe we need a measure of how strong/straight the trend is, which is presumably available from some of the other measures? Alternatively is it about when the key dates are that trigger change in momentum, such as "Sell in May and Go Away"?
I think Dewhurst (LON:DWHT) was down in first half, around 30%.
Yes a lot of these would not have picked 6 months ago. MPAC (LON:MPAC) only qualifies in March '24, share price was around 425p.
As everything went rocketing up from end of Nov I don't think this year's data is a good example to test on, only RR. etc support the hypothesis.
Two points about this. The 1st is that the original published data used to evaluate Trended Momentum was US company data from 1927-2020 (93 years). The 2nd is that Ed's UK backtest interpretion (table above) showing a 383% cumulative return is from 2013 to date.
Both are a lot longer than than last Novemenber!
I don't have a problem with the paper, or Ed's work, both of which say if you have a strong trend go with it. It's the practical application of this I am interested in. Their supposition is that the last 6 months is the best indicator for the next 6 months that needs some extra guidance for when the trend changes. It is notable that the Aim Allshare that Ed uses for risk changed direction in November, which correlates with the changes in the list above. (Fair point Rusty2 re Dewhurst)
Yes the past 6 months has been good for Momentum stocks, but the 2 years before was not good at all. I'm interested in comparing different strategies. Is Trending better than the top Momentum stocks or top VM stocks?
Some of the selections look well advanced to me.
Rusty2 - yes there are a lot of well advanced shares in the list.
I wouldn't be surprised if I get called out by someone for this list underperforming in 6 months - but the odds are favourable if the UK market continues its recovery.
It's the principles I'm mostly trying to convey. It's not a conviction buy list! DYOR / no recommendations.
caught the uptrend in RTC, bagged and sold in the mid 90's as it felt fully valued, hope it's not one I live to regret selling
So, all the money we pay Stocko for all this detailed info about Balance Sheets, P&L, ROCE etc. is wasted, right? All we need to do is look at the chart. Job done.
Referring back to grb's comment "I suspect that many high-trend-clarity stocks will have started their trend at a lower stock rank" I have often wondered about this and am still finding ways of getting the most out of Stocko after years of subscribing, it's a privilege I pay for, don't I? The stock rank may not move much, if anything at all, yet the share price can be very mobile. Take as an example, Greggs (LON:GRG) . Using your chart I can see that from the dip at the end of last October the StockRank at 72 is yesterday unchanged. The share price has improved 30 percent over the ensuing 7 months. Back then I did have a gut feeling along with Balance Sheets, P&L, ROCE evidence etc, but chose not to to buy......
On the Stockrank screen, below the chart there is line for the Stockrank.
Greggs (LON:GRG) the time to buy probably around 2500p, has momentum, going above 30WMA, volume increased.
Natwest (LON:NWG) the Stockrank did not go above 80 until the end of February '24. Share price was around 230p. I use 30 week moving average, it crossed that around 250p, early March. 6 months ago l would not be looking to buy it.
Some shares the Stockrank does follow the share price, l noticed this on the large US stocks, see Apple (NSQ:AAPL) and Alphabet (NSQ:GOOG).
MPAC (LON:MPAC) share price goes up, SR goes up. It crosses above the 30WMA at 250p but if you wait for the SR to reach 80, it was about 428p, which is too late, in my opinion. I did buy some around 294p.
Thats very interesting, thanks Rusty
Hi Edward, really enjoyed this one, a feeling i often have! cheers
Great work - but the missing component here is when to sell. After six months? When the momentum fades?
You also selected SR > 80 stocks. Did they perform better than lower ranks? I suspect that many high-trend-clarity stocks will have started their trend at a lower stock rank. How much (on average) does the stock rank change as the trend continues?
Gulf Marine Services (LON:GMS) has been on a lovely clear trend for a year or so but has faltered a bit in the last month. So that's the trend clarity lowering. Is that a useful signal?
Sorry for so many questions - but there are many directions in which you could take this analysis further...
Re. "When to sell" - this study is just based on 1 year holding periods. i.e. "sell after 1 year".
You could, of course, implement discretionary sell rules (and buy rules).
I'm interested in whether trend clarity returns can be improved by an optimal entry strategy - e.g. buying at the lower end of the trend line, and by using risk management approaches (like stop losses).
I haven't tested the approach with lower ranked shares, but I would imagine the results would be similar (although at a lower annualised return). i.e. good trend clarity in high momentum stocks at any ranking level may improve returns.
I wonder how long it will be before an AI app can provide this date in 25 seconds!
I have a version of this in excel using data from another provider that is effectively instantaneous. You don't need AI for this task.
I would also add Galliford Try Holdings (LON:GFRD) to the list of shares in a clear and uninterrupted uptrend, stretching back to last July. I was lucky enough to add towards the start and have added since, although I admit it is difficult to overcome the mental inhibition to add to a holding that has risen strongly.
M&C Saatchi (LON:SAA) also displays a strong trend line. I also hold but regrettably top sliced around 185p. Tempted to add back but have yet to do so.
You can add Avon Protection (LON:AVON) strong since October 23, but not over 80 SR. Ashtead Technology Holdings (LON:AT.) is another, but looking expensive now.
The question is when to sell because they don't usually go on forever.
Great article! Thanks.
Can this methodology be turned into a successful screen?
In the Stocks on the Move book mentioned below, the author uses a "gap" of 15% to exclude a share from the list. This is frequently due to takeover activity. Is there a way in the Stocko screener to flag takeover situations? You must have the data as a flag appears at the top of the Stockreport but I can't find a way to access it in the screener.
Regrettably, I'm a contrarian. I always make the mistake of trying to outwit the trend :(
Ed thanks again for a great article. May I ask though, when you were selecting the top twenty trending graphs for each year, were you blinded to the names of the stocks?
I am fortunate to be in seven of these and four of them are core long term holdings for me....Plus500, Renew, Warpaint and RTC Group with the latter being the tiddler in the pack and probably the least known. I will therefore say a few things about why it has gained momentum in the last nine months or so...
RTC had strong interims last year in late July and all three divisions are firing well so the board reinstated the dividend at a very significant 7% yield in the final results in March. The share price kicked on but the yield is still nearly 6% and the current p/e only 7.5. The next interims are likely to be ahead of last year when released in July as they have a very large order pipeline and the comments in March suggested all is going well.
The share register is interesting as the second largest shareholder is a competitor to the main part of the group and the largest holder sadly is now a trust set up for the late chairman who died shortly after the interims last year. He has not been replaced and there is an argument that says the board needs additions or a trade bidder may decide it is easier to move in now before any additions or changes take place. The HQ overheads and listing costs equate to saving £1.3m not least the high executive remuneration which would effectively increase profits by over 50% in one swoop.
The Trust acting for the late chairman's beneficiaries may be mindful that a significant part of the estate is in one company and so wish to sell part or all of the stake. It is all an unknown but whilst the company is performing very well the momentum is likely to continue regardless as only two companies on this list are on lower p/e ratings.
The board need to appoint a new chair and non exec or my money is on a third party acting first.
Ed
In the technical analysis & charts section of Stockopedia there is the draw feature which includes the regression trend line. If this is based on the Linear Regression. (R2) methodology is there any way the R2 coefficient for a particular regression trend line could be quoted. If this were possible then it might be provide additional data support to just eyeballing the share price graph and not be as onerous as conducting a full blown linear regression analysis on Excel or similar
I think it's important to make the point that in a severe bear market the max draw down could be very high for this type of strategy. I think in Andrea's book when he back tested draw down was 50% granted it was during dot com and GFC crashes.
Personally I can not stomach 50% drawdown so following a hybrid strategy that's fits my psyche.
That should read 24% not 50%
Thanks Ed, thats great. Just a couple of points. Directors have recently taken their gains on high prices and volume has dropped a lot on a number of these. As the results of this approach are naturally looking backwards at a prolonged increase in price, does it beg the question that it’s too late to jump in here across the whole selection?
Logical David, it's a case of 'me too', I have, thanks to Stocko for providing more spare portfolios, just made up one titled Ever-Rising Risers with one k placed in each holding. This not just optimism and when Ed says "Let’s be clear, if you see a very smoothly rising price trend, like with Warpaint, you are unlikely to be an early buyer as you will wait for a correction. You’ll then end up buying too late. This is a mistake", I have to disagree because it is never too late to get on a true escalator, all it needs is to choose a nice dip to climb on. I do like, and hold, BAE Systems (LON:BA.) but at a stock rank of only 70 cannot be in Ed's list here. I also hold 4 shares in that list and unforgivingly sold 4 others a while back.
In relation to BAE Systems (LON:BA.) you are right that it is "never to late to jump on the escalator" (providing earnings keep rising). Looking back you didnt even need to wait for a dip to climb on, because BAE kept making new 52Wk Highs, so buying anytime over the last 12 months would have made a healthy profit.
This same concept applies to Warpaint London (LON:W7L) and (I hope) going forward to 7 other companies I hold on Ed's Trended Momentum list. I have used this type of Momentum selection for several years and it works particularly well in a rising market (since Nov 23), especially with good value stocks.
BAE Systems (LON:BA.) l bought back in December when there was a dip, l'm up over 30% compared to the annual rise of 34%. So even though l was 6 months late l only lost 4%.
Warpaint London (LON:W7L) has had a few minor dips, l was close to topping recently but it did not quite go low enough. It was around 370p in April, l was looking to buy around 360p.
Wow Ed,
What impressive returns you get over 12 months. I've put the 20 stocks into a portfolio called 'Ed's Uptrend Stocks' and it gives a fantastic return of 94% over 12 months. I own 5 of the shares and it puts my 72% return over 12 months to shame. I believe it would be a good idea if you revisited this method/system in, say, 6 months time.
David.
But these are the top ones now, not a year ago?
l hold 6 and have held a few others.
I thought Yu (LON:YU.) might be in there.
It is human nature to want more!
The results are great but volatile, I can't help thinking that a 20 stock portfolio is too small and stretching to 25 or 30 would be less volatile and with little loss in return.
Here is the list if you want to put it into a folio: RR., NWG, III, PLUS, CKN, CRN, RNWH, CMCX, BAKK, TKO, PAF, MER, W7L, GFM, KITW, MPAC, DWHT, SYS1, SRB, RTC
Good we have more folios now eh!?!
when will funds be added?
Ed,
A interesting interpretation of the Cai paper using high Stockrank scores to identify likely winners.
In relation to identifying the likes of Warpaint London (LON:W7L) early on, would company selection based in Absolute Price Strength 3m, rather than Absolute Price Strength 6m be an advantage, or does it need 6m of momentum data for a reliable R2 score?
The paper uses a 1 year lookback, but I find better results with a 6m lookback. The research is a bit mixed on which timeframe is the best.
There is quite a bit of evidence that there are momentum reversals on a 1 month lookback - so best to avoid very short timeframes. 3 months might work - I'll test it when I have some time.
could Stockopedia create such a screen for us to see
I have to agree as it is a conclusion I had already reached and am applying to my purchasing decisions. Chartists looking back not over 6 or 12 months but over several years are likely well ahead of the game. Sadly I didn't see the promise in Warpaint London (LON:W7L) , missed out on a few more mostly due to not having cash ready.
Ed, could you add the tickers to the article to make the mentioned shares appear in the sidebar please? It will help searching later, too.
done
Thanks!
Great stuff Ed. I've created a model portfolio using a blend of your multibagger and Andreas' approach. So far it's standing at 7.5% growth for the whole portfolio since 4th April. Defo the way forward for me
Paul - you should add your twitter/x profile image here too !
Do you have a link to the Andreas’ post as think I missed that one? Thanks
Sorry just realised you meant the book!
Hi Ed, just looking at my screens and checking which filters I would use. Looking at the 'Taking it further' section, your steps were:
Is that it? You then give a list of top trended momentum stocks - have you added a momentum filter? Or let the price trend do the work?
It's just the "Absolute Price Strength 6m".
We don't have a Trend Clarity measure in the screener - but we're rolling out a new python screener soon which will make it easier to add new measures. No promises, but hopeful that improvements will come to the data sets.
in the interim - eyeballing seems to work!
Hi Ed, I can't see something with the name Absolute Price Strength 6m. Just checking... under Momentum and Price Strength, is it Price Chg (and then choose 6m)? That sounds more Absolute than the others.
I think both work in search, but it's Price Chg via categories.
Ed, great, and consistent with the message Stockopedia has always given - just firmer on how to filter and apply what is already there. I shall be adjusting my screens.
...far above the results of annually rebalanced 90+ StockRank stocks over the same time period
Does this mean you might change the NAPS strategy from the current one to this one? It would be about the same admin time, I would imagine.
On your methodology then are you assuming you sell all the stocks at the end of each year and start afresh each year then? Thanks very interesting
Yes - it's an equal weighted portfolio fully rebalanced each year. Transaction costs aren't included but neither are dividends. As these are mostly high ranking mid-caps, the transaction costs are fairly low. Obviously stamp duty needs considered too. Dividends tend to cover the transaction costs.
For the set of stocks shared, Takedo mines has a nasty 8% spread and 2 others are in the 3% range. The average spread is 1.72%, while the average yield is 2.2%. Adding stamp duty, these things net off.
I've just run this for the US universe (Nasdaq and NYSE) for 90+ ranked stocks with a minimum £50m cap.
The data starts a little later, in July 2014. That's about 9.8 years.
215% cumulative return at a 12.4% annualised rate. That beats the S&P 500 which has returned 169% in the same timeframe.
Thanks Ed - are you able to provide the current US portfolio if we are US subscribers? Thanks
These are the US stocks I have currently qualifying - with a £50m lowest cap, and 90+ ranking.
PHINPHINIA (NYQ:PHIN) I have pasted a Silver Ring Value Partners justification of their May PHIN purchase decision in the general postings section.
Ed, I think this is terrific! Do we know what the reason is why small caps are under represented? And is there a way that we might be able to generate the list for generate ourselves in future?
I'm not sure why small caps are under-represented. Perhaps because you tend to see clearer trends in mid caps? Over all the timeframes, the median market cap has been £355m, with the mean at £4.6bn.
Yeah, personally I think the high volatility of small caps explains it - not generally going to get an R2 close to 1.
I wonder whether you could correlate price performance to beta value rather than to R2 trend clarity? Wouldn't be surprised if the correlation to beta was too noisy though.
Great article.
"Calculate the trend clarity for each. (Linear regression → R2)"
How do we calculate the trend clarity, or is it available within Stocko data?
Ed,
I enjoyed the article too but, like turbo - please could you explain how to do the Linear Regression - R2 calculation. I am unsure what data to feed into Excel.
Many thanks
Richard
Hi Richard, Sounds like hard work - I'm going to follow Ed's advice: You don’t need to do a linear regression - just eyeball the chart. Much easier!
Edit: ... although having a filter to add to a screen, or a column to add to a folio would be even easier...
Thanks Indie,
Will do.
Richard
I think taking image of chart into something like word and drawing a diagonal line should work. Im not saying this to take the mick as having a record of the original chart and updating it as time goes would be useful to record the original thinking.
EDIT - Stocko chart facility can add a line - easiest to do this and take image of the result, if I could figure out how to post a link I would.
I bought Vertiv Holdings Co (NYQ:VRT) on Nasdaq last week. It has quadrupled in the past year, outperforming NVIDIA (NSQ:NVDA) , and I hope that I didn't get in too late. They supply infrastructure and cooling for data centres, so should be able to benefit from both the AI market and the cloud computing market.
Excellent inspiration for further reflection. Thank you, Ed. And the book you recommend is available to Kindle Unlimited subscribers,
An underrated book worth reading - https://www.amazon.co.uk/Stock...
It has a similar strategy (in that it uses R2 to quantify quality of the trend) - it clearly sets out a trading strategy and what is more it's back tested 2000-2010 (US market). Worth checking out.
Yes it's excellent. Also uses an index trend filter, which I'm a big advocate of. I like to use the AIM All Share as it is the best UK barometer of "animal spirits". When it's "risk on" and uptrending it has terrific performance. We are "risk on" right now.
Interesting. And thanks for the book recommendation Ed, sounds right up my street.