Gaining an edge investing in commodity stocks

Over the past few weeks, Keelan has been looking at the mining sector. Commodity stocks can be like Marmite; investors either love them or hate them, and for good reasons. They are usually geared plays on the underlying commodities, meaning that the potential to generate outsized returns exists. Companies where the primary assets are in development or even the exploration phase can be even more geared to the commodity, and the management's skill in developing and financing the project. However, such ventures are risky, even before you add in overoptimistic or even promotional management teams. The majority of pre-production mining stocks generate poor returns for long-term investors. After all, Mark Twain defined a mine as a hole with a liar standing at the top!
Personally, I don't get involved with any company that is pre-production, in the same way that loss-making technology companies don't interest me. There are simply too many things that can go wrong and blow an investment case out of the water. However, I believe producing commodity stocks may interest the more adventurous value investor. The reason is that it is possible to gain an edge over the market in this space, for two reasons:
Edge 1 - The Capital Market Cycle
As Keelan has discussed in his articles, commodity pricing is a function of supply and demand. Companies and investors can generate very high profits if they spot where demand is likely to exceed supply for a commodity. For example, the following chart from Kenmare Resources (LON:KMR) , may indicate that pricing for Heavy Mineral Sands may remain elevated for many years:
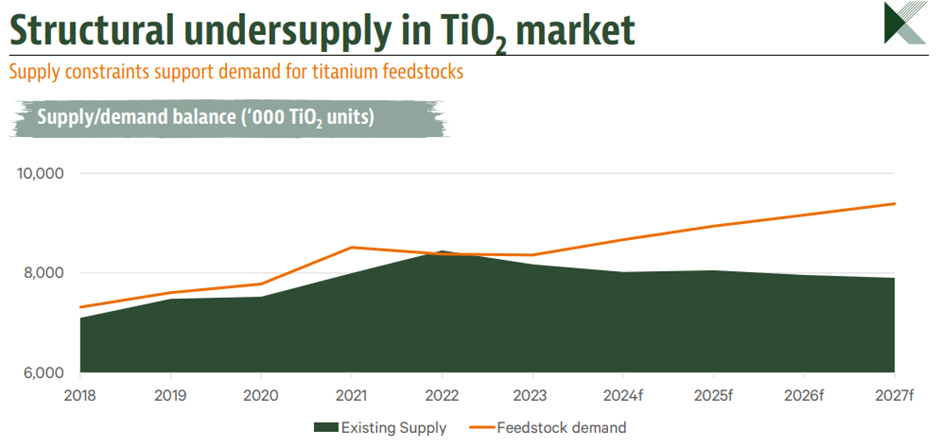
The reason is that mines take many years to develop. For many products, a demand increase is met by a rapid production increase. A rise in commodity prices will encourage existing companies and new investors to put capital into the sector. However, those new mines won't produce that commodity any time soon. It may be up to a decade before they are producers. The high prices can exist for many years, especially when there is no easy substitute for the commodity and the existing mine capacity is maxed out. Eventually, prices will rise so much that many new projects become viable, a massive amount of capital will flow into the sector, and there will be an oversupply, and prices will return to low levels. At this point, high-cost producers will cease production, close mines and eventually set the sector up for future boom years. This is known as the Capital Market Cycle. It may seem daft that so many projects get the green light at peak prices and so few at the nadir, but this is how the incentives and market dynamics have played out for years.
Investors who spot the cycle and act countercyclically can do very well from commodity stocks. The key is to find existing producers of a commodity facing increasing demand but where no new mines have been developed over the last few years. In such cases, a supply-demand imbalance is likely to develop that will benefit companies that are existing producers. Those supranormal profits can last for years.
Edge 2 - Brokers are slow to update their models
As well as playing long-term cycles, mining stocks can provide shorter-term opportunities for investors. Many mining companies produce detailed production reports, and the prices of the commodities they sell have published market prices. Hence, it is often possible to roughly estimate the earnings a company will generate before it releases the figures. It may be tempting to think that this is all in the price. However, the reality is that investors can gain a significant advantage over the market by doing this because most investors simply don't do the work. Instead, they rely on brokers to model the company for them. As Keelan alluded to in his last article, the problem is that brokers don't update their models anywhere near frequently enough to reflect the wild swings of commodity markets. They are often reactive to news rather than proactive in updating investors.
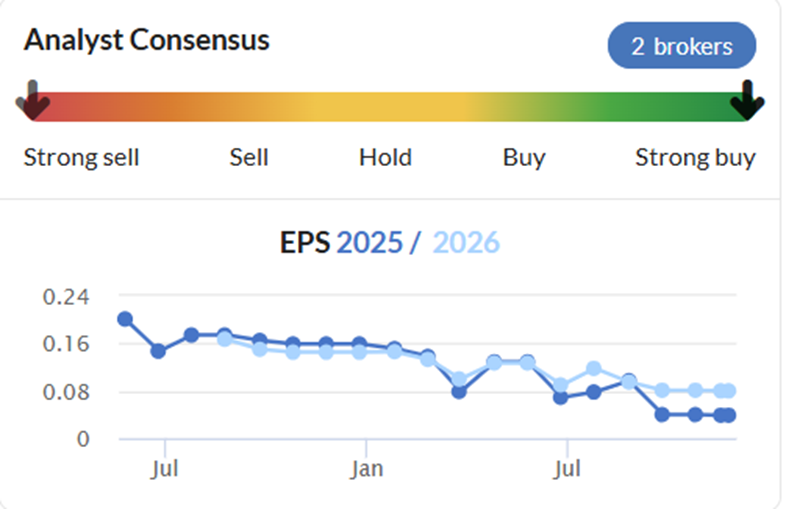
In his last article, Keelan looked at the platinum group metals. Here, investor favourite, Sylvania Platinum (LON:SLP) , provides a good example. The broker consensus for EPS has been particularly volatile over the last year:
Here is how the 2024 forecasts looked prior to the September FY results:
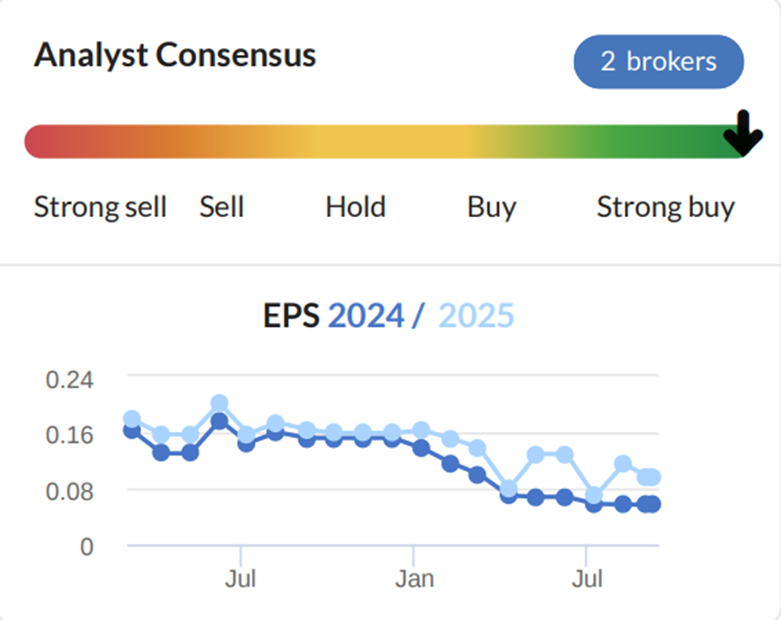
Sylvania is an excellent example because its quarterly reporting is so detailed. They even give net profit figures quarterly. It is also instructive as to just how inefficient the market can be. Not only would these forecasts look wildly optimistic (normalised EPS came in at just 2.65c for FY24), but the profitability should have been easily calculated since their Q4 report was released on 31st July by anyone willing to add up the quarterly figures. However, the results do appear to have surprised investors, as the 20% share price drop on high volume attests:
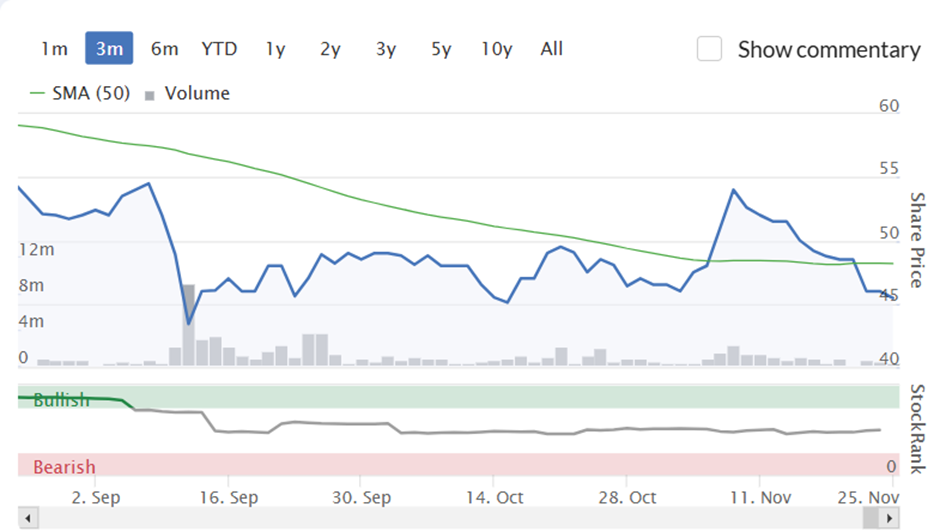
To be fair, it may be that the lack of dividends after a strong couple of years may have disappointed some investors, which was new news in the full-year results:
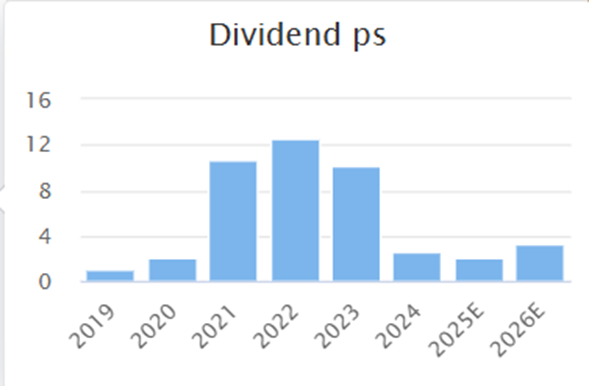
However, the writing was on the wall for this since the reduced interim payout:
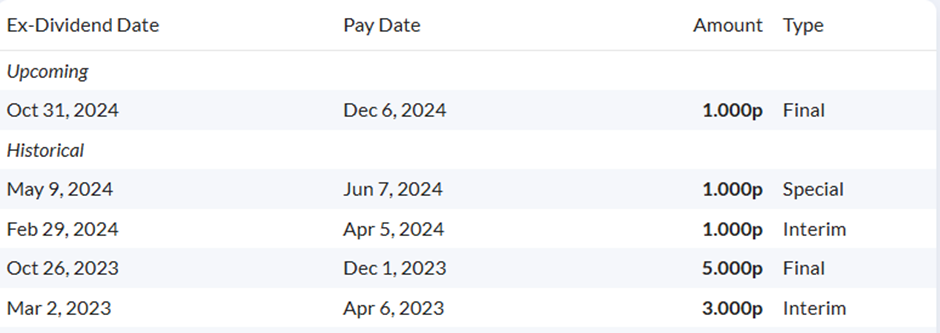
Since the level of dividend payout does not affect the fundamental value of a business, this should not have been a factor in the share price fall. Instead, it seems some investors were slow to price known information. However, even when earnings are not already known, creating a model can give an edge over other market participants.
Creating a model
While every resource stock is different, the process of creating a model can be quite similar. Again, I will use Sylvania Platinum (LON:SLP) as a worked example:
Step 1 – Production Metrics
Most companies provide production metrics that give an understanding of what is going on within the production process. Here is what Sylvania gave in the 25Q1 results:
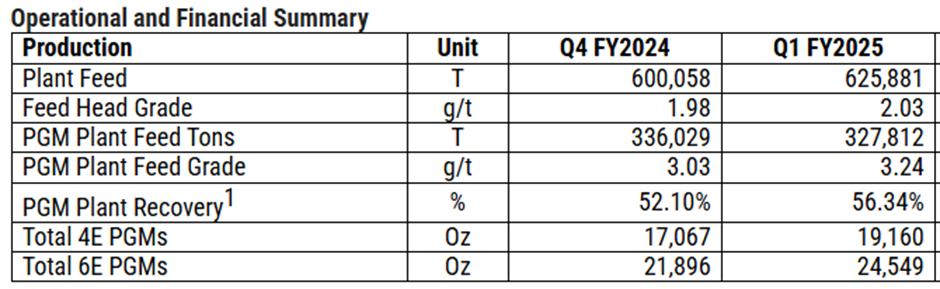
I tend to put these into a spreadsheet and make a couple of further calculations that may be interesting. For example, here I calculate the percentage of product that is byproducts:
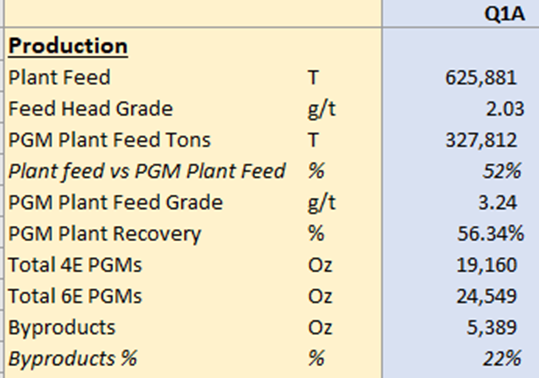
Such measures are helpful because modelling is either to better understand the inputs to profitability or to predict business performance before results are published. Unless the company has given specific guidance, I assume that such measures will remain static when modelling future quarters. The best guess for the future is usually the recent past. If investors model a company long enough, they can see long trends more easily or spot outliers. For example, here is the Byproducts % for Sylvania since I've been tracking it:
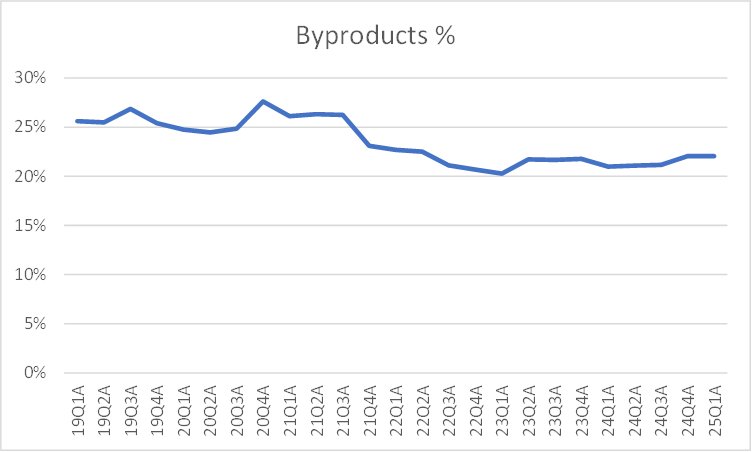
Although the long-term trend is down, this has stabilised in the last few years, and it makes sense to assume that future quarters will be similar to the 22% of 25Q1.
Step 2 – Revenue
For most commodity stocks, revenue is simply the production volume multiplied by the average price received. Helpfully, Sylvania give us these figures:
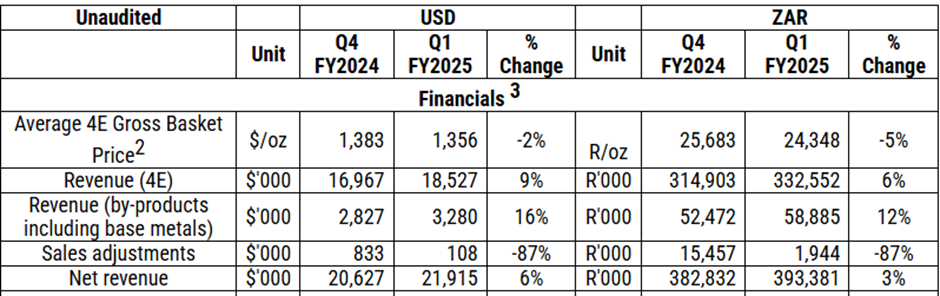
There are a few complications:
- The first is that they report in two currencies. I prefer to use the South African Rand since their costs are largely in Rand, which I can convert to dollars or pounds sterling at the end of my modelling process.
- Secondly, they only report a basket price for their four main products, so-called 4E – Platinum, Palladium, Rhodium and Gold. While the price/oz of byproducts does vary, it is relatively stable from quarter to quarter, so assuming that it remains the same is probably a fair assumption.
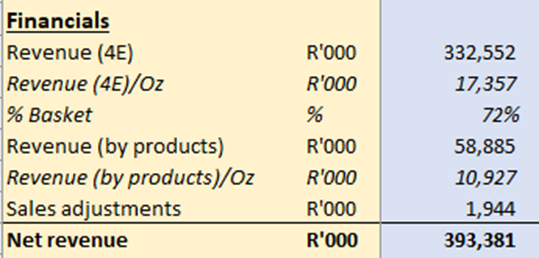
- Thirdly, a simple calculation shows that they don't receive the revenue that their "4E Gross Basket Price" suggests. The company produces a concentrate that requires further processing to extract and refine the metal. However, they receive a fairly consistent proportion of this basket price, somewhere in the low 70's per cent. So again, this can be easily modelled:
- Finally, the company also reports a sales adjustments figure. This represents that they get paid after refining and the price can vary over time. I'm not sure exactly how this is calculated. However, historically, it has been roughly correlated to the price change since the previous quarter. This is what I get when I graph this:
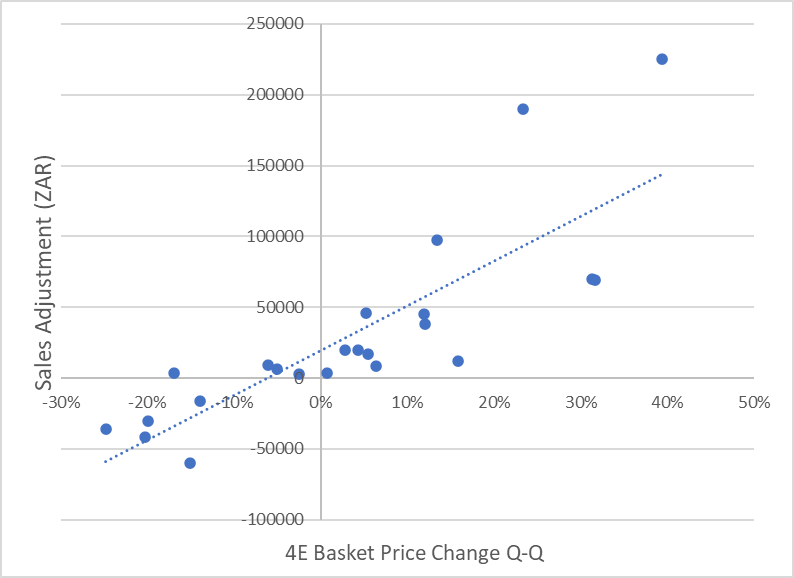
- I can use this to estimate values for a future quarter, although those in favour of a simple model may want to just assume zero for periods without significant price volatility.
Step 3 – Costs
Different companies will have different cost structures. Some may have variable costs that vary with production. However, for Sylvania, I have found that production costs are fairly flat, apart from some inflationary increases. For indirect costs, a bit of business knowledge will probably be necessary. With Sylvania, I know they have to pay royalties at 7% of revenue, so although they don't break this out, I do:
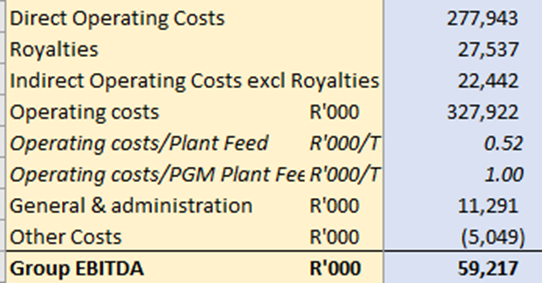
Everything else comes from their detailed quarterly report. However, in order to get the numbers to add up, a few years ago, I had to add in another cost line, something the company has never revealed what is in there. Strangely, this can go negative as well as positive. In recent times, the numbers have been negligible, so I largely ignore these costs.
Step 4 – Interest and Taxes
Every company will report different figures. Sylvania is fairly unique in that it gives us quarterly EBITDA and net profit, and we have to infer interest and taxes. I tend to take interest as an estimate of what it was in the last half-year and divide it by two. However, in this case, they give us the rough figures:
A tax refund of $1.8 million was received during the Quarter from the South African Revenue Services relating to the FY2024 tax period. Surplus cash invested in both ZAR and USD earned interest income amounting to $1.7 million.
The timing of tax payments can lead to some quite variable tax rates, but this tends to even out over time. Here are my estimates for the last quarter, having converted to Rand:
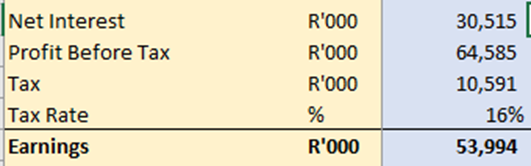
Step 5 – Free Cash Flow
While the company don't calculate free cash flow, they give us both the cash balance and the capex for the quarter:
The capital spent for the Group increased by 47% to $7.8 million (Q4 FY2024 $5.3 million), comprising $4.8 million on the attributable capital on the Thaba JV, $2.8 million on stay in business and improvement capital and a further $0.2 million on exploration projects.
This means I can calculate the FCF both with and without working capital movements:
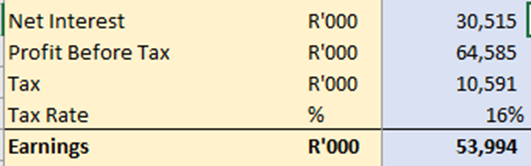
Step 6 – Modelling future values
Once I understand production metrics and can see how these flow through to profits and cash flow, I can use this to model future values. Like any prediction, it is highly sensitive to the assumptions made. However, having a model has the benefit of allowing investors to see the impact of any changes and test the assumptions of others. For example, this process would have revealed that brokers' forecasts for Sylvania last year had PGM price predictions that were overly optimistic based on the actual trajectory seen.
Sylvania has a history of hitting their production targets in recent years, so I am happy to trust that this remains the best indication of their production:
Annual production target of 73,000 to 76,000 4E PGM ounces for FY2025 remains unchanged;
Those who have a better idea of how the production will be phased may want to adapt this, but I simply take the midpoint of the guidance, split that between the remaining quarters, and scale up the total production by using the last quarter's percentage of byproducts:

The most important part of the model is updating it for changes in commodity price. For PGMs, various sites provide current and historical pricing. I tend to use Johnson Matthey, but it really doesn't matter as long as an investor is consistent. By using these price tables and the split between the different metals, as provided by the company:
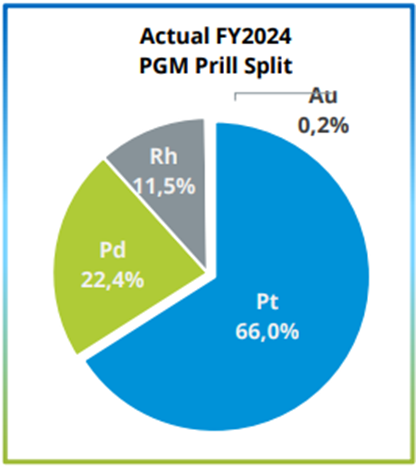
For the current quarter, I take the average price so far. For future quarters, I take the current spot price. Looking further forward, investors can either make their own price assumptions or take the spot price. Sylvania themselves show that brokers are modelling a strong recovery in PGM pricing:
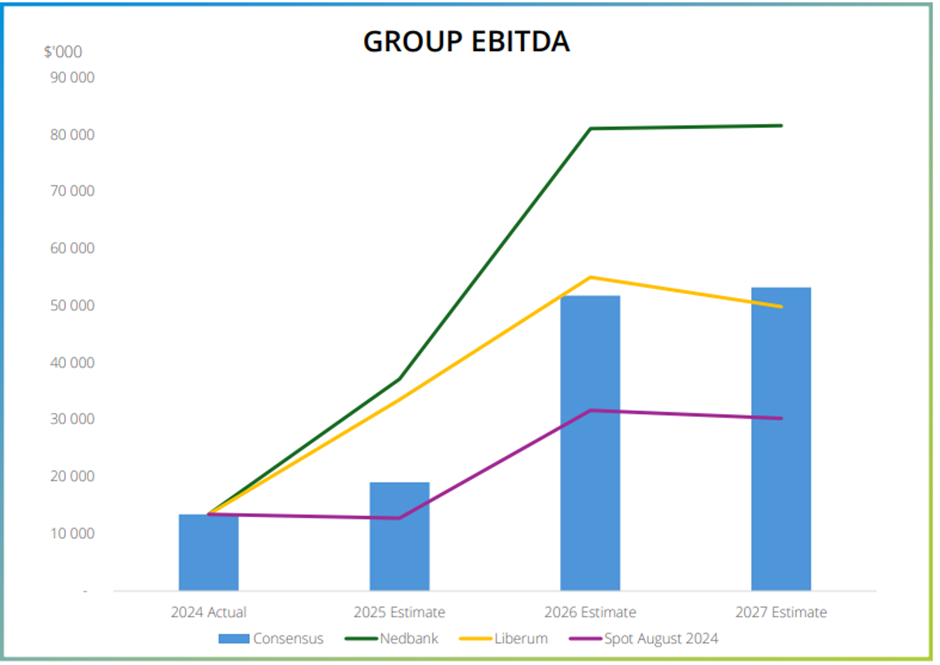
However, they have been wrong on this recovery so far!
These price assumptions give me my revenue estimates:
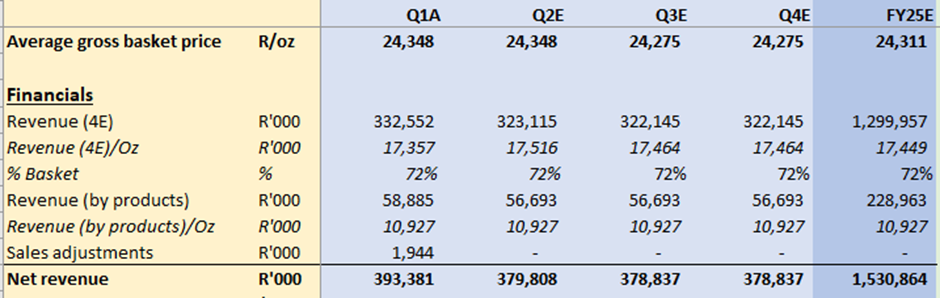
Then, by making some basic cost assumptions, i.e. same as Q1, these flow through to EBITDA, EBIT and earnings estimates:
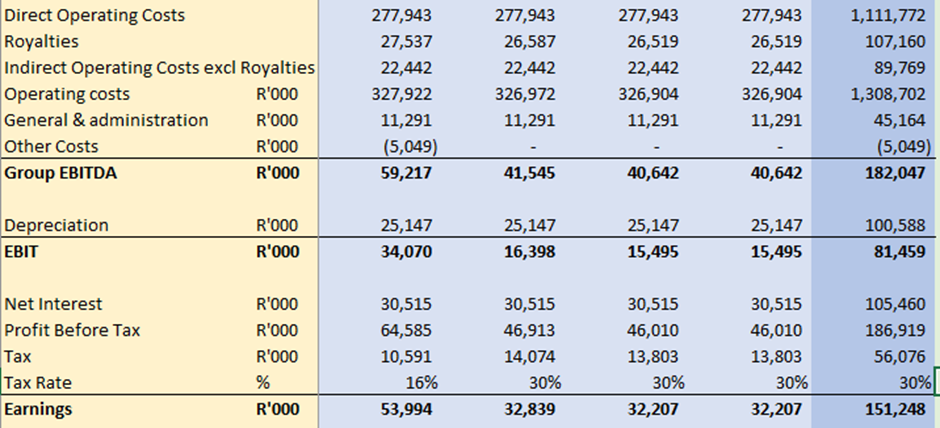
Converting this to GBP using current spot rates and the number of shares in issue, I get my estimate of EPS if the PGM prices remain at current levels:

The Stockopedia consensus is currently USD 3.9c, which, based on spot FX rates, works out to be 3.12p. This doesn't mean that my estimate is correct, but I can track the production performance and PGM pricing during the coming quarters to see if there is a sufficient improvement for the company to hit those forecasts. By doing so, investors can be ahead of those who rely solely on the brokers to model the outcome.
Modelling Sylvania for FY26 will require more work. They have a JV coming on stream that includes Chrome production. However, the principles will be the same. Production and pricing will determine revenue. Guidance and recent performance will likely determine costs. Profit will be the difference between the two.
This example shows the typical steps an investor may want to take to model this and similar companies in the future to gain an edge over other market participants. Happy modelling!
Disclaimer
This is not financial advice. Our content is intended to be used and must be used for information and education purposes only. Please read our disclaimer and terms and conditions to understand our obligations.
12 comments
Hi Mark,
Your workings for step 4 and 5 are the same graphic. It would be good to see the correct graphic for step 5 ;)
Hi Makaira,
Sorry this wasn't clear, but I meant consensus EPS. For me, the actual word they use has so little use that I filter it out completely from my process and don't even look at that part. Relying on broker EPS forecasts can be problematic as they tend to be massively optimistic most of the time, the rating system they use is even worse! Ed explains why here: https://www.stockopedia.com/bl... Tl;Dr: stocks rated "Buy" by brokers are the worst performing of all rated stocks.
Cheers,
Mark
Thanks, Mark - totally understand and will try to ignore brokers ratings - especially "Buy" ratings - from now on. On the other hand, I guess that brokers "Sell" ratings might be more reliable?!
Good analysis but needs coupled to some macro thinking about where the market is headed for PGMs. e.g. ICE vehicle bans mean no new catalytic convertors which is by far the biggest market for platinum. Hence why PGM price is tailing off and hence why they are making efforts to move into chrome. You need to form a view over where these markets are headed over next 3 to 5 years as well as crunching current operational data.
ICE ban is only in certain countries and many of those are extending the years before the ban. What about countries like India, most of SE Asia, South America, car ownership is growing there. People are not buying EV, hence all the problems for car manufacturers and meeting EV sales targets.
Hi Mark, regarding Sylvania Platinum (LON:SLP) and your - possibly misleading - comment that the "broker consensus for EPS has been particularly volatile over the last year" if you click on the blue "2 brokers" button it does not show any broker consensus other than "Strong Buy". Furthermore, if you hover over the "Strong sell" arrow it shows "3 months ago", but if you click on the "PRINT" button and look up the history the broker consensus has been consistently "Strong Buy" over the last year until 20 October when the misleading "Strong sell" arrow first appeared. I queried this anomaly one month ago and had this reply from Keelan: "We have taken a closer look at the broker recommendation section and can see that this [Strong sell] arrow appears to be a bug. I have passed on this information to the developers so that we can work on a fix for this." This misleading extra "Strong sell" arrow also appears on your screens for SQZ, HICL, POLN, RECI and goodness knows how many others and this apparent bug has obviously not yet been fixed.
Yes l have noticed this strong sell on numerous stocks, l thought it was a fault on the Stockreport.
I reported some other issue, that has been passed on but heard nothing since, despite chasing it up. I have several other related issues as well.
Seriously good food for thought. Sylvania Platinum (LON:SLP) was 'hot' for some time, but now a bargepole imo - royalties and 'other costs' will always plague African investments, as well as port closures, banditry and general whatever - sad, so much potential but lets blame the imperialists who died long ago.
Loved the "countercyclically" comment - we all need to watch the crowd (herd) and do the opposite. It's timing and nobody said this was easy.
Also - "the best guess for the future is the recent past" - as a chartist that is a 'bone to a dog'.
Hi Mark, a bit of a tangent to commodities, but a year ago I took your historic high yield portfolio and created a folio of a selection to see if their yields had been maintained. They hadn't. But interestingly that selection is currently soaring when compared to the FTSE. It might be worth a revisit.....are the companies that cut or reduced the dividends now coming back strong? Will dividends be reintroduced or increased and can they continue to outperform the market?
Hi Rob,
Have you read the article I wrote on how to react to a dividend cut, and Alex’s follow up on how to avoid cutters? There’s plenty in those on the topic. Simply put, dividend cutters tend to underperform, dividend cancellers tend to outperform, after the cut. Both underperform in the run up to the cut/cancellation. That may well be the effect you are seeing here.
cheers,
Mark
Thank you Mark. Very useful
Excellent work!