How I use the StockReport to gain an investing edge

While I find the screening tools, portfolios and other features that Stockopedia provides incredibly useful, most of my time on the site is spent looking at the StockReports of individual companies. There is a reason for this; it gives me an investing edge.
One of the challenges of investing in the modern age is the sheer amount of information available to investors. This is completely different from when some of the best-known investors, such as Benjamin Graham, were forging careers. In the past, access to information was a problem, and investors had to register to receive annual reports in the post or pay for a published book that summarised the accounts. Knowledge was power. In the age of the internet and social media, ideas come to us thick and fast. Even for full-time investors, there is a limit to the number of companies that one can research. It is, therefore, vital that investors are able to quickly determine whether a company is worthy of further research. Today, the ability to quickly parse knowledge is power, and that is what the StockReport gives me.
My approach
Whether ideas are generated by one of my Stockopedia Stock Screens, mentioned by a friend, or the company is presenting at an investor event, my approach tends to be the same:
Valuation
I tend to look for cheap stocks. It can be tempting to just look at the Value Rank, which is an amalgamation of many different metrics. However, I think this approach is probably too simple. The typical value opportunities are split into two types: asset plays and earnings ones.
When investing in a company that is cheap on assets, I often look at that metric alone. For example, when I look at the StockReport of Camellia (LON:CAM) , most of the metrics are terrible:
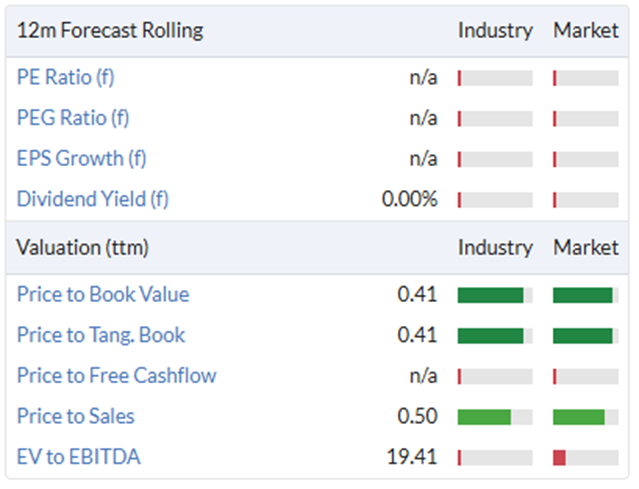
However, the Price to Tangible Book is among the lowest on the market. For me, this makes the company interesting to research further. At this point, the rest of the StockReport isn't necessarily helpful. Instead, I will want to look at what those assets are and get an idea of how committed management is to making those assets productive again (or selling them to someone who will.) However, the StockReport has already done its job, flagging an interesting idea for further research.
For most stocks, I am more interested in the earnings of the business and, in particular, the Price Earnings Ratio. However, I don't look at this in isolation. These types of ratios are shortcuts for more complex valuation methods. The tendency to generate above-average returns from buying stocks on low P/E multiples is because growth tends to be mean-reverting. This means that the future growth rate of earnings matters. For example, in my recent Smallcap Siliness article, I didn't include Braemar (LON:BMS) as one of the cheap stocks despite a lowly P/E:
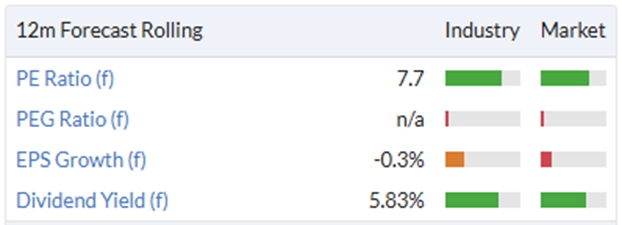
The reality is that this rating looks deserved based on the historical and predicted revenue and EPS:
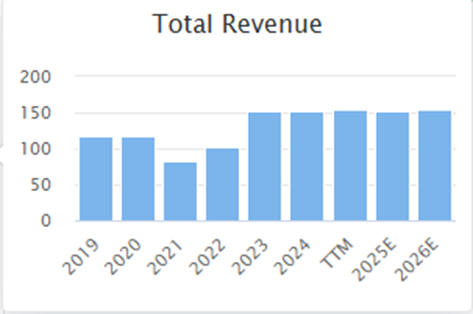
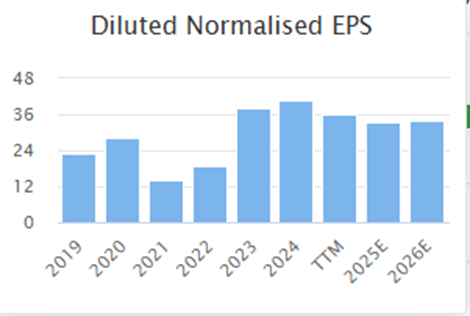
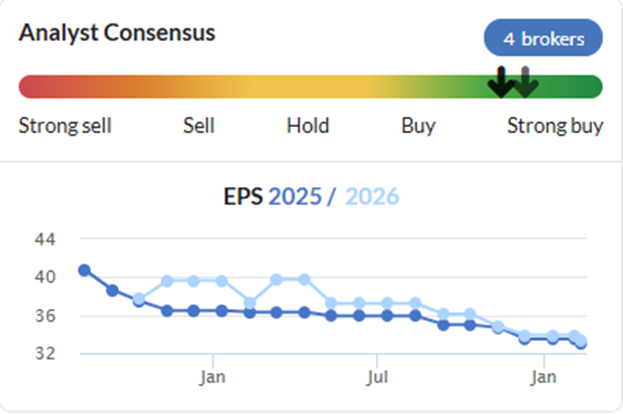
I also tend to look at the recent broker trends to see how much confidence I would place in this forward P/E proving correct. In this case, not much:
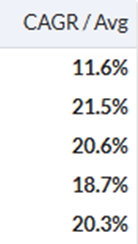
Instead, I like to look for something like Billington Holdings (LON:BILN) where the Sales and EPS CAGR are good but perhaps lumpy, and hence pass other investors by:
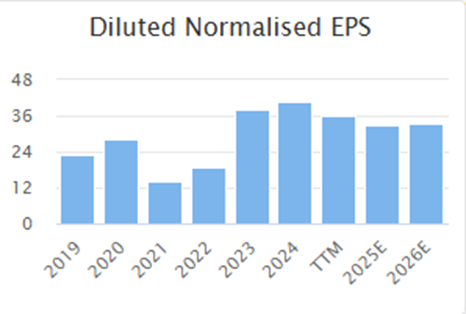
The forecast growth may also look pedestrian here:
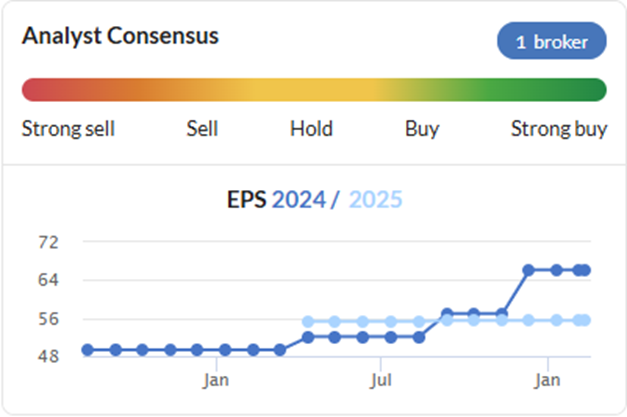
But the broker trend shows continuing upgrades, suggesting conservatism in guiding the brokers:
This means that I think this sort of stock may be worthy of further research despite having a slightly higher P/E than Braemar (LON:BMS) :

Some investors find the PEG ratio useful for comparing the P/E to EPS growth. For example, I picked Water Intelligence (LON:WATR) as one of my 12 stocks of Christmas due to its long-term sales growth rates. Here, the forecast P/E is higher but still below its forecast EPS growth rate, giving a PEG ratio below one:
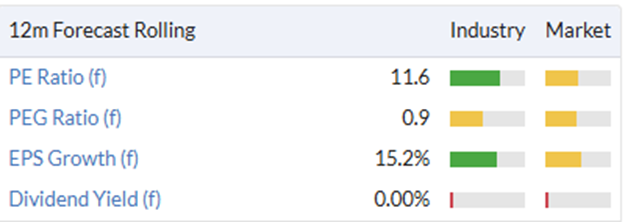
In general, I don't pay much attention to the PEG ratio in isolation. It is a point-in-time measurement based on current broker forecasts. Instead, I tend to look at the longer-term trends and compare them to the P/E. For example, by looking at the revenue CAGR or graph on the Stockreport:
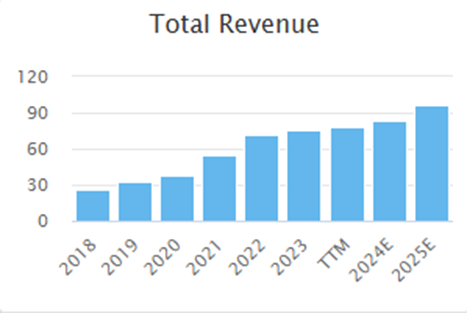
One other aspect to consider is the capital structure of the business. Some companies may appear very cheap on a P/E basis, but it is because they have a lot of debt. For example, Mission (LON:TMG) had more than its current market cap in net debt at the last balance sheet date:
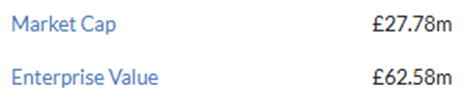
I often mentally adjust the P/E to take this into account. However, it is worth bearing in mind that this figure will include lease liabilities. Whether investors include this or not is dependent on their view of these. I also look at the EV/EBITDA figure, which will include net debt/cash in the calculation. This isn't perfect, as the number on the StockReport is the historical TTM figure. This means that for Billington Holdings (LON:BILN) , it picks up the exceptionally strong FY23 trading:

And for Mission (LON:TMG) , it reflects their loss-making past:

However, as an initial check, this picks up the salient points, which is that Billington Holdings (LON:BILN) is cheaper than it first appears due to its significant cash balance, and in contrast, Mission (LON:TMG) is significantly more expensive and risky.
Safety
Mission (LON:TMG) highlights the next thing I look at on the StockReport. How safe a stock is. This involves looking at the following metrics:
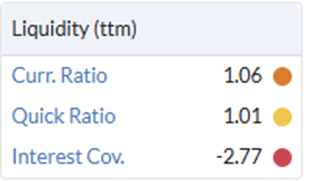
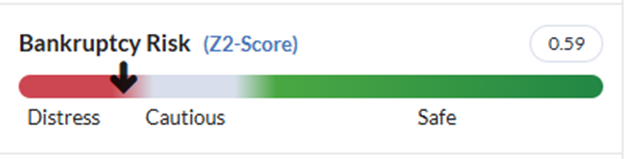
I've previously written a detailed description of what these ratios mean in an article called Gearing up to fail, so I won't repeat myself here. I think it is important that investors have an understanding of what these ratios mean and how they may vary between different types of businesses. While it may be a blunter tool, those who don't feel confident in this may want to simply look at the Z-Score and strike companies that are rated as in distress from their watchlist:
One other metric that is worth considering is the M-Score. This is based on a statistical model that aims to assess known risk factors for companies that manipulate their earnings. Ideally, investors want to avoid companies at risk of this. However, again, it is a blunt tool. For example, it flags Billington Holdings (LON:BILN) as a potential manipulator:

This seems unlikely to me. The good news is that investors can click on the M-Score to see where a company fails. In this case:
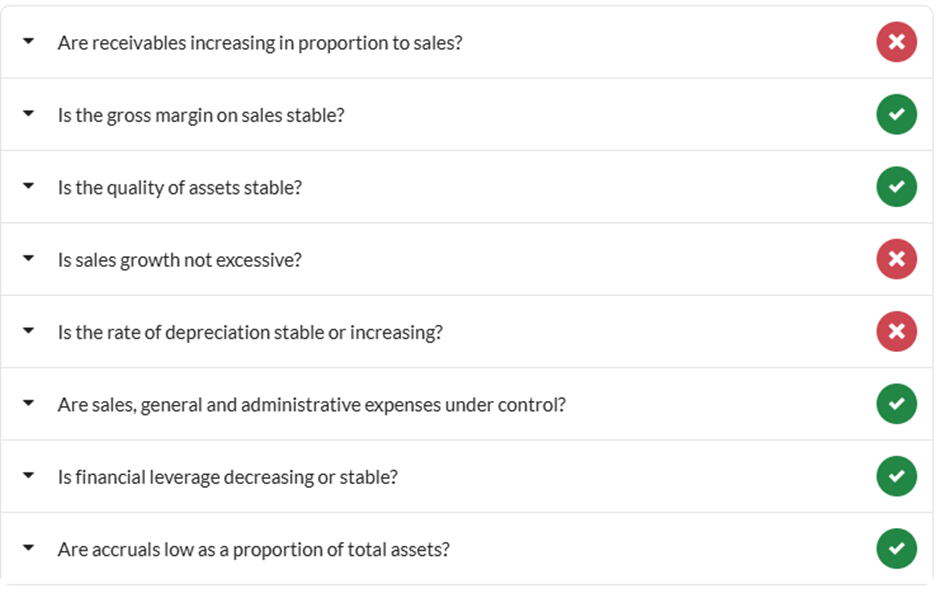
Investors can go through each one and see if there is a reasonable explanation (in this case, I think there is) or whether this is a stock to avoid. More cautious investors can simply play the odds and avoid any company's failures as potential manipulators.
Quality
What makes a quality stock can be open to debate amongst investors, and it is tempting to just defer to the Quality Rank. However, this has a heavy weighting towards the Piotroski F-Score, which can make this also a Momentum measure. Personally, I believe that two key components create a good quality business: the ability to generate free cash flow and the ability to re-invest that cash flow into growth that creates shareholder value.
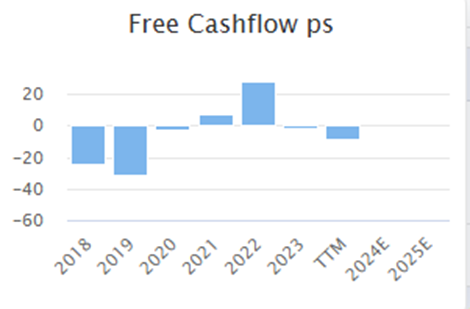
Businesses go through investment cycles. This means that in any given year, the free cash flow may be negative. However, if a business has to continually invest significant amounts of capital to grow, it probably isn't a great business. I tend to look for most years to have positive free cash flow. For example, Zotefoams (LON:ZTF) was a popular stock for some time, but its free cash flow has been very lumpy:
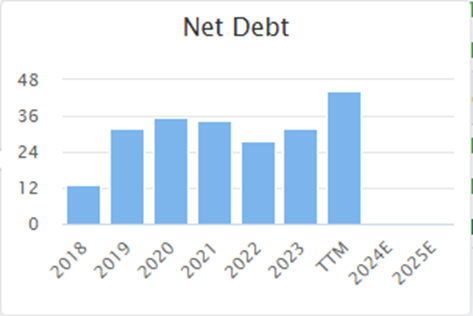
I also look at the trend in net debt. Again, for Zotefoams (LON:ZTF) , this hasn't been particularly encouraging:
The other thing I look for is whether the Return on Equity is above the cost of equity. Again, this may vary from year to year, and I don't judge a company with one or two poor years too severely. However, Zotefoams (LON:ZTF) gives an example of a business where this has been consistently low:
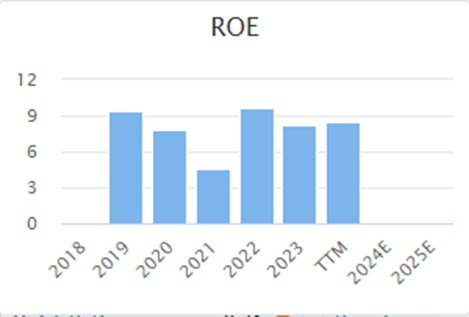
I don't rule out this type of business altogether, but I wouldn't pay a particularly high multiple for it. A consistently low ROE can mean a business that has overpaid for historical acquisitions, such as RWS Holdings (LON:RWS) . However, here, the forward P/E is around 7. Indeed, Zotefoams (LON:ZTF) may finally start to be an interesting investment proposition. They have a new management team that seems to be more focused on generating shareholder value rather than growing at any cost. They have shut down their loss-making venture, and this is showing signs of improving earnings; hence, the future ROE should be more acceptable. Following share price falls and the positive impact of cost-cutting on earnings, the forward P/E is a more reasonable 10x.
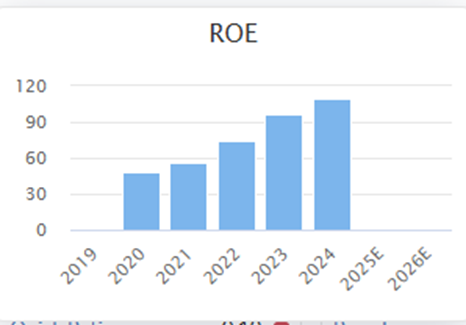
In contrast, Dunelm (LON:DNLM) is the sort of business that consistently generates excellent returns on equity:
Plus, consistently good free cash flow:
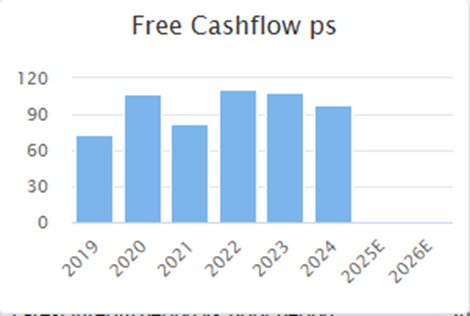
I wouldn't exclude this business from further analysis if it were on an above-average multiple, as it doesn't require much capital to grow.
While I rarely focus too closely on dividend payout at this stage, this can be one area where a low yield in a relatively mature company is a warning sign that it may be a poor business. Again, comparing these two stocks highlights the difference:
Zotefoams (LON:ZTF)

Dunelm (LON:DNLM)

Momentum
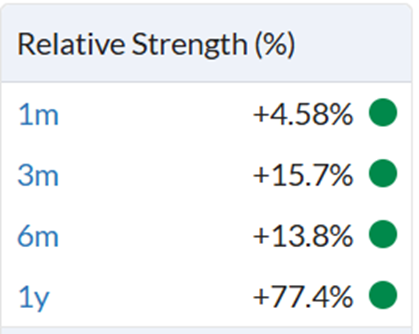
While relying too heavily on Momentum doesn't tend to fit with my strategy, there is no denying the academic evidence. The best-performing stocks of the previous year or 6 months tend to keep doing well. Strong performers over very short periods, such as 1 month, or very long periods (3-5 years) tend to mean revert. The good news is that all of these metrics are easily visible on the StockReport:
The other factor that may indicate outperformance is the one that Ed has been writing about recently: the tendency for stocks that exceed expectations to keep beating them. The broker trend graph visually shows if these upgrades keep happening. With an analyst's consensus that looks like this, it is no surprise that International Consolidated Airlines SA (LON:IAG) has been one of the best-performing UK large caps over the last year:
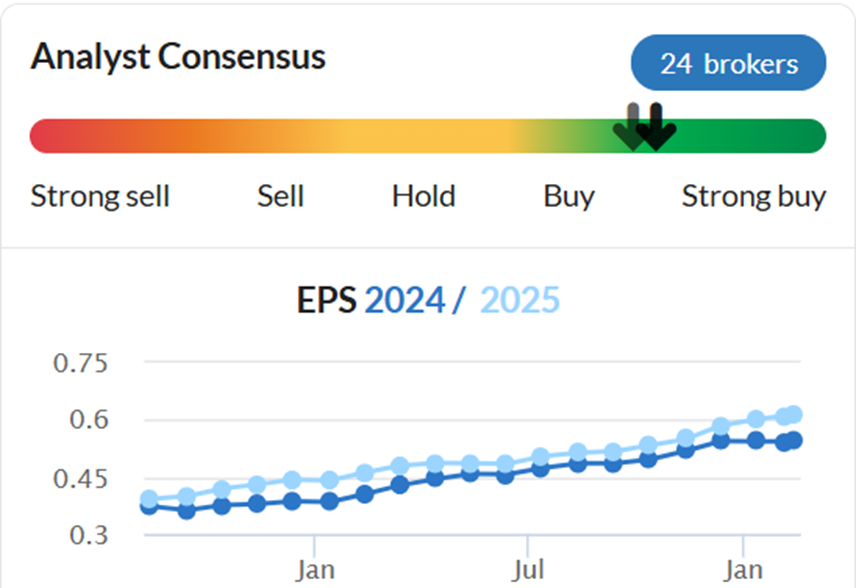
Investors may find they generate better results by sticking to stocks with positive momentum characteristics, either in price or broker forecasts. Using the StockReport, they can easily rule out the momentum losers.
Playing the odds
Of course, this is only the start of my research process before investing. The criticism of this approach will always be that filtering out stocks based on these simple criteria will miss some hidden gems. That is undoubtedly true, but the benefits easily outweigh the risks of missing an occasional unexpected winner. It may seem strange to view the ability to filter out unsuitable stocks as giving an edge over the market, but I believe that is exactly what the StockReport gives me. It allows me to focus my energy on researching the most likely candidates to be outperformers and ignoring the noise of the crowd. When it comes to investor events, I know I'm a sucker for a story, so I simply don't attend presentations from companies where the numbers on the StockReport don't meet my investment criteria.
[Disclosure: Mark owns shares in Billington Holdings (LON:BILN) Camellia (LON:CAM) RWS Holdings (LON:RWS) ]
Disclaimer
This is not financial advice. Our content is intended to be used and must be used for information and education purposes only. Please read our disclaimer and terms and conditions to understand our obligations.
15 comments
Can’t help noticing that you have called Zotefoams splendidly badly
Most of us make a poor call on one in three or four of our buys, it’s how you manage those decisions that make the difference. I believe PS late of this parish but now on a soap box elsewhere used to be quite cool about not scoring 180 every time!
Thanks Mark very helpful and some useful reminders and links to previous articles and ideas. You mentioned one of the major themes that Stocko has been highlighting for some time now and that’s how co.s which keep beating raised expectations are top quality performers going forward, this would categorically apply to Filtronic (LON:FTC) yet, Roland in particular seems very cagey on them. Doesn’t really make sense to me, is there some kind of regret at missing the move going on or a non desire to go bullish at the top? They’ve produced “ahead of expectations” at least three times in the past 6 weeks I think, seems like the archetypal buy to me! Obviously sceptics might say client concentration, but that’s not the point, surely it’s a massive boon to have the market leader by miles as their main customer. Plus worrying about that is like worrying about International Consolidated Airlines SA (LON:IAG) being hit by COVID again, it may happen of course but you cant avoid buying them for fear of it. Cheers
For someone with limited time, I found this most instructive as a means of finding quality companies at a reasonable price. Thank you for this
Excellent article that encompasses much of the contrarian strategy of David Dreman and the practical common sense of Lord Lee. Income/Value investing remains the only form of investing that makes any sense to me.
Personally i find that the stock ranks are great for avoiding losers. Maybe more important than finding winners.
As Buffett said, rule 1 is to avoid losing money and rule 2 is to not to forget rule 1.
Did not help avoid IG Design (LON:IGR) which was one of the top ranked stocks before it crashed.
This is great Mark, easily applicable knowledge, very useful. Thanks, David.
Thanks for the article Mark. I've found myself that stocks that pop on my screen are the ones that worked around 75% of the time, while from stocks picked from other sources have been stinkers 90% of the time. I find the stock reports a fantastic tool to get the most interesting ideas for further research and so far it's been a success. It isn't productive to spend a few hours researching a company without checking the stock ranks just to pick a looser, better to invest this time on researching something with potential
Great again thanks Mark. And a reminder that you don't have to own every success story. A basket of above-average stocks will do the job nicely!! DD
Very useful information. Thanks
Hello Mark, does Billington Holdings (LON:BILN) have any exposure to US steel tariffs, do you know?
Billington Holdings (LON:BILN) is based in Barnsley…buys steel predominantly from British Steel in Scunthorpe…or at a push Arcelor Mittal in France…& predominantly uses it in the U.K….with the occasional foray to the EU...it’s an ex holding of mine …& I highly rate mgt from my interactions with them over many years
Thanks John, yes I was going to say my expectation was zero, as I don't think they trade in the US at all.
One Broker's opinion is hardly a consensus.