How the StockRanks could be signalling an opportunity in smaller companies

The last few months have seen something of a recovery for UK small and mid-cap shares, after a long spell of being very much unloved.
Is this a false dawn or the start of a real recovery? We're all familiar with the arguments that many of these companies appear to offer good value. But some recent number crunching has also given me a data-backed conviction that this could be a genuine turning point.
I’ve found that companies with StockRanks of 90 or above are currently concentrated in the small and mid-cap indices, with far fewer in the FTSE 100:
Index | StockRanks ≧ 90 |
FTSE 100 | 9% |
FTSE 250 | 12.4% |
FTSE SmallCap Ex-ITs | 18.5% |
Data: 20 June 2025
This initial finding surprised me a little given the recent strength of the FTSE 100. To try and find out more, I enlisted Alex’s help to dig into Stockopedia’s historic data.
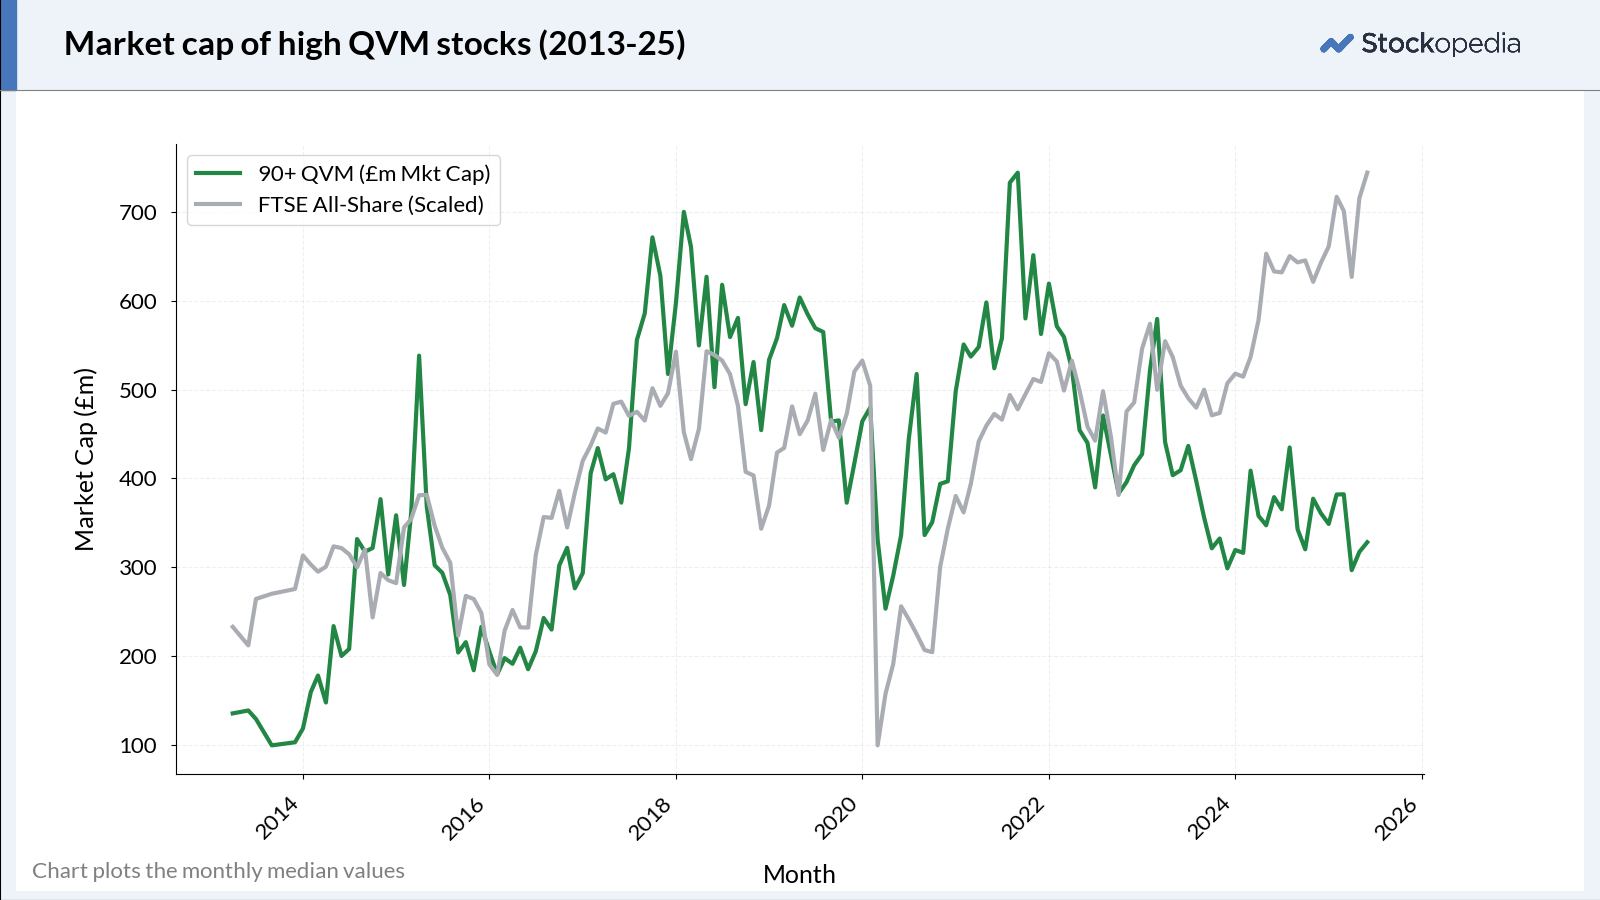
We decided to investigate the average market cap of highly-ranked stocks over the last decade. I’ve never considered this relationship before. But it turns out that historically there has been a clear link between market movements and the market cap of highly ranked stocks:
What does all this mean?
Before I go any further, I need to clarify exactly what the chart above shows.
Grey line: this represents the FTSE All-Share index. While this index has around 550 members, FTSE 100 companies make up about 85% of the total market cap of the All-Share index.
For my purposes here, I’m viewing the All-Share as broadly equivalent to the FTSE 100.
Green line: this represents the median market cap of companies in the All-Share index with a StockRank of 90 or higher.
In practical terms today, this means that our median market cap company is somewhere in the top quarter of the FTSE SmallCap Ex-ITs index.
Historically, we can see that the median market cap of the top-ranked stocks has broadly tracked the progress of the All-Share index (and FTSE 100).
That relationship appears to have broken down since late 2023. This is where I think the opportunity lies.
If the historic relationship between market cap StockRank remains true, and if the FTSE 100 isn’t about to crash, then UK investors could now have the opportunity to profit from a substantial recovery in UK smaller companies as they play catchup with the FTSE 100.
The 50 million dollar question is whether that relationship is about to reassert itself. I think it is. Here’s why.
Where are we now?
To explain my reasoning, I need to start with a look at the state of the UK stock market and the historic performance of its main indices.
Historically – over the last 20 years at least – the main indices have generally moved in the same direction, but with the 250 and SmallCap indices delivering larger gains at the cost of much greater volatility.
This is consistent with the relationship we saw above between the FTSE All-Share and our notional median market cap stock:

(I’ve not included the AIM index because it has woefully underperformed as an index through this period. I think it makes more sense to compare good quality AIM stocks with the FTSE SmallCap and 250 indices, depending on their size.)
This chart highlights a number of points, I think:
The FTSE 100 has been making record highs recently
The last 20 years have generally been a good time to be a FTSE 250 investor…
… but it might not feel like that for investors who’ve bought since 2019!
Given how many decent companies the FTSE 250 contains, I think it’s remarkable that the mid-cap index is still trading below its pre-pandemic highs – and well below the all-time high of August 2021.
My tentative conclusion is that many FTSE 250 companies (and some small caps) were ideally positioned to take advantage of the 2012-2022 era of cheap money, low inflation and globalisation. They had proven and profitable business models, clear runways for growth and sufficient scale and sophistication to seize the opportunity.
I’d argue also that the pandemic trading boom poured rocket fuel on the valuations of some small and mid-cap stocks, leaving them somewhat overvalued in 2021/22.
In contrast, many FTSE 100 companies seemed stubbornly unable to convert the opportunities of the low interest rate years into shareholder returns. I’d suggest various possible reasons for this:
Profits held back by expensive legacy problems (banks)
Margin pressure from low interest rates (banks, insurers)
Mature, saturated markets with low growth potential (tobacco, supermarkets, telecoms)
Cyclical headwinds, already very large (oil & gas, mining)
Whether by cause or coincidence, rising interest rates from December 2021 onwards marked the start of a painful deflation of the UK’s small and mid-cap indices.
In contrast, many FTSE 100 members have since managed to regain lost form and deliver both a return to growth and share price re-ratings. Some have also benefited from the changing external conditions – Rolls-Royce and BAE Systems are standout examples.
All of this brings us to where we are today.
This chart compares the performance of the three main UK indices since July 2021:

Looking at the chart above in isolation, we would probably conclude that the SmallCap and 250 indices have underperformed since 2022.
However, if we look back at the 20-year chart I posted earlier, I think a different possible explanation emerges.
In my view, it’s possible to make the case that the rise and subsequent fall of the smaller indices since 2020 could be an example of the valuation overshoot and undershoot that are often associated with mean reversion.
To illustrate this point, I’ve republished the previous 20-year chart below with added trend lines:

I’m no chartist, so I’ll apologise now for the lack of precision of these lines. But I think my effort is enough to highlight the possibility that the FTSE 250 (as a proxy for small and mid caps) could be more undervalued than the FTSE 100 right now.
A quick look at some key median ratios for each index seems to provide some support for this view. UK smaller companies are both cheap and have higher expected earnings growth rates:
Forecast ratios | P/E | EPS Growth | Div. Yield |
FTSE 100 | 13.6 | 10.8% | 3.3% |
FTSE 250 | 13.5 | 11.5% | 4.0% |
FTSE SmallCap ex-ITs | 10.4 | 12.9% | 4.8% |
Data: 20 June 2025
Final thoughts
I believe that small and mid-cap stocks with high StockRanks could be a very attractive place for investors to hunt for new opportunities right now. This is an area where much of my personal investing focus lies at the moment. Personally, I am almost fully invested.
Even so, my conclusions do contain obvious elements of guesswork and extrapolation. So I want to emphasise some important caveats to my comments above:
Larger companies tend to be less volatile and less likely to face existential issues during times of market or external stress;
10 years is not necessarily a very long period from which to draw this kind of relationship;
Share prices are inherently unpredictable and may be influenced by unexpected external developments. These seem to be in plentiful supply at the moment.
For these reasons and others, I would not suggest dumping FTSE 100 stocks and pivoting solely to small caps.
But for investors with an interest in UK smaller companies, I can’t help feeling that exciting times could lie ahead.
Please DYOR and let me know what you think in the comments below!
Disclaimer
This is not financial advice. Our content is intended to be used and must be used for information and education purposes only. Please read our disclaimer and terms and conditions to understand our obligations.
8 comments
Buy the business not the share, and don’t overpay (now where did I hear that?).
Thank you Roland, excellent article.
Just to back up your conclusions, take a look at the Numis Small Caps index over the last 75 years. It shows that we have only had 11 bear markets during those 75 years of which only 3 of those were of a length of 2 or more years (early 70's crash, 2000 - 2003 crash, GFC crash) and what happened after those events was a spectacular recovery / mean reversion of at least 100% over the following 2 years, I think the recovery after the early 70's was about 330%. And the exciting bit is that the best returns came from small cap value, and even more exciting is that this difficult small cap bear market is getting on for nearly 4 years so fingers crossed that history will repeat itself and the mean reversion will play out.
Regards Neville
Really good article, thank you.
Excllent article Roland. Ive been in the market 45 years and have always felt smaller companies (but not too small!) out perform larger ones and then over the last 20 years we see Apple and Amazon just blaze a trail ever upwards. But your point is a good one, overall we should see this reversion to the norm. Thanks again for these well researched and reasoned articles.
Roland concludes that "in practical terms the median market cap company (stock rank 90+) is somewhere in the top quarter of the FTSE SmallCap Ex-ITs index". This should theoretically provide an extra filter. For example, if I was a fund investor a trust like Aberdeen smaller companies dealing with larger (small) companies would be of much interest than a micro cap fund. I don't know what the distribution is but you are probably looking at a threshold 150m plus if 30m to 300m is the range for small caps
Excellent and logical as always Roland, thank-you. And probably popular with Stocko readership!! Certainly I'm happy with your conclusion as I plough my VM furrow.
Nice piece of work.
Thank you Roland for this. It certainly feels like as an asset class UK small caps are steadily grinding higher day by day whatever is happening geopolitically.