How to calculate target prices for your stocks

What’s a stock really worth? In an effort to answer this question, City analysts will generally produce target prices for the shares they cover.
These prices are calculated using a range of techniques. Broadly speaking, we can see them as the analysts’ best estimate of a fair value for the company, made without relying solely on market price discovery or valuation multiples.
Stockopedia subscribers can find the latest consensus target prices for each stock at the bottom of the StockReport, alongside detailed earnings estimates.
Here’s an example for FTSE 100 stalwart Lloyds Banking Group, showing the gap between the target price and current price. An estimated long-term growth rate for the business is also included, to give some context to the basis for the price target.

As with earnings forecasts, these target prices can be subject to regular revision. Although I don’t use them to make trading decisions, I find they can provide useful extra information and context when I’m analysing a company.
For example, when a stock I’m interested in is trading above its target price, possible explanations include:
The shares are starting to look (too) expensive;
The company is benefiting from strong momentum and broker estimates may be stale. As Ed highlighted in his article last week, this can create profitable buying opportunities.
However, I often find that broker target prices are of limited use to me because I don’t know how they were produced. For example:
What assumptions were used about future growth?
What valuation techniques were used?
Do the analysts who crunched the numbers share my view of the business and my investing perspective?
For these reasons, I’ve become progressively more interested in building my own valuation estimates for stocks that I follow. I reckon some basic valuation techniques can be a useful addition to an investor’s toolkit.
In the remainder of this article, I’m going to highlight several simple valuation methods private investors can use to build quick but useful estimates of intrinsic value.
Before that, however, I’m going to take a quick look at the academic theory behind asset valuations and the elephant in the room – discounted cash flow models.
DCF: the gold standard?
Academically, the intrinsic value of an investment is said to be the sum of the expected future cash flows it will provide, discounted to reflect the time value of money.
In equity markets, this approach is known as discounted cash flow (DCF) analysis.
Creating DCF models is an activity beloved of many City analysts. But they are complicated to do well, requiring a thorough understanding of a company’s operations and capital structure.
These models also depend on a large number of predictions about the future, any changes to which can cause a big change in the output valuation estimate.
DCFs are useful as a valuation tool and can be interesting to build. But in general, I think they are too complex and time-consuming to be useful as a tool for quick valuation estimates on multiple stocks – a typical private investor scenario.
Let’s move on and take a look at three much simpler methods that I find very useful.
Dividend Discount Model: a simpler choice for income stocks
I’ve chosen to look at the dividend discount model first (also known as the Gordon Growth Model), because in some ways it is a simplified version of a DCF.
Rather than focusing on all of the cash flows generated by a business, this approach simply looks at the cash flows investors will receive from their shares. These are generally limited to dividends.
This approach is generally better suited to shares that pay consistent dividends and can distribute a relatively high share of their earnings. But it can be refined to make it more useful in growth scenarios as well.
In its simplest form, the dividend discount model formula is:
Share price = forecast dividend per share / (required rate of return - dividend growth rate)
(Note that the dividend growth rate cannot be greater than the rate of return.)
Here’s an example, using tobacco stock Imperial Brands (LON:IMB):
Current year forecast dividend - we can find this easily on the StockReport:

Required rate of return or cost of equity: this is the investment return you would want in order to invest in the business. It’s inherently subjective and linked to interest rates, but I tend to rely on some fairly standard choices.
For big cap stocks like Imperial Brands, I normally use a target return of 8%. This is similar to the long-term average annualised return from the UK stock market.
For smaller companies I’d probably increase this to 10%, or even more for riskier situations.
It’s worth remembering that changes to the required rate of return will have a big impact on the output of this model.
Dividend growth rate: we have to estimate a terminal (indefinite) growth rate for the dividend. This will never be perfectly accurate.
I tend to make a conservative estimate, based on a combination of recent performance, any medium-term guidance, and my own view.
For Imperial, I started by calculating an average of the actual and forecast dividend growth rates since the company cut its payout in 2020. This gave me a growth rate of 4.5%.
That’s consistent with current performance, but I’m not convinced it’s a sustainable long-term growth rate, given the ongoing decline of the global cigarette market.
For this reason, I’ve opted to use a more conservative 2.5% rate of dividend growth. I reckon this is more likely to be sustainable over the next 5-10 years.
Here’s how this all comes together:
163 / (0.08 - 0.025) = target price of 2,963p
As it happens, that’s fairly similar to the consensus target price shown in the StockReport:

Anyone interested in Imperial should remember that the company is due to issue an update on its strategy for the next five years in March 2025. This is likely to include updated dividend guidance.
Can we improve this estimate?
The approach above is known as a single-stage dividend growth model. It assumes a constant rate of growth forever. This is not necessarily realistic.
One useful refinement to this model is to add some additional stages. This can be useful when a company is expected to have stronger dividend growth for a few years, before maturing and settling down to a more modest rate of growth.
I can use this approach to refine my estimate for Imperial, based on current consensus forecasts:
FY25e: 163p per share (+6.2%)
FY26e: 170p per share (+4.6%)
FY27 onwards: 174p per share (+2.5%)
To build a target price from this information, I’d calculate the discounted present value of the individual payments using my chosen 8% required return. I’d then use the DDM again, discounting the output, to estimate the remaining value:
FY25e = 163/1.08 = 150.9p
FY26e = 170/1.08^2 = 145.8p
FY27 onwards: (174/(0.08/0.025))/1.08^3 = 2,511p
My valuation estimate is simply the sum of these discounted values, which total 2,807.7p.
This estimate is very close indeed to the current broker consensus target price of 2,823p.
Earnings Power Value: no predictions needed
The dividend discount model still requires us to make predictions about the future.
One alternative that requires no prediction at all is the Earnings Power Value method. This uses a company’s recent operating profit, tax rate and cost of capital to estimate a fair value for its shares.
Of course, the idea that profits will remain fixed into the future is generally unrealistic. But I find the EPV model to be a useful way of creating a benchmark against which to consider the current valuation.
Current share price below the EPV price = the shares may be cheap, or the market is expecting profits to fall.
Current share price above the EPV price = the shares may be expensive, or the market is pricing in profit growth.
EPV Calculation
Here’s an example of how to calculate an EPV. I’ve used Imperial Brands again, so I can compare my result with the DDM valuation above.
Trailing 12-month operating profit: Imperial reported a figure of £3,554m for the 12 months to 30 September 2024.

Required rate of return: 8% – see my comments in the DDM section for more on this topic.
Tax rate: Imperial’s adjusted effective tax rate was 22.7% in FY24.
The initial EPV calculation is straightforward:
EPV = (EBIT minus tax) / Req’d rate of return
= (3554*(1-0.227))/0.08
= £34,340m
The next step is to subtract net debt and perhaps pension deficit, if significant:
Imperial’s FY24 net debt was £8,430m:
= 34340 - 8430
= £24,910m
Finally, divide this result by the number of shares in circulation to calculate EPV per share:
= £24,910m / 837m
= 2,976p
My estimate of Imperial’s EPV per share is not a million miles away from my DDM estimate of 2,963p or the current broker consensus target price of 2,823p.
How to deal with volatility?
Using Imperial’s FY24 operating profit as a loose guide to what might lie ahead is not especially controversial, at least, not in the short term.
However, some businesses generate more volatile levels of profit. Big commodity stocks such as Shell and Rio Tinto are good examples of this – mature and stable, but with big swings in profitability.
In such cases, one approach I’d use to calculate an EPV would be to calculate average operating profit over a number of years – potentially 10 years.
This is also the approach I used in my recent Stock Pitch on Burberry to estimate a normalised value for the business, if it recovers from its current slump.
Using valuation ratios to estimate a target price
I think the methods above can both be useful. But I don’t think it’s sensible to ignore valuation ratios entirely. These can convey a lot of useful information, both in isolation and when compared to peer companies or the wider market.
To wrap up this article, I’m going to take a short look at how we can use valuation ratios to determine the fair value of a share.
This approach can be used to calculate target buy prices, too, as I show below.
Many different valuation ratios can be used with this technique, depending on personal preference and the type of business being analysed.
As a starting point, I’d suggest choosing from among those listed in the Growth & Value section of the StockReport:
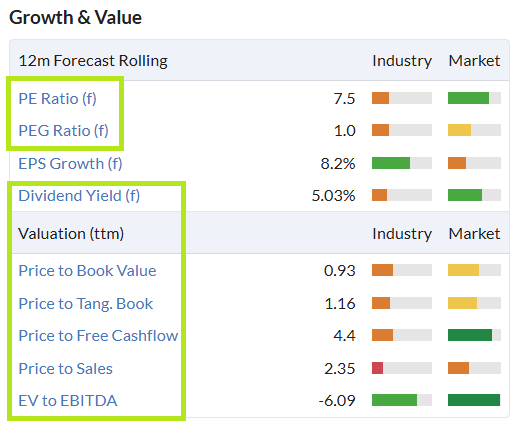
In general, the approach used is to decide on what we think an appropriate valuation multiple is for a business, then use this to extrapolate a target price.
For example, I might argue that Natwest shares would be fairly valued with a dividend yield of 4%. Based on the 2024 forecast dividend of 19.1p per share, that would imply a target price of 478p (= 19.1 / 0.04). (The current broker target price is 450p.)
Equality, I might be interested in buying Natwest if the dividend yield rose to 6%. That would imply a buy price of 318p (= 19.1 / 0.06).
Final thoughts
My aim with this article was to provide some ideas to fuel your own research and analysis.
I think the extra difficulty in estimating target prices for shares can create opportunities for investors who are willing to make the extra effort and form their own view on valuation and potential future returns.
However, I’ll end with a word of caution. Equity valuation is not an exact art and future cash flows from shares are always uncertain.
It’s a fool’s errand to believe we can accurately calculate the intrinsic value of a share to the nth degree. It simply isn’t possible.
Valuation estimates will always be our best guesses, no more. For this reason, I’d always look for a comfortable margin of safety between any target price, and the price I was willing to pay.
Disclosure: Roland owned shares in Imperial Brands and Burberry at the time of publication.
Disclaimer
This is not financial advice. Our content is intended to be used and must be used for information and education purposes only. Please read our disclaimer and terms and conditions to understand our obligations.

18 comments
Greater precision doesn’t mean greater accuracy. Skip the article and go straight to the Final thoughts, which are quite good.
Thanks Roland very helpful for those of us (me!) not skilled enough to do DCF analysis. On working through your EPV Calcaulation I noticed an error in your figures:
Imperial’s FY24 net debt was £8,430m:
= 34340 - 8430
= £24,910m (should be £25,910m)
Finally, divide this result by the number of shares in circulation to calculate EPV per share:
= £24,910m / 837m
= 2,976p (then this results in 3096p)
I always like to check the breakdown to ensure I understand the calculations.
Thanks again
Well laid out and informative post Roland, thank you.
Why do people believe forecasts. They have been wrong for 20 years plus. David Dremans book contrarian investors has a whole chapter on why Brokers forecasts are a waste of time and he concludes theres a conflict of interest . You rarely get brokers issuing a sell. Lots other books on this too
Just use a screen Fcf increasing year over year for last 3-5 years and sales increasing year over year for last 3-5 years and positive net debt (a minus) meaning they are cash rich
compare calc
fcf year last ttm x1 >= fcf 1 year ago
Fcf 1 year ago x1 >= fcf 2 years ago
fcf 2years ago x1 >= fcf 3 years ago
Same for sales
Then can tweak other metrics, like market cap over 50 million, bps spread less that 3% (300 bps). Ps less than 1 (meaning its cheap)
Then go on point and figure charts using the correct box size
I have made a fair chunk like this and then holding.
Expectations Investing is an interesting read (link below) which turned calculating a target price on its head a little. Rather than working out a target price yourself, it suggests understanding what the market price assumes in terms of future operating cash flows vs. EV. You can then assess how accurate the market may prove to be in different scenarios, e.g. different levels/periods of growth, return on equity expectations, etc. Appreciate this approach may be less simple than you were trying to achieve in this article. Interesting read though and helped me think differently for sure https://amzn.eu/d/1gFZLpy
I find it is easier to put the current share price into the formula and get out the implied rate of return. Then compare to the rate it should be offering with that degree of risk. Rather than get the implied/ target share price.
Hi Roland,
Sorry, I'm struggling to understand the improvement to the Dividend Discount Model, are you, or any other kind contributor, please able to explain how this improvement works and what I'm missing?
The original model arrives at an estimate of 2,963p. Then slightly more dividend growth in the first two years is assumed, without any reduction in the terminal growth (2.5%) or change to the discount rate (8%), but a lower estimate of 2,807.7p results. Why does assuming more dividend growth in earlier years result in a lower valuation?
And where do the 1.082 and 1.083 factors come from?
Thanks!
For the benefit of anyone else:
For my second question, the numbers are just missing a power sign, I believe. 1.082 and 1.083 should just be 1.08^2 and 1.08^3.
There's also a second typo where a / should be a - in:
"FY27 onwards: (174/(0.08/0.025))/1.083 = 2,511p"
Hi Tree,
Thank you for pointing this out. My superscript got lost in the process of copying and pasting from Google Docs. Apologies for not spotting this before I hit the button, it will be fixed shortly.
Roland
Hi Roland,
Thanks for replying and confirming.
For my first, more material, question, on why the improved estimate counter-intuitively reduces, after a bit of reflection, I think this is because the original Dividend Discount Model implicitly assumes no discounting (or growth) in the first year; it is based on a Geometric Series solution.
The improvement then explicitly is assuming discounting in the first year, and effectively adds an extra year of discounting to all years, reducing the estimate by a factor of (1/1.08). For this improvement to be an estimate on a like-for-like basis to the original I think the value should be 3,032.7p?
Alternatively, the first estimate could be adjusted instead to discount the first year. Either way though, I think discounting assumptions should be on the same basis?
The way that I do this for profitable growth companies is based on Value = EPS * PE ratio. I spend a considerable amount of effort arriving at both the EPS and the PE ratio. I do this for separately for FY1 and FY2. I then apply a time weighted calculation to arrive at my expected intrinsic value for 12 months forward from now.
Thanks Roland, I did wonder where Stocko got their Price Targets from. I assumed it was just some Stocko ‘magic’ behind the scenes.
Personally I use a quick calculation: Profit after tax x PE ratio + Cash etc. (from Stocko balance sheet section) then divide by Average shares (again from Balance sheet section).
It’s probably not perfect or going to work for every type of stock, but it gives me a rough idea anyway
The article is a really good idea. But with no treatment of growth businesses, it feels like half the task has been left for another day. I use a version of the Graham formula for calculating intrinsic value of growth companies. Here it is from 1962:
For Y, I substitute the US 10yr Treasury yield. And then I look at free cash flow yields and margins to compare against competitors and tweak the model. The stronger these variables, the more slack I allow the target price.
In the original version of stockopedia they had the graham value, one issue was always the 20 year aaa bond rate was wrong at 5-6% (which it is now) and you had to look it up and add it, where the value was more like 2% at the timeZ It was handy to have , I requested they add it years ago but they havnt?
You could probably use chatgpt 4.0 if you have all the parameters to calculate,
Very helpful summary and something that I would like to come back to again when I have more time. Is there any way that I can bookmark this article within the Stockopedia system?
Its a difficult and subjective topic. Very useful, clear and concise article. Thanks
Thank you Roland. What valuation method do you suggest would be most appropriate for profitable growth company?