How to screen for high-return bowls

Last week, Ed wrote an excellent article called The Hump and the Bowl - understanding the patterns of Momentum. I am naturally sceptical about simple chart patterns and anyone who suggests that the future share price can be predicted by the shape of the graph of the historical one. However, I am a believer in Momentum. As Ed described, the academic evidence is clear:
- Over extended periods, stock prices tend to mean-revert.
- Over the medium term, winners tend to keep on winning, and losers keep losing.
- Over the very short term, mean reversion rules again.
While debates about how exploitable these characteristics are (short-term trading strategies naturally incur much higher transaction costs), there is strong evidence that these effects are persistent across time and geography.
I was challenged by Ed’s article; perhaps some chart patterns reflect underlying Momentum characteristics and market inefficiencies driven by psychological biases. “Bowls” may be one of these. Although Ed’s article focused on Momentum, I think this may be particularly relevant to Value Investors, such as myself. We tend to be drawn to the cheap, high-quality stocks; those that were once highly rated but are going through a difficult patch. My expectation is that these conditions are temporary, and mean reversion in corporate performance will lead to investors falling in love with the stocks again. However, my kryptonite is buying into stocks too soon, when weakness in corporate performance tends to beget further weakness.
My first thought is perhaps Ed is on to something with his description of a bowl-shaped graph representing Momentum-based opportunities. My second thought is, how do I find these? Ed gave a couple of examples that he has come across, and, of course, we can go through all 1350 stocks listed on the UK market and look at the graphs. However, it would be a lot easier if we could screen for potential bowls. As a big fan of screening to generate new ideas, I gladly accepted the challenge.
Screen Criteria
Large upside
The first thing we are looking for is to take advantage of the long-term mean reversion in corporate performance and stock prices. This is the other side of the bowl. Here, I am looking for stocks where the share price has fallen by at least 50% over the last three years compared to the wider market. This suggests that the stock should at least double if it returns to its previous highs:

One thing to be careful of here, which is often missed by those who only look at charts, is dilution. Some companies will have seen their share price fall because they have got themselves into financial trouble, requiring further equity to be raised from shareholders in the form of a placing or rights issue. If the share count has doubled to reach previous highs, the market cap would have to be twice the previous value for the stock to reach the same share price. This makes a return to previous share price highs much less likely. The Stockopedia screening database doesn’t have historical shares in issue, so this can’t currently be screened for, but I will manually check the results.
Trending off the bottom
The key aspect of the bowl shape is that the recovery in the share price has already begun and has been sustained for some time. To do this, I can use an advanced screening rule that compares criteria:

In this case, I want the 3-month relative strength to be higher than the 1-month, and the 6-month relative strength to be higher than the 3-month:

This should ensure that the medium-term chart is starting to trend upwards. I could have used the 1-year relative strength instead of the 6-months here, as Momentum tends to work for both periods. I chose 6 months because I prefer companies starting their recovery journey, rather than ones already pricing in significant future recovery. One final criterion I need here is to ensure that the 6-month relative strength is actually slightly positive, and the recovery has begun:
Avoiding the dross
While this is primarily a price action screen, there is strong evidence that investors should avoid the lowest-ranked stocks. Investing in a stock where any of the ranks are very low seems a bad idea, so I exclude companies with very low value or Quality Ranks. Bowl purists may want to disregard such factors, but personally, I’d rather not be swimming against such a strong tide:

Illiquidity criteria
Finally, I exclude stocks listed on Acquis and those with a market cap below £10m, as we tend to use these cutoffs to avoid the most illiquid stocks that may not be investable for most investors:

Screen Results
The screen currently produces 19 results:
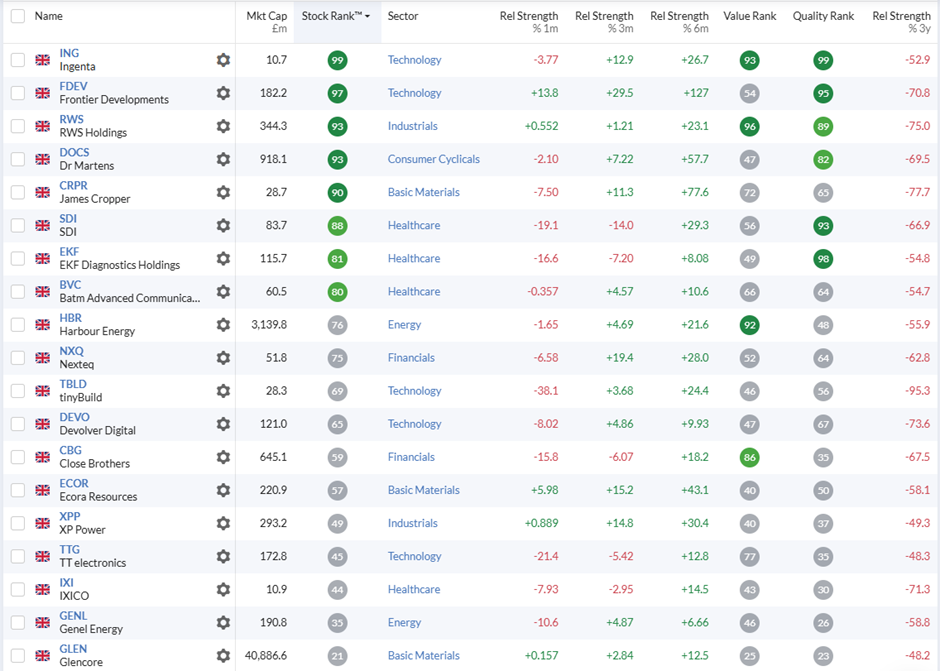
Since I couldn’t screen for share dilution, I performed a manual check and found that three companies had significant dilution since their share price peaks over the last three years: Harbour Energy (LON:HBR) tinyBuild (LON:TBLD) IXICO (LON:IXI). For tinyBuild, this dilution doesn’t make a big difference to the potential upside if the stock returns to previous market cap highs. However, for Harbour Energy and Ixico, the dilution significantly reduced the potential upside, so I have removed these from my list of potential high-return bowls.
How good are these bowls?
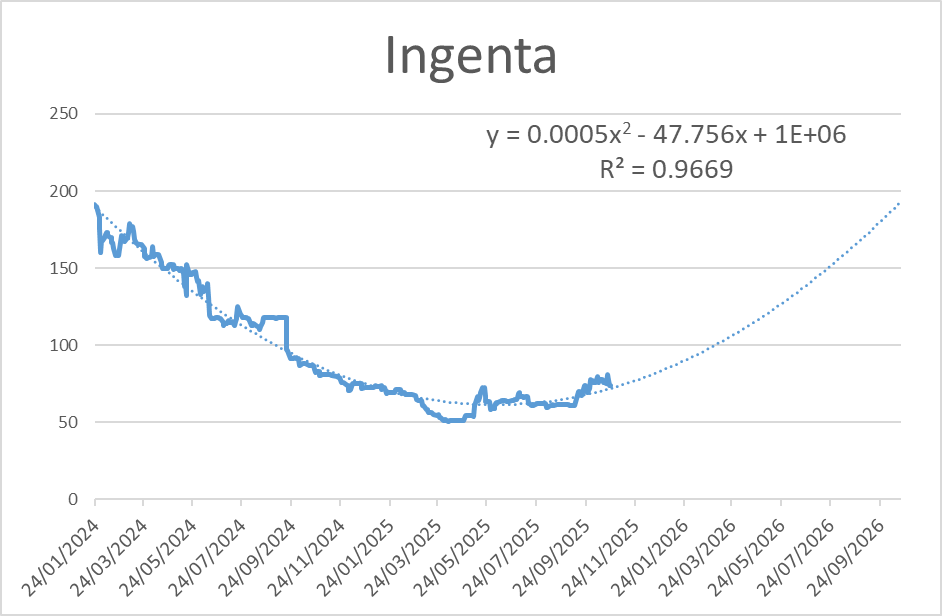
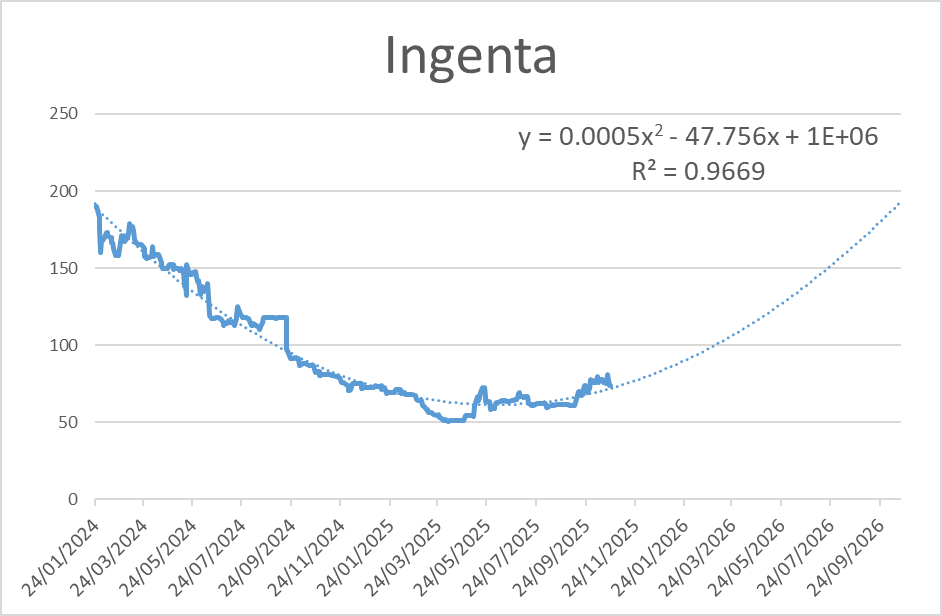
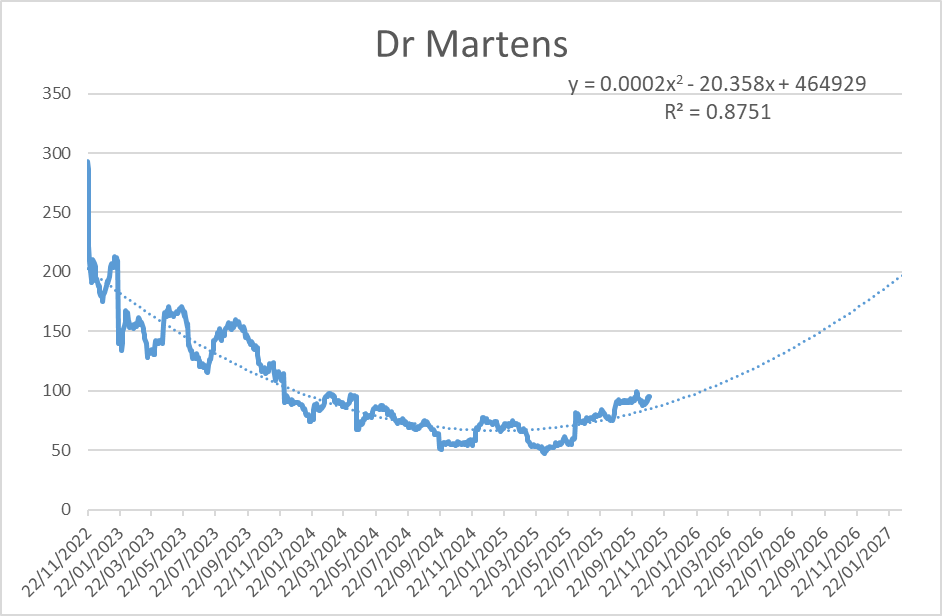
Some investors may want to simply look at the charts at this point. However, I believe it is possible to judge the quality of the bowl more objectively. Mathematically, a bowl shape is closest to a parabola. This means that simple chart tools, such as those in Excel, can find the best-fitting parabola. Using these tools means investors can judge the shape of the future share price graph if it follows a bowl pattern and, equally importantly, how well the historical chart matches a bowl shape.
The key statistic here is called R-squared. For any given data set (historical share price data, in this case) and a line of best fit, R-squared gives an indication of how closely the data matches that line. R-squared can be between 0 and 1, with zero meaning no real match, and one being an exact match. In our case, the higher the R-Squared, the more bowl-like the chart. I looked at the peak share price point for each company in the last three years and graphed the share price since that point. I used Excel to fit a parabola to the data and calculate the R-squared.
You can see the difference between Ingenta (LON:ING), which is the highest R-Squared in my list, with a 0.97 R-Squared value and EKF Diagnostics Holdings (LON:EKF) at 0.26:
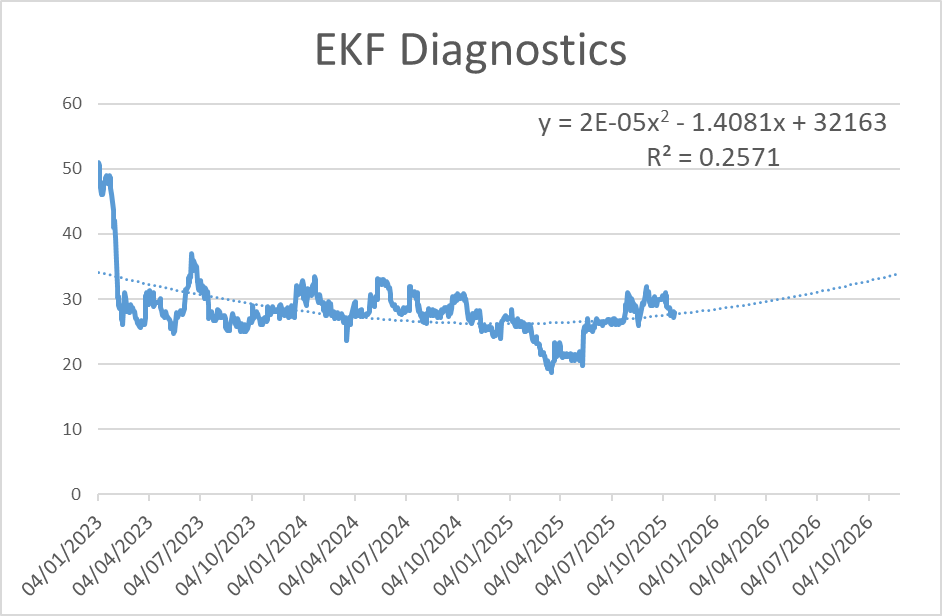
EKF Diagnostics may still be described as bowl-shaped, but most of the drop was a steep decline at the start of the three-year period, and (presumably news-related) short-term spikes tend to dominate the chart.
Here is the complete list from highest to lowest R-squared:
| Name | Peak Share Price Date | R-Squared |
|---|---|---|
Ingenta (LON:ING) |
24/01/2024 |
0.97 |
Ecora Resources (LON:ECOR) |
01/11/2022 |
0.95 |
SDI (LON:SDI) |
23/02/2023 |
0.94 |
RWS Holdings (LON:RWS) |
13/01/2023 |
0.90 |
Dr Martens (LON:DOCS) |
22/11/2022 |
0.88 |
Close Brothers (LON:CBG) |
06/01/2023 |
0.85 |
tinyBuild (LON:TBLD) |
12/12/2023 |
0.82 |
Genel Energy (LON:GENL) |
29/11/2022 |
0.80 |
James Cropper (LON:CRPR) |
24/10/2022 |
0.79 |
Batm Advanced Communications (LON:BVC) |
11/01/2023 |
0.77 |
Frontier Developments (LON:FDEV) |
15/11/2022 |
0.76 |
Nexteq (LON:NXQ) |
10/02/2023 |
0.76 |
TT electronics (LON:TTG) |
08/03/2023 |
0.75 |
Glencore (LON:GLEN) |
18/01/2023 |
0.74 |
XP Power (LON:XPP) |
24/01/2023 |
0.72 |
Devolver Digital (LON:DEVO) |
01/11/2022 |
0.50 |
EKF Diagnostics Holdings (LON:EKF) |
04/01/2023 |
0.26 |
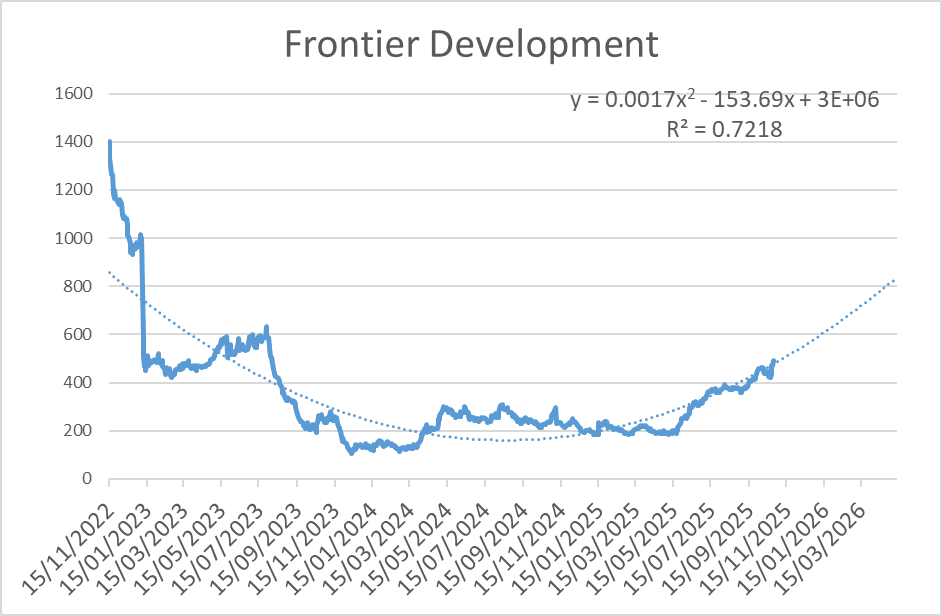
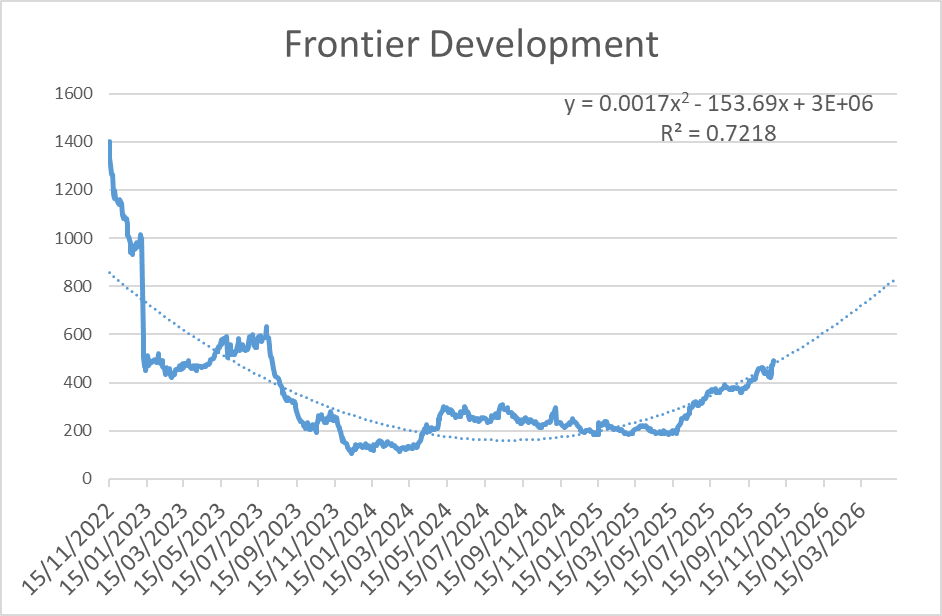
Interestingly, Frontier Developments (LON:FDEV), which Ed mentioned in his article, isn’t actually one of the smoothest bowl shapes:
Is now the time to invest?
How closely a chart matches a bowl shape isn’t the only consideration revealed by taking a more objective approach to pattern-matching. It matters where we are in any potential recovery. For example, RWS Holdings (LON:RWS) has an R-squared of 0.91, but the shape of the graph suggests that it may be some time before the share price has formed a definite bottom here:
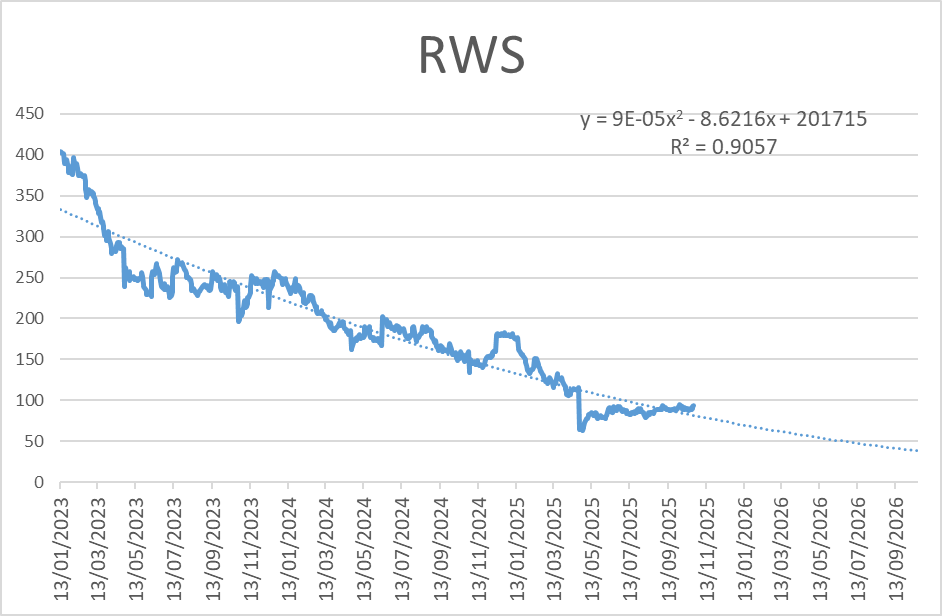
Several other companies on this list fall into the same camp: James Cropper (LON:CRPR) Batm Advanced Communications (LON:BVC) Nexteq (LON:NXQ) TT electronics (LON:TTG) and Glencore (LON:GLEN) . This doesn’t mean that these won’t prove to be good recovery stocks or have other positive qualities, just that the historical share price data doesn’t yet fit the recovery side of the parabola (bowl) being underway. It may do for all of these at some point in the future.
How big is the upside?
When investing in stocks that are currently benefiting from positive Momentum into a recovering share price, investors aren’t just interested in how closely the share price matches a particular recovery pattern, but also in how big the upside is if the chart pattern completes. One simple way to look at this is to take the peak price compared to today’s price and adjust for dilution:
| Ticker | Peak Date | Peak Price | Inc share count | Price 27/10/25 | Potential Upside |
|---|---|---|---|---|---|
tinyBuild (LON:TBLD) |
12/12/2023 |
116 |
88% |
7 |
802% |
RWS Holdings (LON:RWS) |
13/01/2023 |
405 |
93 |
336% |
|
James Cropper (LON:CRPR) |
24/10/2022 |
995 |
300 |
232% |
|
Dr Martens (LON:DOCS) |
22/11/2022 |
292 |
95 |
209% |
|
Frontier Developments (LON:FDEV) |
15/11/2022 |
1418 |
505 |
181% |
|
Devolver Digital (LON:DEVO) |
01/11/2022 |
72 |
26 |
180% |
|
Close Brothers (LON:CBG) |
06/01/2023 |
1124 |
429 |
162% |
|
Ingenta (LON:ING) |
24/01/2024 |
191.00 |
75 |
155% |
|
XP Power (LON:XPP) |
24/01/2023 |
2680 |
1,054 |
154% |
|
SDI (LON:SDI) |
23/02/2023 |
200 |
80 |
150% |
|
Nexteq (LON:NXQ) |
10/02/2023 |
192 |
87 |
122% |
|
Genel Energy (LON:GENL) |
29/11/2022 |
147 |
69 |
114% |
|
TT electronics (LON:TTG) |
08/03/2023 |
204 |
98 |
107% |
|
EKF Diagnostics Holdings (LON:EKF) |
04/01/2023 |
50 |
26 |
92% |
|
Batm Advanced Communications (LON:BVC) |
11/01/2023 |
33 |
18 |
84% |
|
Ecora Resources (LON:ECOR) |
01/11/2022 |
157 |
90 |
75% |
|
Glencore (LON:GLEN) |
18/01/2023 |
568 |
352 |
61% |
However, this misses two key parts of our analysis: the smoothness of the curve and how long it takes for the bowl pattern to complete. To generate higher compound returns, investors would prefer a share price recovery that happens fairly quickly, rather than a long, drawn-out process.
Speed of potential recovery is one of the positive things Frontier Developments (LON:FDEV) has going for it, even if the sharp falls at the start of the chart suggest that 800p is a more realistic target price than 1400p:
Taking these factors into account, I can calculate an annualised return if the bowl-shaped chart pattern is complete, for the shares where the bowl has started to turn upwards already:
| Ticker | Target Price | Target upside | Years to complete bowl | CAGR Return |
|---|---|---|---|---|
tinyBuild (LON:TBLD) |
85.00 |
1141% |
1.20 |
716% |
SDI (LON:SDI) |
200.00 |
150% |
1.08 |
134% |
Frontier Developments (LON:FDEV) |
850.00 |
68% |
0.80 |
92% |
Ingenta (LON:ING) |
190.00 |
153% |
1.43 |
91% |
Devolver Digital (LON:DEVO) |
52.00 |
102% |
1.12 |
88% |
Close Brothers (LON:CBG) |
1,120.00 |
161% |
2.31 |
51% |
Dr Martens (LON:DOCS) |
200.00 |
112% |
1.91 |
48% |
Ecora Resources (LON:ECOR) |
160.00 |
78% |
2.27 |
29% |
XP Power (LON:XPP) |
2,500.00 |
137% |
3.59 |
27% |
EKF Diagnostics Holdings (LON:EKF) |
35.00 |
35% |
1.59 |
21% |
Genel Energy (LON:GENL) |
130.00 |
89% |
3.86 |
18% |
None of the CAGR returns would be bad if they were achievable, but the higher values would represent phenomenal annualised returns.
Despite the suggestion of amazing returns possible if it returns to previous market cap highs, I am not totally convinced by the chart at tinyBuild (LON:TBLD):
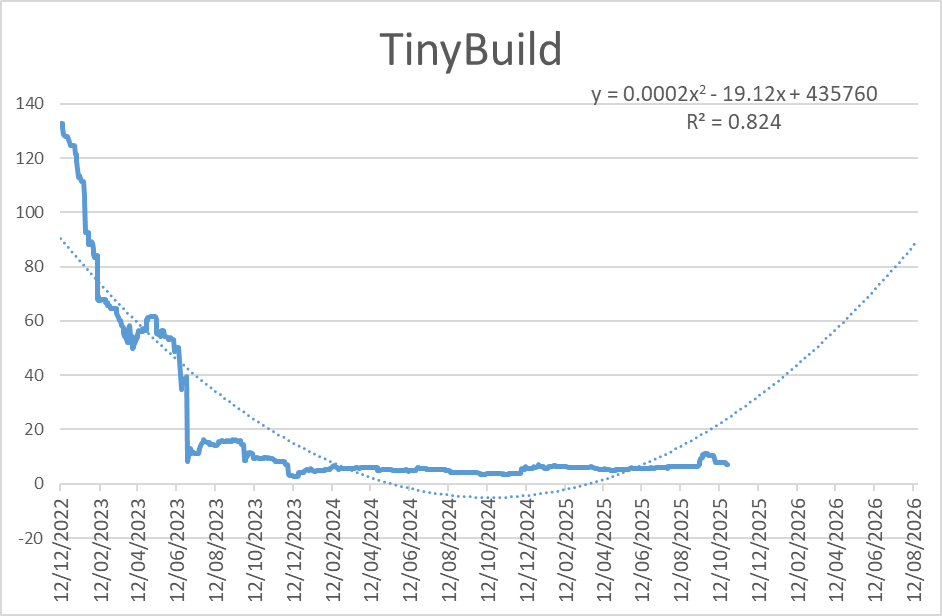
This seems more like a fall from grace, followed by bumping along the bottom, than a bowl to me.
The best bowls
Putting this altogether, here are the overall scores for these stocks:
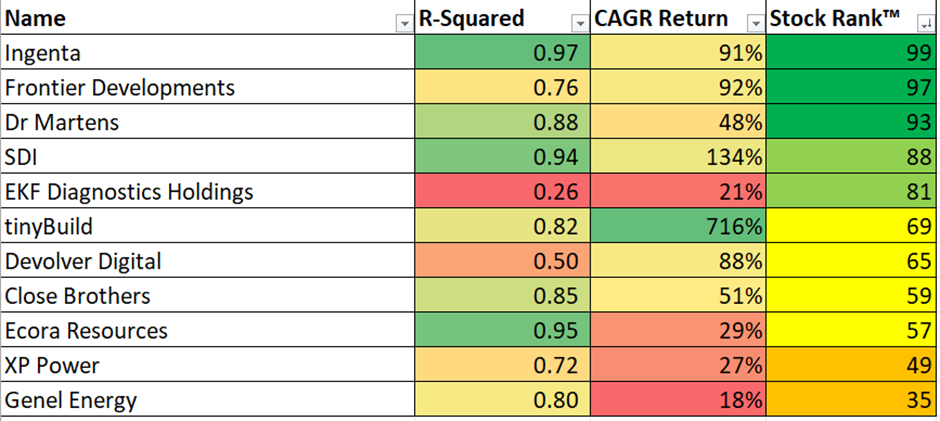
Balancing the scores across the smoothness of the bowl and the potential CAGR return, these three companies look like the best opportunities for those looking to take advantage of the momentum characteristics Ed described in his article:
Ingenta (LON:ING)
Dr Martens (LON:DOCS)
SDI (LON:SDI)
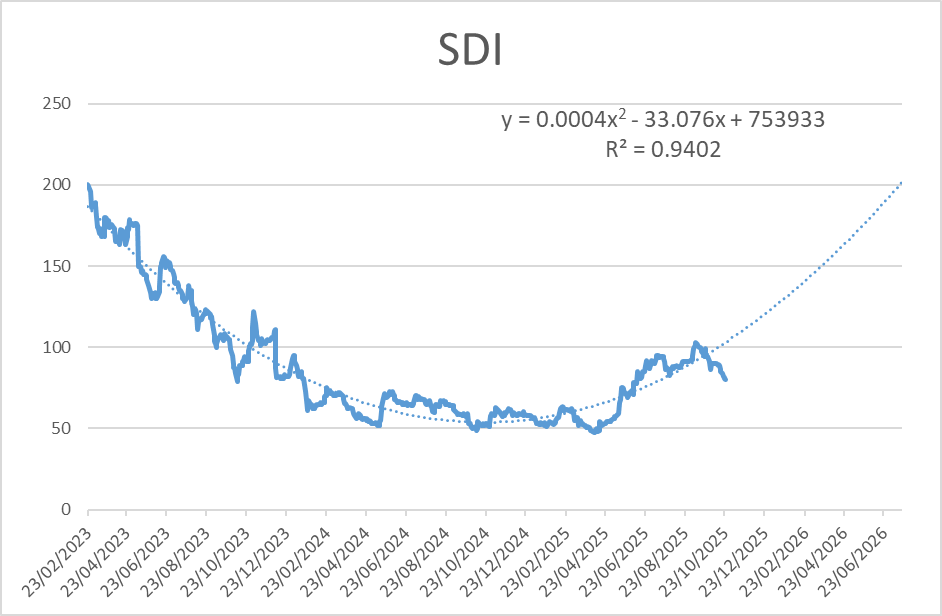
It is perhaps not a coincidence that these stocks also have very high StockRanks. I remain slightly sceptical that chart patterns can be so predictive, but if these three follow anything close to the bowl shape shown here, investors in these stocks will be in for a period of amazing returns.
[Disclosure: Mark owns shares in Ingenta (LON:ING) RWS Holdings (LON:RWS) ]
Disclaimer
This is not financial advice. Our content is intended to be used and must be used for information and education purposes only. Please read our disclaimer and terms and conditions to understand our obligations.

38 comments
The attached google sheet calculates the chart as per Marks article with the R squared calc on the chart for a given ticker (in Green), I like the idea. You can set this on the chart by going to Customise/Series/Trendline/Polynomal. Not sure you can calc this on the fly, you would have to add the result manually into a cell in the spreadsheet (column V).
The highest close in 3 years is calculated automatically using google finance, if the highest is within 6 months then it goes back 4 years to find a better measure and hopefully a better bowl.
The automatic calc of R^2 for the high to now doesnt show the direction of the trend which in this case will be negative so AS (adjusted slope) is calculated to show the direction, the higher the number the better/smoother the trend, the more negative the better the trend down.
I thought it would be a good idea to show the strength off the trend coming off the lowest point (R^2 LOW, AS LOW). The best stocks that look to have formed a bowl with the best AS/R^2 (>=30,>=0.7) are highlighted in light green, so potentially the best candidates overall.
The sparkline column gives a quick overview of the chart for each listed stock. Simply add your own stocks in this column. Weekly prices I think give the best chart when looking for a bowl but experiment with daily if u like by selecting on the dropdown
Hopefully the sheet is self-explanatory.
LINK to SHEET
Thanks Paul,
Thanks again for sharing this. It's a new area for me, so I will have to see how it goes.
In the past, timing the buying and selling of stocks has been a bit more down to luck than anything else. Hopefully this will help me to sharpen the correct timing a bit more in the future.
Graham.
Thanks to Mark for planting the idea
Thanks Paul for posting this and allowing us to link into your spreadsheet but would you mind explaining to me how I should use and what table do I need to populate with my own data/results from the screens. I think I understand that the TAB screen I populate with my results from the High Bowl screen seen above but what about the SCREEN FROM FOLIO tab are these tickers from you own portfolio as it stands today and the EXCEPTIONS tab how do you populate that. Sorry if these questions make me come over as being dumb but I just want to make sure I understand it properly and can make good use of your work.
Jon
The EXCLUSIONS you can populate yourself, there's always stocks you don't want to touch because of spread or liquidity for example, almost as important as the stocks you do want to look at.
Columns A to K come from Marks screen (just copy and paste) - https://www.stockopedia.com/screens/bowls-adapted-1402905
ALL STOCKS come from a spreadsheet I have and MIO is from a screen that populates automatically from a provider I use, you don't have to use these 2 columns necessarily but you could populate ALL STOCKS column with your own stocks and they will appear in the tab marked BOWLS CALCS automatically (I've thought of most things I think, I like to make things as straightforward as possible)
If you look at cell AF5 on tab BOWLS CALCS headed FOLIO, this you just copy and paste into a folio on stocko (the list of stocks in column T which is a list of all the stocks merged). You then copy and past the FOLIO back into the tab SCREEN FROM FOLIO so you can then get all the stocko data into columns Z to AC. Just make sure you have the same headings data when creating a folio.
It definitely works, Dialight (LON:DIA) for instance is a good one picked up (not necessarily on the screen now) which the master of Bowls Cockney Rebel has recently commented on.
If you make alot of money then I'll expect a % ;-}
Thank you Paul. I'm all good up until:
If you look at cell AF5 on tab BOWLS CALCS headed FOLIO, this you just copy and paste into a folio on stocko (the list of stocks in column T which is a list of all the stocks merged). You then copy and past the FOLIO back into the tab SCREEN FROM FOLIO so you can then get all the stocko data into columns Z to AC. Just make sure you have the same headings data when creating a folio.
I created a new folio in Stocko and copied cell AF5 which contains this =ARRAYFORMULA(CONCATENATE(QUERY(T2:T,"SELECT *")&",")) and this resulted in same output as on your shared spreadsheet. Is this correct?
Apologies but I'm such a noob on this stuff
Jon
No, you literally press Ctrl-C on that cell (don't press Enter b4 else you copy the formula), then Ctrl-V in the 'Add Stocks' screen in Folios
Mark, After reading this article I set my own screen up, using your criteria and one of the shares my screen returned but yours didnt was Focusrite (LON:TUNE) . I bought some on the basis of the article and being a novice, I could easily see a bowl.
Looking good so far, so thanks for that, but as always, not sure when to bail out, can bowls last for months, years?
Like any comments relating to TA(tech analysis) one’s views / are subject to the mass views. Many years ago I attended a seminar on TA and patterns. The speaker was very persuasive in the use of charts,but his final example was quite mind blowing. He projected 10 charts all of which started with a high point then hit a low point a few periods it the future then started to track north again. He has drawn a straight line connecting the high and low prices. He then waited 2 or 3 days then bought into each of the shares and at the time of his seminar and the prices were still tracking north. This a very simple method to use and I remember him finishing off with the claim that this was his most reliable system that he used . I use it (not religiously sadly) getting the timing right is critical! As they say let the trend be your friend. It can be used to for shorting stocks.
Fantastic article, Mark. Adding some maths and logic to what looks intuitively correct on a chart.
Loving combining this article with Ed and Phils' article on momentum. I'm not quite as strict as Phil on the momentum side as deep down I'm a turnaround hunter. Loads of potential candidates in the US market. Strattec Security (NMQ:STRT) NetScout Systems (NSQ:NTCT) Rigel Pharmaceuticals (NSQ:RIGL) are recent acquisitions.
Mark, you are going against the trend with this piece! It's Halloween and you are attempting to dispel the mists and voodoo that surrounds charting by using mathematics and logic. Good luck with that! It 's terrific!
Very interesting article - thank you. Apart from the name, isn’t this the same concept as O’Neil’s Cup and Handle (or without Handle)
Awesome article Mark. WRT:
"I remain slightly sceptical that chart patterns can be so predictive"
Some would argue that the chart is simply the sum of all knowledge in the market (including sentiment) and therefore can be predictive. Iy does seem that bowls are in vogue at the moment so a very well timed articel thank you.
if we agree that excess of buying or selling moves the price
and we agree that may frequent traders use tools like this to decide when to buy and selll
it would make sense to me that many may buy or sell around the same time
and if that happens that would move the price.
so in summary in exactly the same way as tipster works - if many people go to the bowl trending calcs and say this is a top buy and start buying that could move the dial - perhaps even more so as the direction of travel reinforces teh original assumption - eg some might wait but follow in soon after after the trend becomes more clear.
in summary as with tipster if similar volumes of peopel are buying and selling around teh same time that might move the dial in the direction they predict.
i possibly have not myself clear here. - in summary if enough people believe it (bitcoin can only go up) then that may happen till they dont belieb anymore.
The herd mentality. If bowls and momentum are in fashion then look for bowls with increasing momentum! As you say, it will work until it doesn't, but its a long game to go against the herd.
Mark said:
"One final criterion I need here is to ensure that the 6-month relative strength is actually slightly positive, and the recovery has begun:"
For anyone interested, I made a small modification to the screen, adding similar rules for both 3m > than 2% and 1m > than 1% to ensure the recovery has begun and not stalled.
PS, Great article Mark, thanks!!
Hi Mark,
How do you set up the advanced screening rule?
Like this:
And then choose the metric, in this case "compare"
Just as well Graham nudged me to sell Judges and buy SDI, and then top up. I also took a punt on Ecora. I do love Stocko and its boffins!
Great analysis thanks Mark! You lost me at parabola but an enjoyable read nontheless, look forward to hearing how others use it
Thanks JSchoffer, every time you see the word "parabola", then read "bowl"; it's the mathematical name for this shape of graph.
would be nice to setup a BOWL of the month thread - perhaps with picks to be added and removed to create mini BOWL portfolio - say have up to 12 stocks. throw any out that perhaps have bad news - or diverge too far. and then we pick the best replacement.
Any chance of a backtest?
I had already had a think about this (because, as I have already pointed out, I'm a natural sceptic when it comes to chart patterns!) It is tricky as we would have to have the ability to screen at various points in the past, then pick the smoothest bowls at those points, with the best upsides, without reference to the future performance (where it is all too easy to look ahead and pick the ones that performed).
So I think a backtest of the pure screen may be possible but not the rest. I'll see how easily it can be run by the data team.
Nice to see investors embracing one of my main tools for finding recovery plays that I've used for the past 15 years to great effect.
I knew I should have copyrighted and traded marked 'the bowl' :-)
Hi Richard,
I hope you will now include a line of best fit and some R-squared statistics whenever you talk about The Bowl(TM) :-)
Hi Mark,
This is really interesting.
Are able to describe the steps involved with creating the parabola and evaluating the r squared or point me to a resource that does?
Thanks
Phil
Hi Phil,
In terms of getting the share price data, the GOOGLEFINANCE function in Google Sheets or data download from investing.com is your best bet.
For data analysis, you can do it in lots of stats packages, such as Matlab, plus I reckon ChatGPT would do it for you if you uploaded the share price data to it and told it precisely what you want.
Personally, I find Excel the easiest.
- Select the data, and add a 2-D line chart.
- The right click on the series and "Add Trendline"
- Select Polynomial order 2 as the type (this is a parabola):
Then select Show Equation, Show R-Squared, and you have your parabola of best fit and R-squared statistic now on the graph:
- Finally, if you want to know what the share price might look like if it follows a parabola-shaped recovery, then you can use the Forecast Forward option:
You can tune the number of periods (days with daily share price data) to show what that would look like, and how long a potential recovery would take if it were symetrical with the decline:
Hope that helps,
Mark
Thanks Mark, that's a really detailed reply. I appreciate the time it must have taken
Hi Mark, another really interesting article! Would it be possible for Stockopedia to add "r2" as a filter for Screens? It often gets referred to in articles as a filter / screen.
Thanks TIBAR. Unfortunately, this is never going to be a screenable criterion as the R-Squared is a function of the data set chosen, i.e. the length of time and requires curve-fitting the data. So its not really something that can be done without a small amount of judgement as to the best timeframe.
I'll post how to do it in Google finance automatically soon, I'm on holiday at the mo
I'd really appreciate this when you have the chance - thank yo
Does stocko not have the required data?
Hi Prem14,
Stockopedia does of course have the share price data, but there's no current download facility. While I guess they could add it, it has quite limited uses, and while there are other free sources of the data such as google sheets, I'm not going to be pushing the tech team to add it.
HTH,
Mark
Mark, this is a superb bit of analytical work and I hope the stocks you own that are in this piece work well for you