Momentum Monday 13th February 2022

We talked last week about how things were more positive for charts. We also talked about zigs and zags and how they are a normal part of the investing game, and after so many up days/weeks, there has to be a pullback of sorts.
Our markets both in Australia and the US experienced very mild pullbacks last week. Not enough to cause us to worry… but we’re watching… always watching…
Before we commence this weeks report, as an FYI this Momentum Monday report has three sections:
Broader market sentiment
Stocks of Interest
52 week high screen
Broader market sentiment
S&P500
I read an article in the Financial Press which said in bold letters “The S&P500 has its worst week since December” - hardly surprising given since January it's really only gone up!
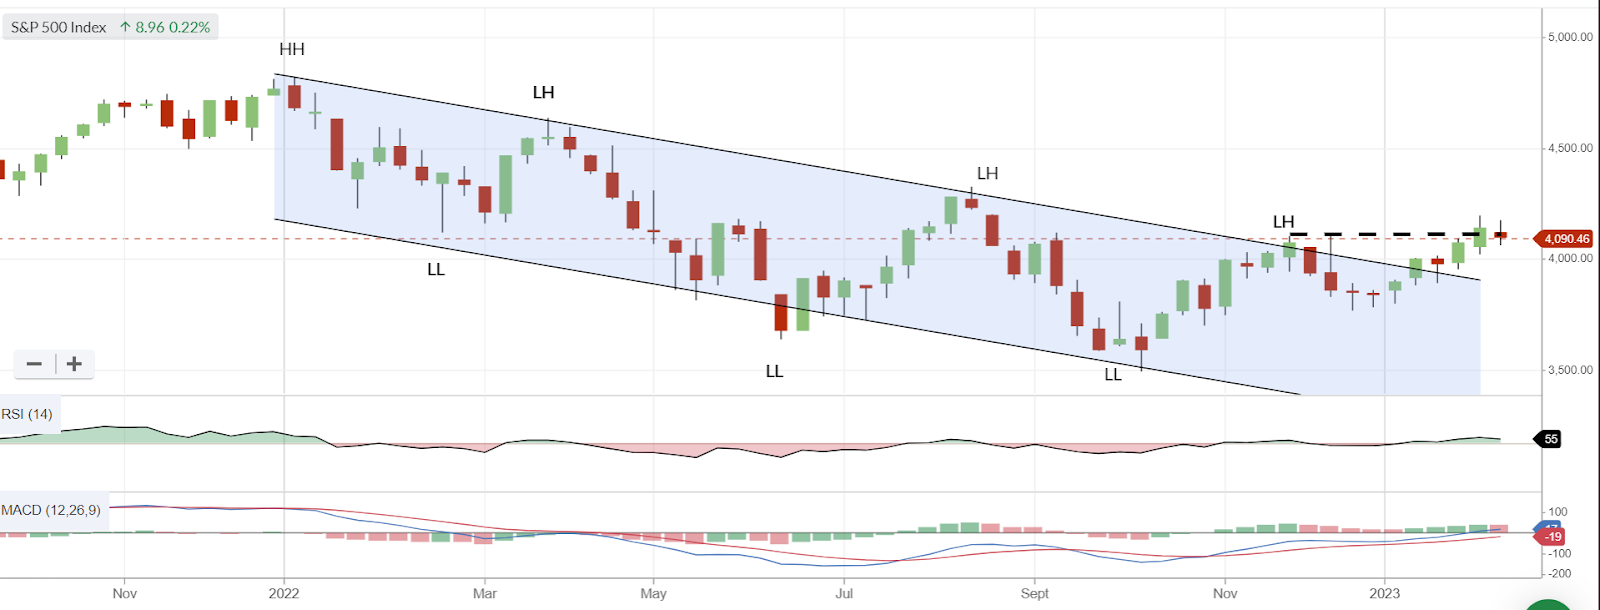
S&P500 Weekly chart
Overzealous headlines and the 1.1% decline aside, there continues to be a bit going on in the US market as earnings season enters its later stages. To date more S&P500 companies have been beating expectations than not for 4Q earnings according to Bloomberg.
From a macro perspective we also learnt US payrolls increased by 517,000 for January, nearly double December's total and almost triple the consensus forecast of 185,000.
This week there is only data point that matters, which is the official inflation figure (Consumer Price Index) as everyone will be watching to see how it will affect broader rate expectations especially as Fed Chair Jerome Powell has noted that while inflation is starting to come down, it still had a ways to go.
For interest, Economists polled by Dow Jones forecast a 0.4% increase in headline CPI on a monthly basis and for a 6.2% gain from the prior year.
Back to the chart, and there isn’t much that has changed relative to the prior week. Hopefully any retracement remains mild and that the last higher high from last week isn't the last for a while. I suppose for those worried of a pullback from here they will notice the mini-resistance level that has now formed given the index wasn't able to follow through, though I wouldn't add to much weight to it.... yet.
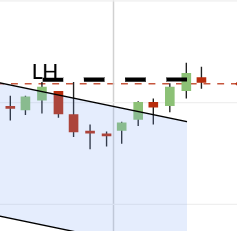
S&P500 3 month weekly chart
S&P/ASX200
This week the ASX200 shied away from the all time high resistance levels that it was moving towards.

Though the fact it has one down week should not worry or perplex investors, unless of course you are in the wrong stocks, which is always a possibility.
After all, though the broader sentiment from January to now is positive, there are still more stocks on the exchange that are closer to their 52 week lows than there are at 52 week highs. An interesting combination indeed.

What we are all now patiently waiting for is for the market to break through resistance at all time high levels at 7628.9.
As mentioned many times before, this level / range is key as it has been tested 3 times before.
The downside risk target is still 6500 if this latest move runs out of steam. But with solid indicators of both the daily and weekly chart, the upside scenario is still the most likely and will be confirmed once we break through resistance.
In corporate activity, reporting season is underway, and there is no more valuable time to have Stockopedia by your side than during this very important time of year. Once we receive the financials we will be updating our StockRank scores and you will have the latest insights into what is driving your stock’s returns. Now is NOT the time to take a break from your investments.
We also saw an interesting move by Newmont, the world’s largest gold miner who has lobbed a $24.4 billion all script bid for Newcrest Mining, the deal on the surface looks quite opportunistic and whispers are starting to mount that it won’t get over the line, though it looks like it may shake others out of the tree to make a firmer commitment.
As an interesting aside, Newcrest started as a division of Newmont in 1966, and actually listed on the ASX as a standalone entity in 1987. So if this deal were successful it would be a coming home of sorts.
Back to the charts, last week I mentioned we can buy stocks and we could even feel comfortable 'buying the dip'. However the dip is yet to be too aggressive and as always we advise investors to look for some sign of life in the charts before committing and trying to catch a falling dagger.
Stocks of interest
Tip: if you look at the list on the right hand side you will see the stocks mentioned within this week's contribution.
Caution: While there are a number of positive set ups, we are approaching the reporting season which can traditionally lead to more volatility on both the up and downside. These moves will be driven in large part by Fundamental factors making Momentum less effective. Investors should be mindful of this when looking at charts for the minute.
Author note: In line with the approach I am using with Stockopedia, I will focus the majority of my attention to stocks with a QM rating above 80 and market cap above $500M. To learn more please read the last instalment of my momentum journey here. I will discuss where their charts presently sit to provide context for potential and current investors.
These stocks are considered purely for the purposes of education. Be sure to read all relevant commentary to understand the context from which a chart is presented. It’s not always positive!
ASX:JHX James Hardie Industries. QM Rank 75 A$32.07
Remember what we have said that Dow Theory tells us….
“A stock is in trend until it is not.”
A client has requested an analysis on James Hardie Industries (ASX:JHX) who has been in a steady down trend since the company peaked in Dec21, and then subsequently gapped down to eventuallyl below the higher low of October 2021.

ASX:JHX 1 year daily chart
A series of low highs and lower lows have ensued and we are yet to see a break out of the trend. The stock is still going down at this rate.
The next significant level on the upside will be $36,73. The price needs to get above that level as it was the most recent lower high touched in August 2022. To the downside the price needs to hold the lower low level achieved in Dec22 at $26. If it doesn’t then I see possible target’s of $17.50, meaning that the $26 range would be a stop.
But let’s be positive for the minute. If the stock can hold the low of Friday (10/2) and bounce back up above the recent mini-high of $34.50, that increases the chances of a run to break $36.73. The stock has been running alongside other US construction materials businesses and hopefully the upcoming quarterly report due later this month supports the rebound and helps pull JHX out of its rut. But everyone will be looking at margins and if they can prove that these have stabilised there may be a reprieve for the stock who had a terrible 2022.
ASX:RIC Ridley Corporation QM Rank 98 A$1.95
Another edition to our “you won’t have to wait long till you know if you are wrong” files is Ridley (ASX:RIC).
Since the peak in September the stock made another tilt at all time highs, failed and has now fallen back into a sideways channel.

ASX:RIC 1 year chart
From the chart there is a pretty clear support line at $1.895. Given this is 6.5c from the last close, a break below that support line would be a good place to put a parachute stop loss level. If I was going to try to jump in early on this stock A break below that and a target of $1.70 comes into play.
My preference though is to wait until the price crosses above the ATR as a minimum before committing to the trade, and if I was feeling aggressive I would also wait for a breach of the mini low high of $2.06 seen in December and January. Until then I would wait for the price to breath.
ASX:COL Coles Group QM Rank 90 A$17.93
Consumer staples stocks have seen a short term renaissance in price as the defensive nature of earnings have seen investor shift their concerns from profit margins, to a basic ability to meet their commitments.
Coles (ASX:COL) is one such stock whose price in the near term seems to have bottomed as the creation of a new higher springs life into the price after what had been a tough six months.

ASX:COL 1 year daily chart
Since the peak of $19.38, the price had been in decline until an eventual low of $16.00 in November 2022. Since that point, the price has started to lift itself off the canvas with a key level of $17.23 was reached. Other than the fact that it created a new mini break above the previous lower high, it became resistance until the price eventually broke above it in late January 2023. The price has gone on to create a new higher high, and what was resistance has now become support.
The last few days of reprieve sees the price coming back closer to support, which traditionally are levels I like to buy. The price is also above the ATR and the moving averages are starting to converge with the 50 day EMA not too far from crossing back above the 200 day EMA.
If I was feeling greedy, I would hope the price could pull back closer to $17.60 offering a chance of better buying, with a break back above $18.13 confirmation of a possible re-run to $19.38.
As discussed above, a stop below support at $17.23 would be appropriate.
ASX:GNC Graincorp QM Rank 88 A$7.25
Last we spoke about Graincorp (ASX:GNC) was almost two months ago in the 19 December Momentum Monday article. At the time we highlighted, “If it (price) breaks below that level $7.85, then extreme caution is warranted. Therefore this level would be a good stop loss level.” Today at $7.25 the company is at another key level.

After breaking below $7.85, the price created a new lower high, and is now back down at $7.25 which is another lower low. If it can’t maintain that level, $6.60 comes into play as every investor who bought the stock in the past 12 months will now be in the red and may look to sell to cap losses.
I have revisited this stock to remind us all how structural levels of support/resistance can be powerful and should not be ignored.
ASX:CBA Commonwealth Bank of Australia QM Rank 89 A$109.95
In that same newsletter we discussed Commonwealth Bank of Australia (ASX:CBA) and I have included their chart again for the same reason.

At the time we noted that price had butted its head against resistance at $109 and we were looking for:
A break above $109.00 would be very bullish
Even if the price pulls back, should it stay above $94 that too would be a bullish signal
The pull back didn’t quite get to $94, however it stayed above it and the price is now above $109 and peaked recently at $111. All indicators remain positive and therefore meets our entry criteria.
Be sure to set an appropriate parachute stop loss for yourself. Structurally, the level of $101.05 would be a level where a stop could be set to protet yourself from any consumer armageddon.
But as I mentioned the last time I talked about CBA, “if you have held the business for a very long time, ignore what I just wrote, and enjoy the dividends!”
ASX:KLS Kelsian QM Rank 80 A$5.78
Another stock that has had a tough 2 years has been transport business Kelsian (ASX:KLS) however the price is starting to find a floor and the next moves will determine whether the improvement is sustainable or a ‘dead cat bounce’.

ASX:KLS 1 year chart
Put simply, the price has to break above $6.12. If it does so there is a chance it can get to the previous lower high level of $6.52 and if it can breach that, the target next becomes $8.05.
The problem with this potential trade is that should the stock fail to get above the $6.12 - $6.52 levels, the downside risk is quite large as the lowest low in October at $4.37 becomes the next target level.
ASX:SVW Seven Group Holdings QM Rank 83 A$22.990
Another stock coming to an interesting juncture is the industrial conglomerate Seven group (ASX:SVW) .

ASX:SVW 1 year daily chart
The most recent media coverage on the stock is that it has sold its 10% interest in Estia Health (ASX:EHE) which it was likely to sell at a loss frees up capital. Coupled with the improved performance from Boral (ASX:BLD), and the stock is now at close to 52 week highs.
The stock is currently bouncing around the $22.90 - $23.00 range and has been doing so since the start of the calendar year. This brings it to similar levels last seen 12 months ago. A clean break above this level will see a retest of all-time high levels about $24.40 and then it is clean skies ahead.

ASX:SVW 10 year weekly chart
It’s also important to see this in the context of a longer-term chart. The low of June 2022 was actually a higher low when compared to the low of COVID, therefore any break above all time highs will see the stock entrenched in a longer term uptrend. This will further help support price moving forward.
Do not however forget that the stock has a history of being very volatile, so don’t fall in love with the stock too much as it can move against you quickly as the 10yr chart shows.
A break above this range will be a positive signal for investors.
ASX:NCK Nick Scali QM Rank 92 A$10.10
Chris recently covered Nick Scali (ASX:NCK) from a fundamental perspective and members can read his insights here.
But it doesn’t take a lifetime in finance to figure out that the market didn’t like the result, despite the numbers looking OK.

ASX:NCK 1 year daily chart
So what do we do now from a charting perspective?
Well if I was not holding it and I like the fundamentals I would:
Wait till price crosses back above the ATR as a minimum (currently $11.08 assuming the price doesn’t fall further)
Prefer that the price did not fall further from here and that $10 remains the floor price
As I am holding this is what I will do:
As the price has broken below the ATR I know need to look for my exit level. So I would look for structural support
If I had been in this stock for a while I would stay in for as long as the price stays above $9.175.
As I only bought the stock more recently, then it is right at the stop loss level now, another down day and I would be out.

ASX:NCK 6 mth daily chart
ASX:WHC Whitehaven Coal QM Rank 99 A$7.74
Another stock I will likely be exiting on Monday is Whitehaven Coal (ASX:WHC) . We only spoke about WHC last two months ago and this is what I wrote:
“However, I have been in the stock for a while so I am going to be a little more generous and place my stop below $7.91 which coincides with the low of September 2022. I suspect this will be an important level because it will be the start of an official downtrend given the highs of December were below those of September, and therefore a breach of $7.91 will create a new lower low (LL).”
On Friday the price broke below that level

ASX:WHC 1 year daily chart
However, this will not be the end of the WHC story for me. Even when I sell, I will have it in my watchlist and I will be looking for a possible reentry point given the positive medium term view on the sector and those lovely dividends.
So it goes onto my watchlist and I look forward to getting back it as a point where the price is right (EVEN IF IT IS A PRICE HIGHER THAT WHAT I WILL LIKELY SELL IT AT.)
ASX:CLW Charter Hall Long WALE QM Rank 80 A$4.57
I stock that I like fundamentally, who is starting to see a base in the recent sell off it Charter Hall Long WALE REIT (ASX:CLW) . The property trust like its othr counterparts has seen big declines as concerns around raising rates and falling property prices have impacted the sector.

ASX:CLW 1 year daily chart
Why do I like it fundamentally? A recent presentation confirmed why with the company reminding everyone they have Blue Chip tenants occupying 99% of their properties, they have a weighted average lease expiry of 11.8 years and an NTA of $6.23. Even with property price pullbacks the current price doesn’t have too much steam in it so it should be able to accommodate. And a dividend yield above 6% certainly helps.
Price wise, I am starting to like it better. Following the lows of late September/Early Oct, the price has steadily risen and now finds itself at support/resistance which coincides with the top end of the channel range last seen between June and September 2022.
As the price has pulled back from the initial break, it has come back into the buying zone and if it holds support I will be in again.
If it falls below support, then it will likely breach the ATR and I won’t be buying for now as the price could be choppy. The fact that the price fell for 5 consecutive days shows you how the fortunes of stocks in the sector can change quickly - despite a very positive interim report.

ASX:CLW 3 month Chart
Any suggestions?
If there is any company you would like to see written about? Do you have feedback on this contribution? It would be most welcome as we want to ensure that you receive editorial content that is most relevant to your investing.
Please feel free to write any comments below.
While we guarantee that all feedback will be read and digested, there is no guarantee that we will accept them. Though we do have an open mind at the minute.
52 Week High screen
Academic Research has shown that stocks close to their 52 week highs tend to outperform.
To that end I have attached the results of a screen run within Stockpodedia showing every stock above 200 million market that is trading at least 5% from its 52 week high. (If you wish to recreate this criteria in the scanner select "Price vs 52 high" greater than -5%)
This has not considered liquidity of the stock nor does it consider its fundamental qualities. However we have included each factor score to help you.
Data is at 10 February and is sorted by the stocks closest to their 52 week high.

Important Information: Stockopedia Ltd ABN 39 757 874 670 UK business registration number 0637267 (“Stockopedia”) is an Authorised Representative of Daylight Financial Group Pty Ltd ABN 77 633 984 773 (“DFGPL”) which is the holder of an Australian Financial Services Licence (AFS Licence No. 521404).
Information in this commentary is current as at date prepared unless otherwise stated. However, please bear in mind that investments can go up or down in value, and that past performance is not a reliable indicator of future performance. For more Important Information please refer to the Disclaimer section of this website.
This communication may contain general financial product advice. It has been prepared without taking into account your personal circumstances, and you should therefore consider its appropriateness in light of your objectives, financial circumstances and needs before acting on it.
If our advice relates to the acquisition or possible acquisition of a particular financial product, you should obtain a copy of and consider the Product Disclosure Statement (PDS) before making any decision.
The author holds interests in the following stocks mentioned in this article: CBA, WHC, NCK, . This position can and will change at any time without notice.
Disclaimer
This is not financial advice. Our content is intended to be used and must be used for information and education purposes only. Please read our disclaimer and terms and conditions to understand our obligations.
2 comments
@ Paradigm Biopharmaceuticals Ltd. (ASX:PAR) is a late-stage drug development company driven
by a purpose to improve patients’ health and quality of life by discovering, developing, and
delivering pharmaceutical therapies. Paradigm’s current focus is developing injectable
(subcutaneous) pentosan polysulfate sodium (iPPS) for the treatment of diseases where
inflammation plays a major pathogenic role, indicating a need for the anti-inflammatory and
tissue regenerative properties of PPS, such as in osteoarthritis (phase 3) and
mucopolysaccharidosis (phase 2). I find momentum Monday and excellent source of information .
Thanks Graham
Thanks for sharing Graham. If you wouldn't mind please add PAR into the February Village Square (just so that these are in one place) Here is the link to the article Just we can keep it all in the one easy to access place,
And thank you for your feedback... though as an old line manager told me back in prehistoric times. (ie pre mobile internet) ... "If there is something to improve, please tell us ASAP. If there is not, then please tell others!"
Thanks again Graham!