Momentum Monday 9th September 2024

Welcome to Momentum Monday.
So it was a tough week. Last month saw a tough start to the month too. Does a volatile market mean that we are at the end of the Bull Market?... Maybe. Am I going to try to predict it? No.
I will just wait for the charts to tell me whether I need to do anything or not. Remember… those investors that avoided much of the GFC did so not because of a special formula … rather it was because there wasn’t a single indicator known to man that didn’t say ‘sell’. Sure the exact points may have been different, the broad narrative was still the same. And as a Momentum investor during that time it was risk-off. So if your charts weren’t 100% you suffered a big drawdown. Even if you were tempted by that mini-rally that happened in April-May of 2008, respecting the chart still saved you a lot of pain, meaning you could live to fight another day and thank heavens if you could.
Interesting links
This week on Weekend Watchlist run in conjunction with Shares for Beginners, we discussed PME Pro Medicus. Listen here to the replay. It will take a break for a month but past recordings remain available.
You can now book your place at both the next of the Mastermind Investing Series with Ron Shamgar (he has outperformed the market strongly as a Fund Manager.. so you don’t want to miss this no matter how good you think you are!) Register here
Our next Friday ‘Lunch n learn’ session can also be booked now.Register your spot on the virtual table here
Don’t forget to “Empower Others”. There is no better time to refer the award winning platform which is Stockopedia than just after a reporting season. To Learn read more here
For any external commentary we make to the broader market, follow us on Social Media Facebook Linkedin Instagram or X (formerly Twitter) Some of you already have so ‘Thank You’ for that.
This week’s content is as follows:
Broader market sentiment
Member corner
Stocks in the “Shine Zone” (including changes)
Momentum Movers
52 week high screen (including changes)
A reminder that you don’t have to read all this contribution. Simply scroll to the area of interest.
Broader Market Sentiment
We look at the direction of both the US and ASX markets to gain an understanding of the broader sentiment at the minute. It is important to stress here that I DO NOT use this to time my entry or exit out of stocks. I prefer to use the individual charts of stocks to do that. However I find it useful in helping us determine how aggressive/cautious traders should be in their trading. In short the more positive the broader market is the more risks you can take and vice versa.
US / S&P500
It was the worst week for the broader S&P500 since March 2023 as it fell 1.7% on Friday and 4.3% for the week. Interestingly “bad news has become bad news” again.

S&P500 Weekly chart
While it's never precise, the reason given for the latest sell off was attributed to the old argument that perhaps the Fed left rates too high for too long and therefore may have manufactured a forced slow down. The latest data that confirmed this idea was non-farm payrolls which saw new jobs created come in under expectations even though unemployment fell a little. I suppose everyone is desperate for news to cling too as to reasons for the next market move. The Federal Reserve’s recent decisions have for the moment become that focus. What they do (or don’t do) next will be a focus for sentiment one suspects. Remembering everyone ‘expects’ a rate cut this month.
But such index moves can't be ignored and they won't be. However they are not to be acted on. Could this be the start of the end? Maybe. But then it could be just a zag with a bigger zig to come. At this stage we just don't know.
It will come as no surprise that Mega cap tech stocks were amongst the primary stocks to fall. Even the once prized semiconductor businesses took a breath throughout the week amid mounting worries about the health of the U.S. economy. As the sector has seen its importance to the broader index has grown over time, this should come as no surprise.
It is also interesting to note that last month we started with a big sell off in US Markets as well so it will be interesting to see if we repeat that past performance. It took a raft of positive economic news to break the downward move and I suspect it will take the same. But it won't just be positive that we are looking for. It is ‘better than expected’ that will move the dial.
Last week I talked about oil prices. Well this week we basically saw the end of any gains made through 2024 eroded. Notwithstanding the unease in the largest oil producing region of the world, oil prices have moved to the beat of their own drum. Particularly as the expected slowdown in economic activity in China bites (Something Metals investors know all too well.) This in an environment where OPEC+ has further delayed plans to increase production by 180,000 barrels per day until December. For those wondering, the lift in output will bring about 2.2 million barrels per day back onto the market which is not great in the current climate. While it is far too early to suggest that we could return to negative values, a phenomenon that has only happened once in oil’s history before, we are not at critical storage levels therefore this is unlikely to happen now. But as Chinese activity slows and they move more and more towards adopting electric vehicles, this is something investors in Crude will need to remain conscious of.
But all this is noise for the moment. The reality is that the index fell in the US and therefore we will see what happens. That said, my watch and act level remains at 5151 so I see no reason to change my focus globally at the minute. Although perhaps I should read that Wells Fargo report more closely that I briefly referenced last week? (PS That is a joke.)
AUS S&P/ASX200
Had it not been for Wednesday’s trading session, it was more of a positive week, than a negative one. But the numbers are what the numbers are, and therefore it was a negative week. The first after 3 positive weeks.

Actually the rebound on Thursday and Friday is commendable, especially with Iron Ore prices now seemingly destined to hit US$90 per tonne and the financial sector facing stiff competition internally.
The first point above is an issue that I feel will drive markets. I mean we (investors and observers) are all well aware of the Lithium and Nickel price correction. But if Australia grew on the back of the sheep’s back, we now survive and thrive off the red rock removed from the ground and export elsewhere. That said, as commodities stocks drop - the importance of financials stocks rises. And with a much better regulatory regime around them, perhaps they are perceived as safer for the moment?
Politicians resigning from big spending departments is also not helping sentiment. Although I had to laugh when Treasurer “Cheery” Chalmers put the blame on the RBA for keeping rates higher for longer, when it was actually increases in government spending that kept GDP in the black this latest quarter. Too funny. That said, there seems to be no movement from the Central Bank here to cut rates anytime soon and therefore this needs to be considered when looking at the health of the Australian consumer.
But in all seriousness, the size of the mining sector and its importance to our market and GDP means that we should be watching here for what is likely to happen next from our market’s perspective. And here I am talking about the big guys… not the long tail “Rats ‘n Mice” businesses. They operate (I should call it that) predictably. I mean look at GED Golden Deeps. They announced that they found some Zinc and Copper rockchips at one of their sites. The share price flew. The next day they went into a trading halt to do a capital raise and the price has plummeted. This opposed to Strike Energy - who are self funded and have just uncovered the deepest ever onshore oil well in Australia and the price fell. See… some things are still predictable even in this crazy mixed up world.
It was also interesting to see that the big sell off on Wednesday, and this more broadly this week, also coincided with a similar big pullback one month earlier. Will the pattern remain where we see a bounce in the remainder of the month? Well it will be difficult without the influence of a reporting season behind it - but again never say never. In my view it is less about predicting than it is actually sticking your head out the window and assessing the weather for yourself. Remember a cash is a crash when no one expects. You get no crash if everyone is predicting it.
The other big theme was the $24Billion paid for once Australian Start-up AirTrunk. Though Blackstone has made this latest bid, the stock has been on the market before. Though with COVID long behind it, somehow the internet is more valuable today than what it was back then. The premium paid also flowed on to listed entities like NextDC and Goodman Group have good days since the announcement. And my challenge that I have had out there for the last 20 years is still unanswered. Though I await the day someone can convince me the internet will become less of our lives in a decade’s time (yes I have had this challenge up since the day I starting working as an analyst. - to everyone’s credit, no one has fought against me on it).
But back to the chart and notwithstanding the pullback there is really not much more to add. My ‘watch and act’ level is still at 7547 and some recent aggressive trades I have made have worked out well to date. But one (or a few) sparrow don't make a summer, therefore one cannot rest on their laurels yet. It’s why (as Momentum Investors) we have stop loss levels after all.
Member corner
In this section we will provide a detailed chart assessment, on a maximum of ten stocks weekly, on companies from those of you in the Gallery.
We welcome stock requests to be analysed from members. We will also be looking at the charts of some of the more actively researched stocks for the week. We will try to rotate through a selection so as to not make the charts stale, however we will likely not cover a stock within 2 months of when it was last discussed.
If you want to see what has been written about a stock recently, go to the discussion area.

We will not be making up suggestions. If there are no changes to the most viewed list and/or there are no suggestions from members, then no stocks will be covered.
To learn of the methods used to analyse companies in this section, refer to my Momentum Journey series that I articulate here in three parts.
They will help provide context on what I am writing about and the editorial angle of this report.
Also look at the market capitalisation and liquidity before making any decisions!
And again, if you have a stock you would like analysed from a momentum perspective, please write it into the comments section below or email us at support@stockopedia.com.au
IF NO ONE ASKS… HOW AM I SUPPOSED TO KNOW?!?
ASX:VYS - Vysarn Limited
StockRank 85
Momentum Rank 92
QM Rank 98
VM Rank 72
A$0.46
A member has asked that we look at Vysarn (ASX:VYS) from a Momentum perspective, which we are yet to do. From a liquidity and size perspective it is not quite appropriate for me, but a chart like this can’t be ignored, and we should all be thankful it is presented to us.

As you can see on the chart, it has really taken off in the last year and is currently trading at all time highs following a series of higher highs and higher lows. Further there has been an obvious pick up in volume as more start to look at the business.
As it says in Stockopedia, the company is a water service provider, so it is in the right space for this arid land. The most recent bounce has come from $7,5M acquisition of Water Waste Services, which was not only bought on the cheap, not only does it further verticalize the business, but it also brings a raft of tier 1 companies into the stable including BHP, RIO and others.
The merits of the acquisition will be assessed by the market in time, but looking at the chart and it is suffice to say, the market likes it.
Even before the acquisition, which the company feels could be a strong contributor to earnings in time, VYS was improving as sales and profits were consistently rising. No better emphasised by the Quality Rank improving over time. In terms of Outlook, the company expects sustained year-on-year growth which is a tick.
From the chart perspective a s previously mentioned it doesn’t get ,uch better than this. For traders you may have a stop at $0.365. For investors however I see $0.28 before a change in their general disposition. As for upside targets, the stock is trading at all time highs so there are none at this stage.
As previously, mentioned it’s too small for me, or the Shine Zone at the moment. But the chart looks very promising and well done to the true believers in the business.
ASX:SRG - SRG Global Limited
StockRank 99
Momentum Rank 97
QM Rank 99
VM Rank 98
A$1.03
The last time we looked at SRG Global (ASX:SRG) from a momentum perspective in March I said, “From a chart perspective my eye looks to that $0.805 all time high in 2023. I would like to see it eventually breached and then look to buy on a pullback from there.” So that is what I did. Incidentally you can read that past commentary here .

ASX:SRG 1 year Daily chart
So what levels am I looking at now? As previously mentioned I am a fan of the business, but not the industry and therefore I am in this for a trade. The pullback from 52 week (multi) highs is normal. Though interestingly the price rose not only on the ex-div date but for a week after as well. This was quite unusual behaviour especially for a stock that pays a reasonable dividend.
Anyway we can see the gap and as a trader I will keep my stop at $0.915 which is what the stock closed at following the profit result and the acquisition of Diona, the Water and Energy Servicing business. This has to be kept in mind though with the $0.83 cps SPP which I have participated in order to not be diluted too much.
On the upside, as I mentioned it had hit multi-year highs and if you hadn’t held the stock till now then you would wait for it to cross back above $1.09 before committing. Upside targets would be based on the previous all time high back in 2011 at $1.70. Above that the sky is the limit.

ASX:SRG 10 year Monthly chart
Though as mentioned your exposure to this business will depend on a range of factors though traditionally I am wary of taking a long term view on these type of businesses.
ASX:MIN Mineral Resources Limited
StockRank 51
Momentum Rank 21
QM Rank 47
VM Rank 31
A$30.65
Unsurprising that Mineral Resources (ASX:MIN) has been looked at by many members. You would have to living under a rock not to know what has happened to Lithium and Iron Ore prices since we last spoke about them, which we did at the start of the year and you can read that piece here

ASX:MIN 1 year Daily chart
I was no island in suggesting that the stock was in a downtrend. I also mentioned that I hope my downside target of $42 is not hit, yet here we are…. $10 below that level.
MIN is a price taker and that has done it no favours recently. In its latest annual result this was crystal clear for all to see as the solid production profile was not supported by prices in the commodity they dealt with.
I said at the time the chart looked bad and I wouldn’t look at them again until it crossed back above $64. Well it actually did that and ran up to close to $80 creating a new short term higher high, but since then the price has collapsed under the commodity price pressure (especially for the last fours weeks) and therefore any trader would have likely broken even.
With the price is low and the knowledge that these types of businesses are cyclical, there may be some value in trying to pick the bottom here. But the chart doesn’t support that, and with the share price back to where it was in late 2020 there is nothing screaming buy for now. I will not revisit the theory from a trade perspective until it at least creates a new lower high. So basically what I am saying is that there is a long time that traders have to wait before considering the business. Investors on the other hand?… well hopefully the run to US$90 per tonne in Iron Ore and Lithium trading at 2021 levels is the worst of it.
ASX:REA REA Group Limited
StockRank 62
Momentum Rank 75
QM Rank 91
VM Rank 35
A$204.66
A lot of water has passed under the bridge since we last wrote about Rea (ASX:REA) from a momentum perspective early last year (which coincidentally you can read here if you are interested.) Long story short, if it broke out from the then sideways channel, and then pulled back, that would be a buy signal. And it did just that.

ASX:REA 1 year Daily chart
Since then a series of higher highs and higher lows, all the way to all time highs have followed and this is a stock that has done well from a Momentum perspective. But what now? Keen followers of the stock would have noted the recent pullback which has come about as speculation builds that REA will make a formal bid for Rightmove in the UK. While it is too early to say if this will come to fruition and whether there is truth to the rumour, the speculation has seen many take their profits and go home. Because let’s face it, there are not too many UK/Europe acquisitions that go well for Aussie businesses. I don’t have the time to cover all of them (Google it - But think of Wesfarmers/NAB/Slater & Gordon etc etc etc) but suffice to say in the opinion of many, acquiring in the UK is where good Aussie business go to die.
There was of course the stock going ex-div which didn’t help sentiment either, but as the yield is negligible at these levels, I think the former is more the issue.
So where to from here? Well if you have held the stock on the run up, notwithstanding whether the UK move eventuates or not, then your sentiment will change if it crosses below $189.22. While that is a fair bit of draw down from the peak, I feel that it is justified given the strong run up it has experienced.

ASX:REA 5 year Weekly chart
If however I have not held them, then now can be a dangerous time to get in, given the uncertainty around a move into the UK. (Though to be honest no proper assessment can be made until it is sealed, signed and delivered with a few months of monitoring to boot.) Basically I would be waiting for a new all time high to be created, which means it has to cross above the previous all time high of $220.49. If you are looking at monthly charts, this comes down to $219. But you get my drift.
Basically the success or otherwise of this business will be reflective of their performance in the UK should they pursue it. If not then this is just a standard pullback from all-time highs in my view.
ASX:SHA - SHAPE Australia Limited
StockRank 99
Momentum Rank 99
QM Rank 99
VM Rank 99
A$2.64
I noticed over the weekend that members were also looking at SHAPE Australia (ASX:SHA) . We last discussed SHA from a Momentum perspective back in February this year. Members can read that commentary here.

ASX:SHA 1 year Daily chart
Back then I said, $1.96 would be a resistance level and shares coming out of escrow may be a headwind. I was wrong on that count as the price breezed past that level in April and has since kept going as the price moved to an all-time high. One of the benefits of a stock that is not regularly traded (but there is another side as well so always remember that.)
SHA is a national construction services specialist, and therefore my past comments on the sector remain. That said, in July they announced a significant amount of work on hand, and the latest annual report was a good one as evidenced by the strong overall StockRank rating. They were keen to remind us all that a high percentage of work comes from repeat clients reflecting trusting relationships and a more stable earnings base. They also stressed that while they maintain office exposure, project wins in non-office markets now account for approximately half of their order book, compared to 25-30% a few years ago.
The stock is too illiquid for me to trade, but the chart looks extremely decent. Especially that recent pullback was because the stock went ex a sizeable dividend. There are really no upside targets as we are trading near all time highs now. A stop loss level is not required on a chart that looks like this until $2.14 (or between $2.35 - $2.37 if you are worried about the size of the drawdown)
A final note on these illiquid stocks. If you are enticed into them remember…. You are in it for the long haul or, you shave at least 5% from the stock’s performance to compensate for the hit you will likely take if you want to get out. Don’t blame me…. It’s just how markets work.
Stocks in the Shine Zone
To learn about the Shine Zone and how to use it, you can read it here.
The rules for inclusion in this list are based on those I like to see in a stock before considering a trade in it:
QM Rank above 80
Price is above the 2.5x ATR
50d MA is above the 200d MA
Price is greater than the 200d MA
Market cap greater than $200M
This is a very important point: the “Shine Zone” are rules for possible buying. They are not for holding and/or selling. If a stock falls out of the shine zone, use support levels to set your stops, or instigate a parachute stop if necessary. With markets moving sideways, one expects frequent changes in these lists.
If you feel there is a stock that should be included but is missing please let us know. This is a manual process and occasionally one gets through the cracks
Also look at the market capitalisation and liquidity before making any decisions!
Data is at 7 September and is sorted by the stock code.
Changes from last week
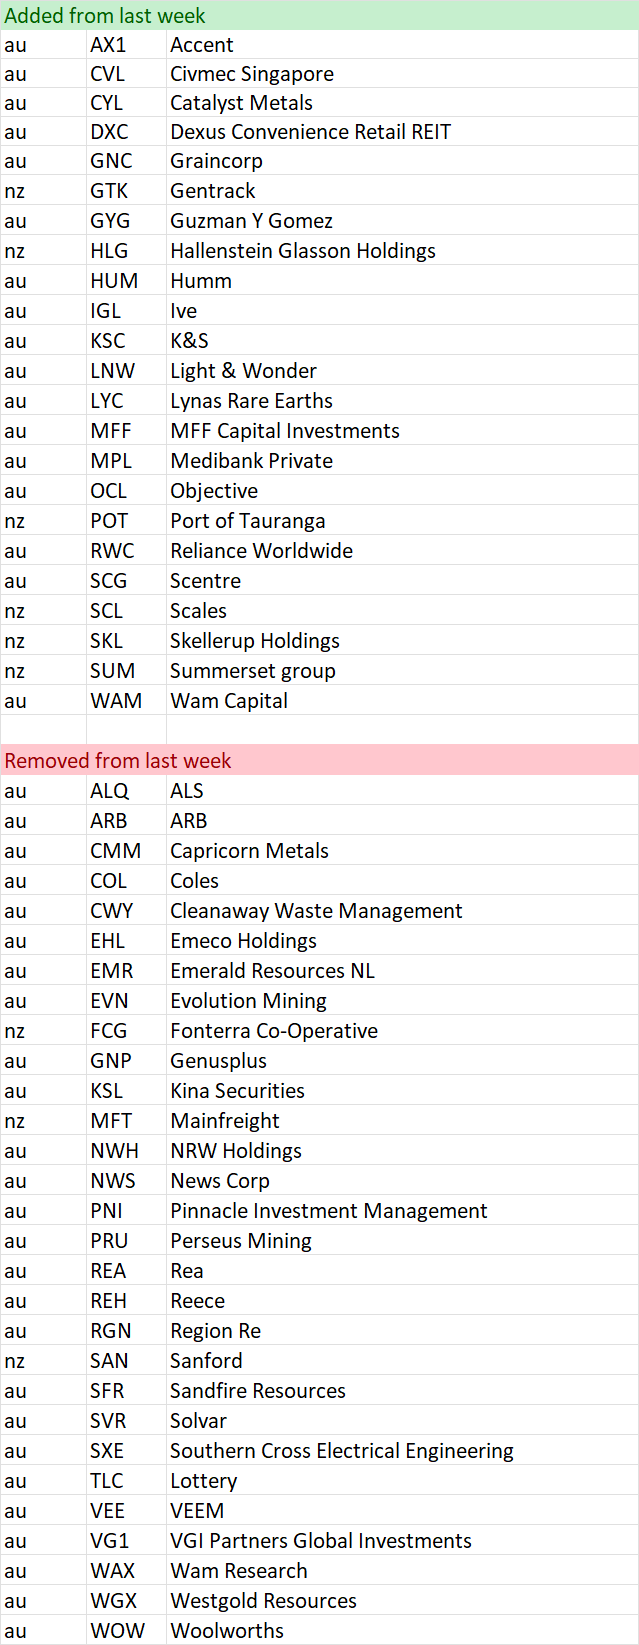
Shine Zone list as at 7 September

Momentum Movers
I have actually published an article discussing my thinking with these tables. You can read about it here.
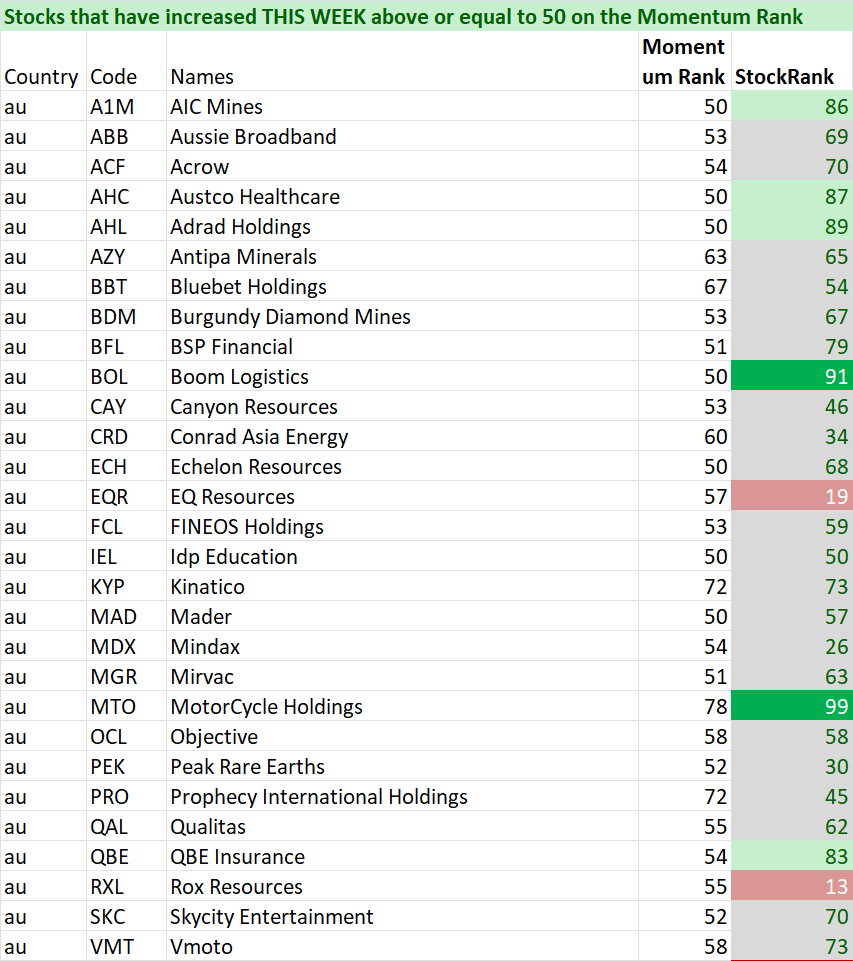
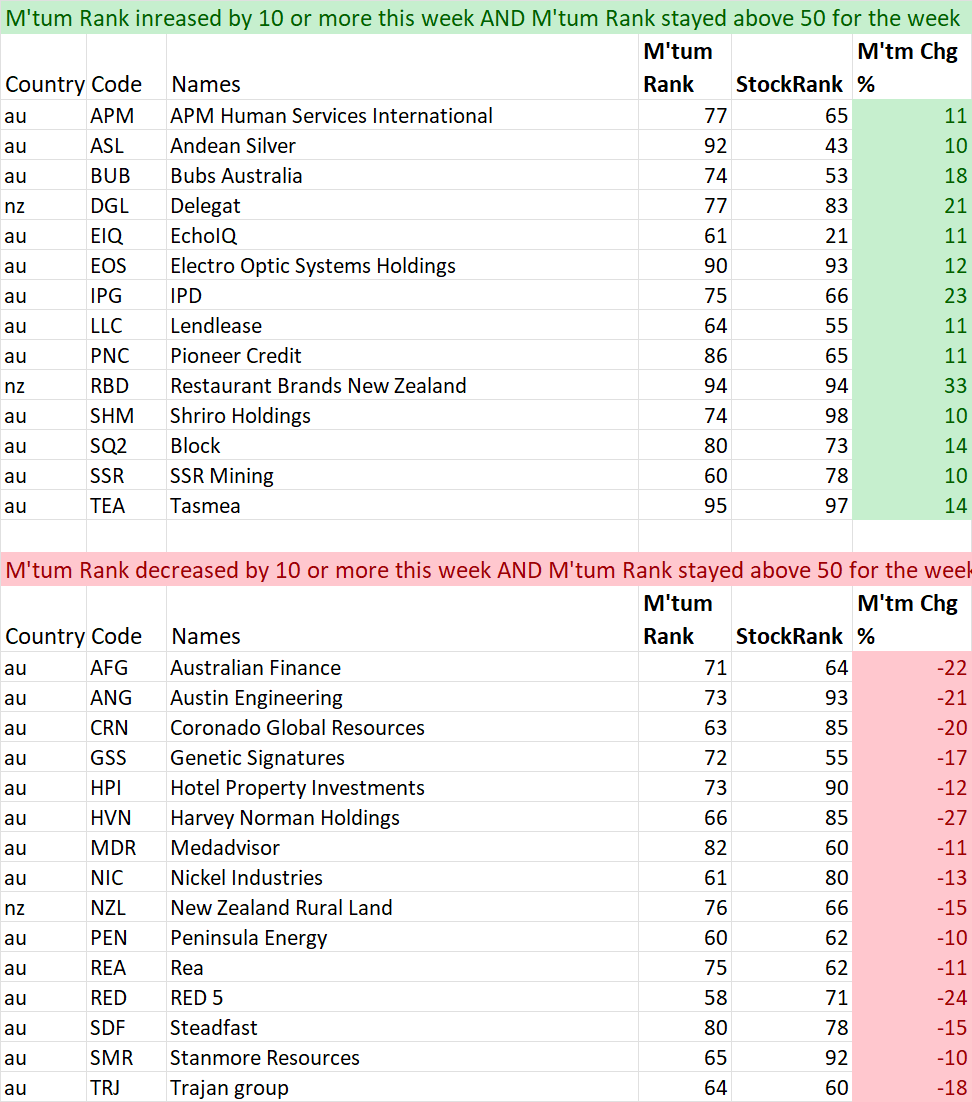
In summary, there is a school of thought that the change in something is just as important as the absolute number itself. Momentum is our most volatile ranking. This section is intended to bring to readers attention the big moves from a Momentum Perspective. As with other lists this is not designed to be a list of stocks that are replicated. Rather it can be a starting point of investigation for further consideration. Initially it will record weekly changes. This will include a monthly change when enough time has elapsed. This section is divided into two lists.
First is a list of stocks that have just crossed above 50 from a Momentum perspective. By definition, these will be stocks that have improved over the past week and month and may warrant further investigation. As a bare minimum a look at liquidity and market cap.
The second list measures all stocks that are currently ranked above 50, have remained above 50 during the time periods analysed (ie not just added or removed) AND whether they have improved or worsened by more than 10 points on the Momentum Rank.
With all filters a minimum market cap of $50 Mil has been included to help ensure investability from a small perspective. Be sure to check liquidity relative to your preferences.
As this is a new list we welcome any feedback you may have. If we have missed anything do let us know.
Data is at 7 September and is sorted by their code.
And remember, past performance is no guarantee of future performance.
Weekly Tables (the past week) For last month’s tables refer to the MM from 2nd September
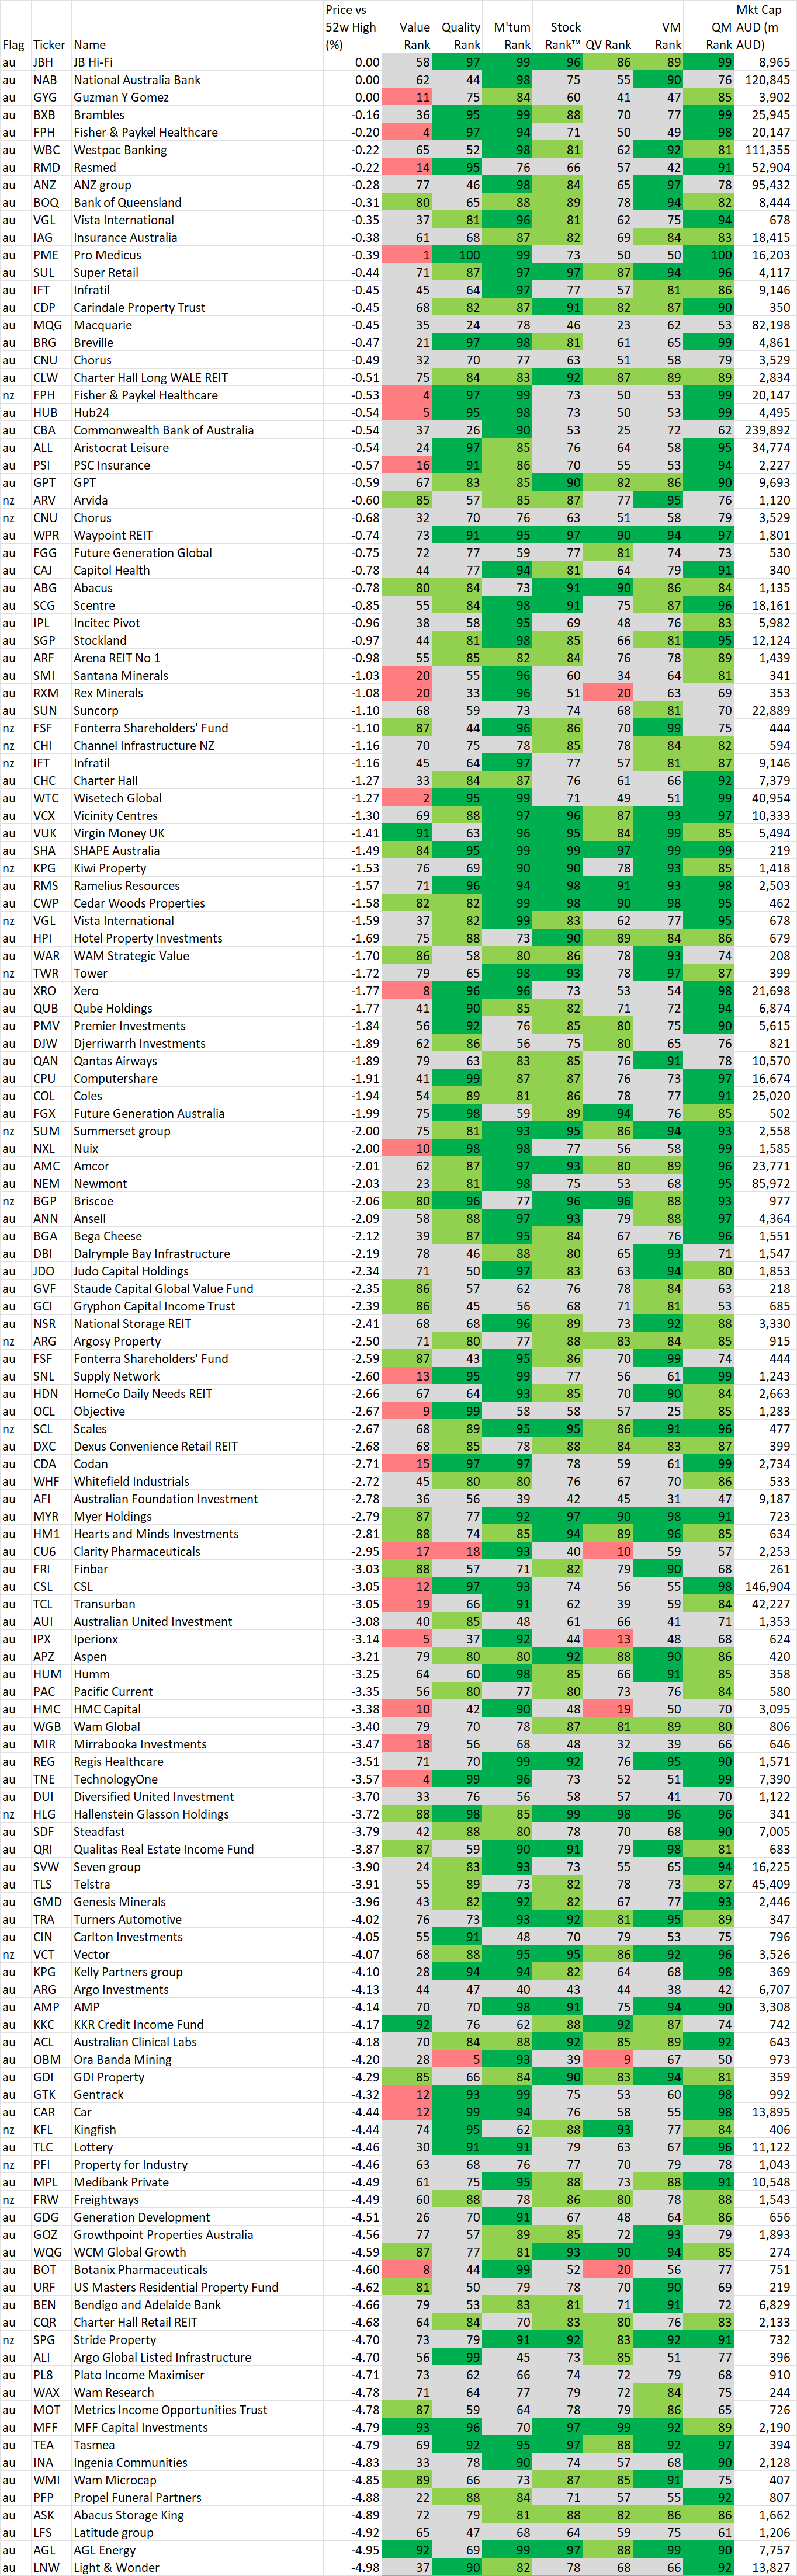
52 week high screen
In this section we identify stocks within 5% of their 52 week intraday high based on the idea, supported by academic studies, that stocks close to their 52 week highs tend to outperform. Weekly changes to the list will also be noted.
If you wish to recreate this screen in the screener select "Price vs 52 high" greater than -5% and Mkt Cap greater than $200M
A stock coming onto the list is NOT an automatic buy, just as a stock that leaves the list is NOT an automatic sell. As with the shine list, assess every chart on its merits. However movements on this list may alert you to interesting charts so be sure to look at Stockopedia and the chart first.
Data is at 7 September and is sorted by the stocks closest to their 52 week intraday high.
Also look at the market capitalisation and liquidity before making any decisions!
And remember, past performance is no guarantee of future performance.
Changes from last week
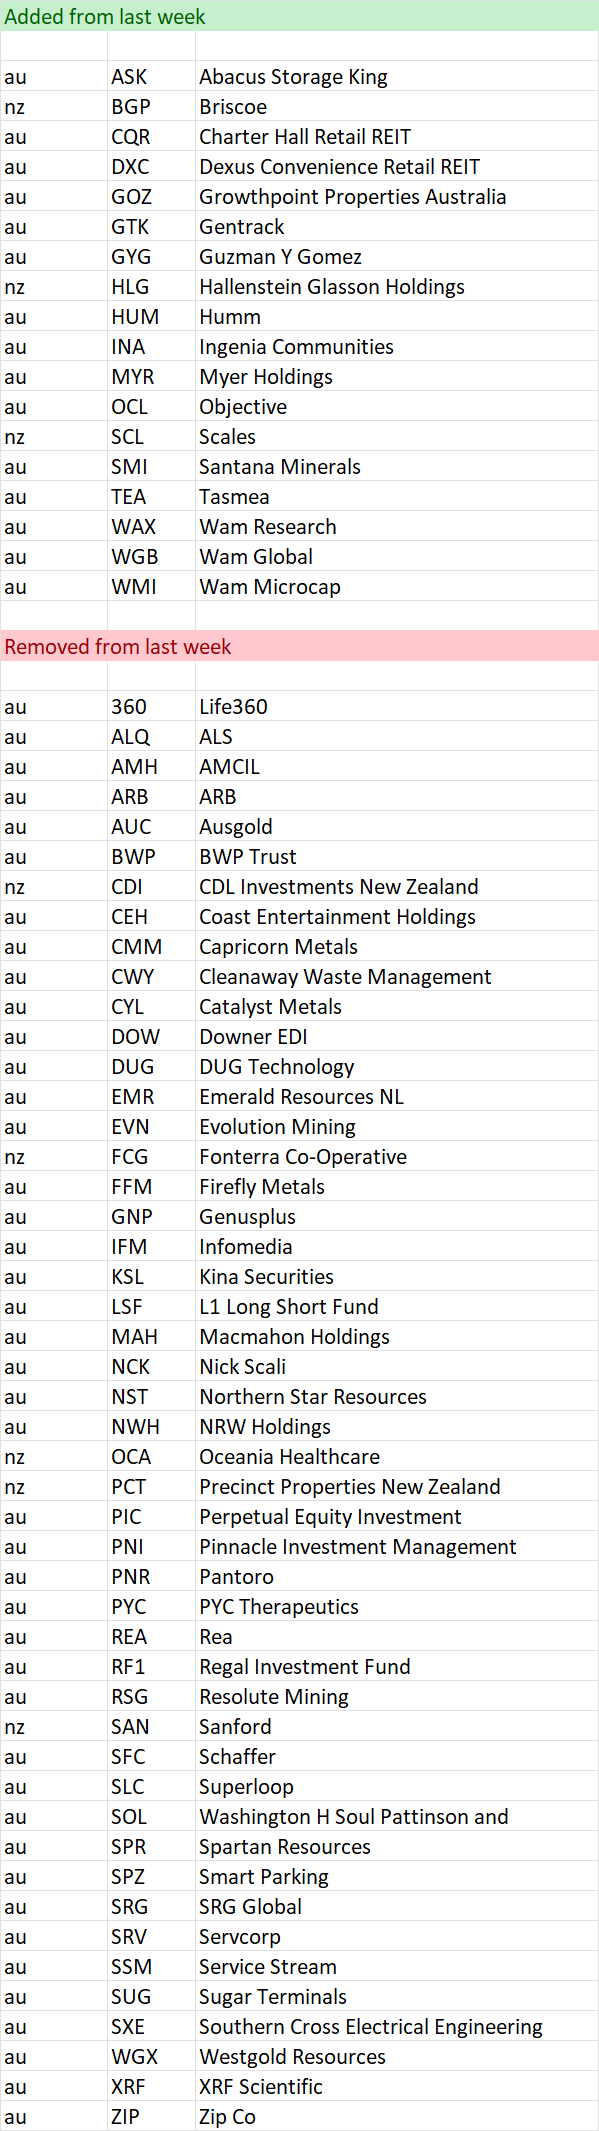
Stocks within 5% of their 52 week high as at 7 September
Important Information: Stockopedia Ltd ABN 39 757 874 670 UK business registration number 0637267 (“Stockopedia”) is an Authorised Representative of Daylight Financial Group Pty Ltd ABN 77 633 984 773 (“DFGPL”) which is the holder of an Australian Financial Services Licence (AFS Licence No. 521404).
Information in this commentary is current as at date prepared unless otherwise stated. However, please bear in mind that investments can go up or down in value, and that past performance is not a reliable indicator of future performance. For more Important Information please refer to the Disclaimer section of this website.
This communication may contain general financial product advice. It has been prepared without taking into account your personal circumstances, and you should therefore consider its appropriateness in light of your objectives, financial circumstances and needs before acting on it.
If our advice relates to the acquisition or possible acquisition of a particular financial product, you should obtain a copy of and consider the Product Disclosure Statement (PDS) before making any decision.
The author holds direct interests in REA, MIN and companies listed in the data tables . This position can and will change at any time without notice.
Disclaimer
This is not financial advice. Our content is intended to be used and must be used for information and education purposes only. Please read our disclaimer and terms and conditions to understand our obligations.
No comments yet
No one has commented here yet! Why not be the first one?