Profiting from market panics

The last 20 years have provided a number of times when UK stocks have sold off aggressively. They are clearly visible on the graph of the £MCX index as points of short, sharp reversal:

(I’ve chosen the £MCX since this is an index that tends to reflect the UK economy more than the more global £UKX, which is dominated by Oil, Mining, Pharma and Banks.)
While these reversals were undoubtedly times of considerable worry for investors that experienced them, they also provided an opportunity. The 20-year trend of these index returns is still strong upward. Even more so considering that £MCX only represents the capital return. Looking at the total return, by choosing a FTSE250 ETF that reinvests dividends, such as £S250 , the benefit of being in equities over the long term is even more obvious:

An investor who bought during these times of crisis is likely to be still doing well, despite the recent weak equity markets.
Can investors spot the crisis and get out ahead of time?
If these crises can be spotted, then investors can sell out ahead of time and avoid the worst of the losses. The problem is that investors tend to spot too many crises and sell up too often, a problem originating from our history as hunter-gatherers. If one spotted an imaginary tiger in the jungle and ran away, the consequence was a bit of unnecessary spent energy. If one failed to spot a real tiger, the consequence would be much more severe. Those who were bad at spotting and reacting to danger didn’t last long enough to have much impact on the gene pool. Today, we tend to see tigers in the market far more often than they actually appear.
For example, investors who panicked and sold due to the European Sovereign Debt Crisis that lasted from 2019-2014 would have missed out on doubling their money in the £MCX :

Which is the second problem with this strategy. Those who successfully spot the crisis and sell need to know when to re-enter the market. After COVID-19 caused a sharp sell-off at the end of February 2020, the FTSE250 bottomed just a month later, on the 20th of March. This was far before the main effects of COVID-19 on the population or economy had even taken hold. Those who sold out and missed the initial recovery may never have managed to re-enter the market. Or worse still, capitulated and bought back in the Summer of 2021 when everything started to look good on the COVID front, but the stock market was about to peak. Given that cash has paid virtually zero interest during this time, even these most prescient of investors may have been better off simply remaining fully invested.
Buy the dip?
Nor does some kind of mechanical buy-the-dip strategy appear to be the answer. Investment strategist Samuel Lee simulated a simple strategy of buying the stock market index on varying levels of weakness and then selling once the market had returned to the level prior to the drop or after three different periods: one, three or five years. Using US market data from 1926-2016 and drawdown thresholds of -10% through to -50%, Lee found that every single combination of drawdown threshold and holding period generated poorer returns, both on an absolute basis and a volatility-adjusted one, than a simple buy-and-hold strategy. The best of the buy-the-dip strategies was to buy on a 45% drawdown and hold for five years, but even this was worse than simply buying and holding over the same period. This buy-the-dip strategy doesn’t work because waiting for a 45% drawdown requires years of sitting in cash and because the market tends to exhibit momentum.
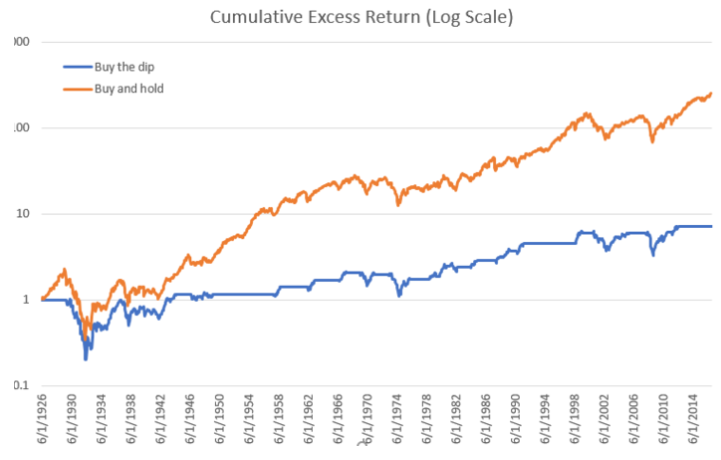
The final problem with this idea is that the average individual investor is very bad at calling the market's short-term direction. On average, investors’ attempts at timing cost them 0.81% per year in lost returns. It doesn’t sound much, but it compounds up to a 26% underperformance over a 30-year investment timeframe. The situation is likely to be even worse in a more volatile investment environment. For example, consider the investors in the CGM Focus Fund. This was the best-performing fund for the decade ending 2009, delivering an 18% compound annual return during this time. However, the average investor in the fund generated an 11% compound annual loss during the same period. They created this massive 29% annual underperformance for themselves by buying into the fund after it had posted strong returns and bailing after it suffered losses.
Trend Following
There is evidence that some form of mechanical trend following can improve investor returns, at least on a risk-adjusted basis. In a 2012 study, Meb Faber showed that investors who held the S&P500 when it was above its 200-day moving average and cash the rest of the time significantly reduced their drawdowns with little cost in terms of overall compound return.
Unfortunately, this is not the panacea it may first appear. Like many successful investment strategies, it is easy to implement but psychologically hard to follow. The reason is that the investor in such a strategy frequently gets “whipsawed”. So-called for the shape of the return graph it generated. Trend followers on U.S. stocks have experienced many whipsaws over the past decade, when a market drop triggered what appeared to be a new downtrend, only to reverse and head higher instead. Many investors simply can’t cope with the whipsaw return profile in the short term, even if they know it should generate better risk-adjusted returns in the long term.
What does work?
While it is not possible to predict the short-term direction of the stock market, I think investors can apply logic to improve their decision-making around crises. Markets often have what I call a “Wile E. Coyote” response to a crisis after the regular scene in Loony Tunes where the Coyote has gone off a cliff, but, comically, gravity has yet to take hold. His plunge into the canyon below is inevitable, he just hasn’t realised it yet.

In the Great Financial Crisis, there were signs that everything was not rosy, as far back as July 2007 when Bear Stearns disclosed that the two subprime hedge funds had lost nearly all of their value amid a rapid decline in the market for subprime mortgages. Yet the wider market didn’t really respond until 2008. I don’t think it was clear in mid-2007 that global stock markets were in severe trouble. However, the problems at Bear Stearns did indicate that banking and property companies were not the places to be.
In 2020, I didn’t foresee the size of the stock market sell-off that would be caused by COVID-19. However, by mid-February, I did perceive that COVID-19 had the potential to cause severe disruption to travel businesses such as Ramsdens Holdings (LON:RFX) or lenders to small businesses such as Time Finance (LON:TIME) and exit these stocks at what proved to be favourable prices. Nor did I perceive that travel socks would be so quick to bounce back despite severe headwinds for the industry that lasted for another two years. Nor did I spot that the market would get carried away with the valuation of certain COVID-beneficiaries such as Best Of The Best (LON:BOTB) or £NCYT. I can’t claim that I played a perfect game in 2020, but by April, I had seen sufficient value to be largely fully invested again, and overall, 2020 proved to be one of my best-performing years.
Bargain Hunting
While slowly and cautiously buying as prices decline has its merits for the value investor, there are times when real bargains become available. These are marked out on the charts as periods of extremely rapid declines in indices. These represent times when some market participants are forced sellers. From time to time, there will be a specific forced seller. For example, a fund may have been over-leveraged and blown up. This can create bargains in specific stocks. However, these rarely provide the kind of market-wide opportunity we seek. The difference is that once other market participants realise that there are a significant number of forced sellers out there, they step away from buying. Partially the buyers' strike is because they don’t want to be standing in the way of the wave of selling, partially because they want a bargain.
I can think of three times when these liquidity events have caused rapid sell-offs in stocks: 2008, 2020 and 2022. In each case, there was a specific cause of both the initial sell-off. However, the common theme is that declines that started off as a rational reaction to bad news were exasperated by forced selling driven by the failure of system-wide leveraged strategies. It was the liquidity event that ensued that caused equities to drop so rapidly and presented bargain opportunities:
2008
Although the financial crisis of 2007-2008 was caused by the lax lending standards in subprime mortgages together with their packaging into complex derivatives, one event stands out: the bankruptcy of Lehman Brothers. By allowing Lehman Brothers to fail, the US government missed how systemic the bank had been. It was an issuer of many of the derivatives, complex financial instruments, that were at the heart of the crisis. The problem was that many other financial institutions had bought products that were intended to hedge risk via Lehman Brothers. When the bank failed, other market participants were unsure if they were still hedged. This level of uncertainty led to the massive selling of risk assets at any price. The crisis ended only with massive government support provided to the remaining financial institutions. In the UK, several major banks were nationalised, but importantly not allowed to fail.

2020
The initial sell-off due to economic fears over COVID-19 was compounded by the blow-up of Risk Parity funds in mid-March 2020. Instead of simply holding fixed allocation to equities and bonds, such as the classic 60/40 portfolio, a Risk-Parity fund optimises its percentage holdings based on historical correlations and volatility. The aim is to generate higher returns at lower volatility that they can then leverage to generate a target return. These were highly popular strategies with very large amounts of money allocated to them. However, in February 2020, these correlations broke down, leading to large losses in the funds. This led to some major clients redeeming, and Risk-Parity funds faced those redemptions at the same time as re-balancing and de-levering.
The situation was made worse in March 2020 by the “quant quake”, where a number of common (and potentially crowded) quantitative strategies stopped working. Again, any fund that was leveraged would have been a forced seller. There were no willing buyers as liquidity dried up, and the selling of equities led to prices dropping very rapidly.

2022
In October 2022, a mistimed budget from new Chancellor Kwasi Kwarteng led to UK interest rates rising rapidly. This caught out many Defined Benefit Pension funds that had purchased financial instruments known as LDIs. Pension funds are forced to hold a significant proportion of risk-free assets, such as government bonds, to protect against falls in interest rates since their liabilities rise as interest rates fall but so do gilts. The problem is that with assets and liabilities largely matched, there was little scope to make up for any deficits via anything other than additional company contributions. To get around this, companies purchased LDIs. These increased in value as interest rates fell and decreased when they rose. This means the pension fund should be hedged against interest rate moves, they can lend the gilt to a counterparty for cash (in a process known as repo) and use that cash to invest in riskier assets such as equities that have a higher expected return. Hey, presto! There’s a chance that pesky deficit goes away on its own.
The problem was that these LDIs required pension funds to post margin when the positions went against them. And when the interest rates moved so quickly, the additional margin required was significant. Pension funds could only meet the margin calls by selling gilts and their risk assets (equities). If only one fund was doing this, the market could have absorbed the selling. However, since many funds had done this, selling gilts was causing their value to fall and interest rates to rise, making the situation worse as more margin was required. The selling of equities meant that their value went down, and more needed to be sold to meet the next margin call.
This vicious cycle led to a significant sell-off in the stock market, which only ended when the bank of England stepped in by buying gilts and breaking the negative cycle. The forced selling from many different market participants all caught in a loop, had driven equity prices down rapidly.

Today’s Markets
2023 has been a strange year for investors. After the inflation-driven weakness of 2022, simply entering a new year appeared to usher in an era of stock market recovery. Many small cap shares rose significantly even without any positive news announcements. It seemed that the market had recognised the apparent level of undervaluation of many smaller companies, and investors were willing to deploy the capital they had left in dealing accounts slowly being eroded by inflation.
Fast forward to March, and a new banking crisis has appeared. First, Silicon Valley Bank failed as depositors demanded their money back far more quickly than the bank could realise assets. This was precipitated by the perception that the bank had been lax in lending to loss-making tech businesses that were now struggling and unlikely to be able to raise fresh equity capital. This was also another example of a market participant failing to hedge rising interest rate risk properly. The bank had significant losses on treasuries that they hadn’t marked to market since they intended to hold them to maturity. That is until the bank run forced them to realise these losses and further compounded their woes.
Then adding to the global issues, the market lost faith in the Swiss Bank Credit Suisse. The outcome was a forced bailout by UBS, backstopped by the Swiss government. The market perception is that many regional US banks will face the same liquidity issues as Silicon Valley Bank.
So does this mean that the current markets represent a bargain, or are we simply at the start of a major crisis? On the one hand, I don’t see much of the forced selling due to leverage and esoteric instruments blowing up that have produced the real bargains of the last couple of decades. But saying that, I also don’t see a major crisis. While the failure of regional banks in the US, if they occur, will undoubtedly suck liquidity out of the US (and therefore global) markets, this doesn’t seem to have great direct relevance to UK small and mid cap companies. There doesn’t seem to be a Wile E. Coyote moment where we have a clear risk to global markets that has occurred but hasn’t yet been priced.
Applying the principle of assessing the logical impact, I wouldn’t want to own the equity of US regional banks. It is clear that while governments will step in to protect depositors, equity holders will not be bailed out. But then, these were never on my list of investable securities anyway.
The current selling, coming on the back of a very weak 2022 for global markets, means that I struggle to be that bearish. Objective price measures already make many equities look good value, and the future expected return of UK small caps is likely to be high at the moment. But conversely, without evidence that significant forced selling is currently happening, the absolute bargains of some previous crises may be thinner on the ground.
In a future week, I will take a look at one of the most extreme value strategies that aims to take advantage of the real crisis moments in markets.
Disclaimer
This is not financial advice. Our content is intended to be used and must be used for information and education purposes only. Please read our disclaimer and terms and conditions to understand our obligations.
9 comments
Enjoyable imo accurate summary of the markets since 2008. I'm a survivor (just) from October 1987 Mark, when I learned about leverage the hard way as an amateur uneducated Put Option writer! Stockopedia has educated me into better investing but you can't avoid the whipsaws.
Hi Mark.
You've mentioned about Ubs and Credit Swiss getting into trouble. A thought I've had over the years, is that some of the European nations such as Greece and Italy are supposed to be bankrupt. If any of their banks got into trouble. Who will bail them out? Is the European Bank big enough to support the failure of banks or countries with in the EU.
Hi Gutty,
Potentially a valid concern. But, as I point out in the article, those who were too worried over the state of Italian and Greek banks from 2009 to 2014, when these concerns were regularly hitting the headlines, missed out on doubling their money in UK mid-cap stocks. So it would need a much more specific problem to appear this time to stop me from investing in historically very cheap UK small-cap stocks.
Interesting article again.
While it reinforces my plan to just stay more or less fully invested in quality stocks, it still leaves me wondering how to react to excessive valuations. I recognised that many of my stocks were fairly expensive a couple of years ago, PE's of 30, 40 etc when really 20, 25 might have been more appropriate, or slightly expensive. Every time I thought 'that's getting expensive' stuff would lurch up another notch, leaving me wondering how high stuff could go.
Bar a couple of small top slices I continued to hold (and still do) while there has been a rerating (some problems too but derating did the big damage). So what should I have learnt or done differently? Had I sold what would I have done with the money, everything else was expensive too and has fallen (more or less anyway)? Or is it just what I have to live through on a long term trajectory?
FWIW I suspect the latter is the best option for me, but answers on a postcard..........
I'm probably not the person to ask on this one, I get a nosebleed at a P/E of 25, let alone 40!
However, I think some kind of momentum strategy might help with the selling. See my article on surfing the stockranks: https://www.stockopedia.com/co...
Nothing will be foolproof since even a momentum strategy will probably see you whipsawed out of a few good stocks, but on average, it may improve your sell discipline.
Thanks for the trip down memory lane Mark. I have some vivid memories from these big liquidity events (and I would add the 2016 Brexit vote into the mix) and each of them has offered up real “blood on the streets” purchasing opportunities.
Yes. Interesting that it barely appears on the chart above. It really was a short, sharp drop and recovery on that one.
The opportunity as I recall (or at least how I played it) was to buy net overseas earners and reduce exposure to those domestically focused due to the falling pound (which has still not recovered). This led to 2017 being my best ever year. But as you say, a mere blip on the long- term chart.
All very interesting. I look forward to the next article. David