IPO Analysis: Part 1 - Assassins and Rabbits; Multibaggers and Dogs

Update July 2019: Part 2 of this Series is now available covering the addtional 133 IPO placings
Topline
408 IPOs from 2011 to 2019 were analysed quantitatively: the median return was -17% with a 60:40 split of losers to winners over the time period. This fits with published academic studies of IPO performance of -8 to -23% . A deeper analysis of the numbers gives more insight on opportunities and the role of stop losses in converting trades into very profitable investments some which yielded several thousand percent returns. A furhter 133 placings were not excluded as they were nto amenable to the datamingin processes used. These are dealt with separately in Part 2 of this series which should be read in sequence.
Introduction
To IPO or not to IPO? that is the question. Whether it is more profitable to risk the slings and arrows of a placing or to wait and see how the market receives it? These days I tend to ignore the barrages of broker emails and don’t get carried away by FOMO: I prefer to give a placing some time in the market before taking a position. Intuitively this feels right (I've had a few knocks in the past) but I decided to go beyond heuristics and take a deeper look at the data to see if being more systematic was of merit. Does it make sense to get in early at the placing price? How do IPOs tend to behave post the placing and in their formative years? The initial results surprised me so I did a bit more digging before drawing any firm conclusions. This article is the first in a series looking to unpack some of the insights and devise actionable trading and investing strategies. The full version of this article with an interactive report of the data allowing DYOR analysis is published on runprofits.com. ( Stockopedia data is only included in this summary article and not elsewhere )
Background to the Study
- 530 companies in the period 2011 to 2019 abstracted from a London Stock Exchange list off over 3000 IPOs and placings
- avoided the GFC and the extreme volatility in its aftershock so ruled out listings before end 2010.
- further whittled down by another 130 or so which didn’t appear in the datamining: the bulk of which seem to have delisted (some may have changed name)
- this is a quantitative study based on a total universe of the good, the bad and the sometimes downright ugly. It doesn't have the qualitative lens used by good fundamental analysis coupled with sector and domain expertise used when focusing on individual placings. Nor does it approach IPO placings by trying to understand the motivation behind the listing given cost, complexity and disruption to the business this causes (4)
- this analysis would be more robust if 408 non IPO companies were chosen from the same period and the analyses compared but this task would then be in danger of becoming Sisyphean.
- References, assumptions and notes are appended to the full runprofits.com article to kept this version brief(er)
- not corrected for underlying markets but skew owing to IPO timings considered (see full article)
- Placings were analysed by country of incorporation, sector and market as was the segmentation and concentration in losers and winners
- “multibagger” is any share that has more than doubled and a “dog” is any share that has more than halved in value
The Topline Results
Data mining techniques were used to derive highs and lows from the dataset, avoiding a lot of chart gazing and human error. The below summarises these results and contextualises them in terms of profit and losses.
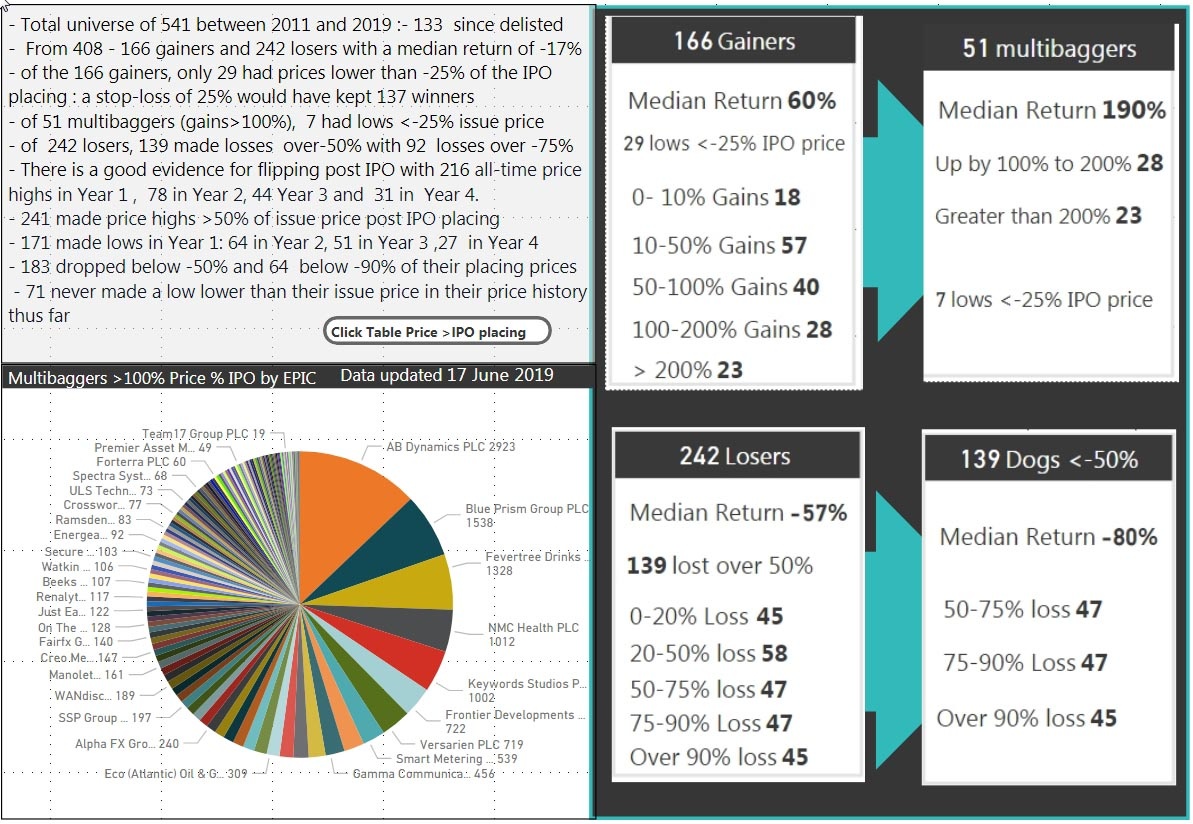
Of those 408 companies studied there were 166 gainers and 242 losers : a 40:60 ratio of winners to losers.
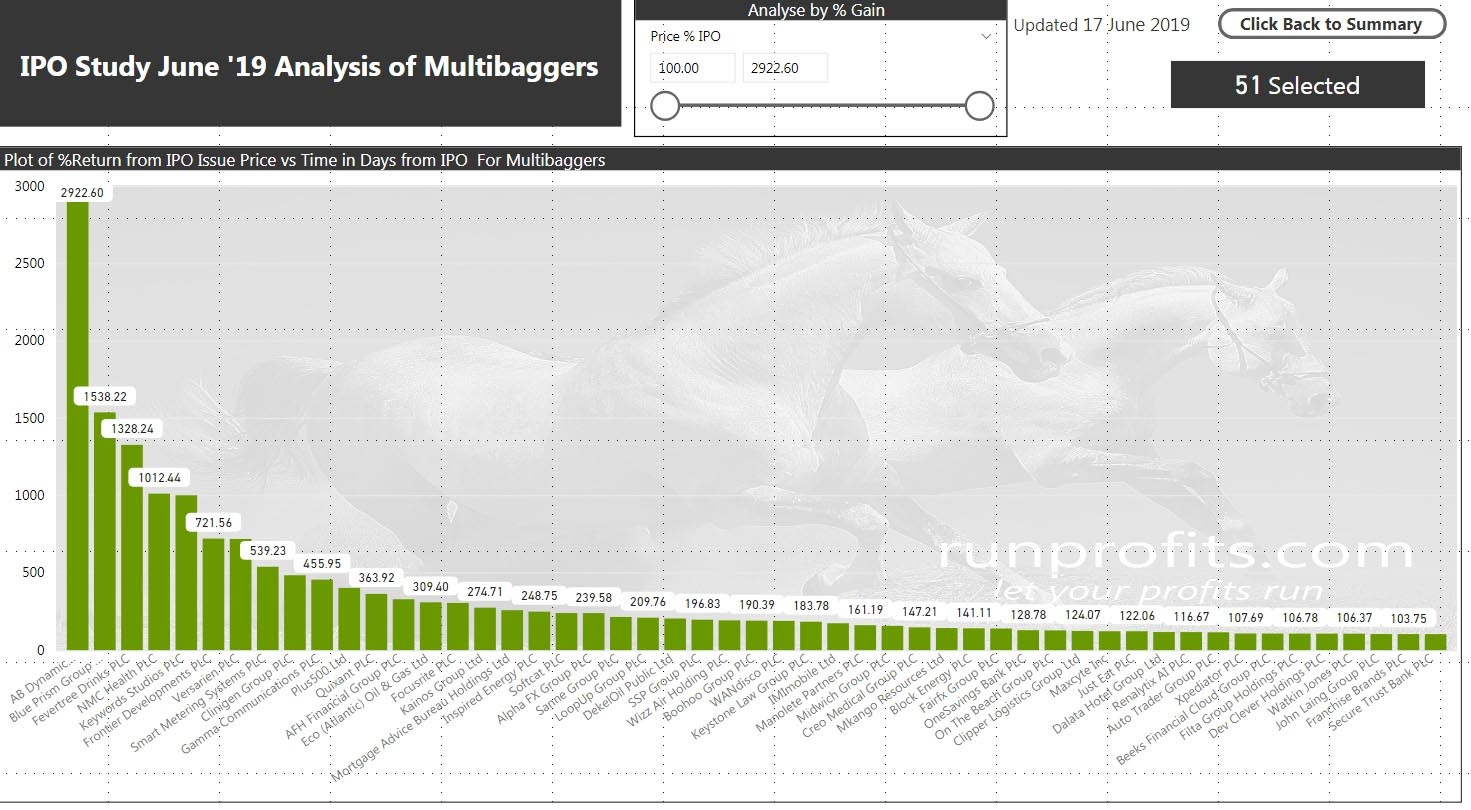
The 166 gainers had a median return of 60% with 51 multibaggers with a median return of 190% , 23 of which made more than 200%.
Of the 166 winners , 71 never made a low below their offer price and only 35 made price lows lower than 25% below their offering price.
The 242 losers had a median return of -57% with 139 dogs losing over 50% and 45 with over 90% loses
216 of the 408 made their price highs in Year 1 after the placing, with 78 in Year 2, 44 Year 3 and 31 in Year 4.
Only 10 of those 216 highs in Year 1 made a high below the IPO placing price, the rest were in-profit.
241 made price highs greater than 50% of the issue price at some point over the total duration studied
Conversely 171 made lows in Year 1, 64 in Year 2 with 52 in Year 3 and 27 in Year 4.
335 made lows lower than the placing price over the total duration with 183 making lows lower than 50% of the placing price.
Some observations and So what?
- Winners generally kept winning with 31% of winners winning really big (up to almost 3000%)
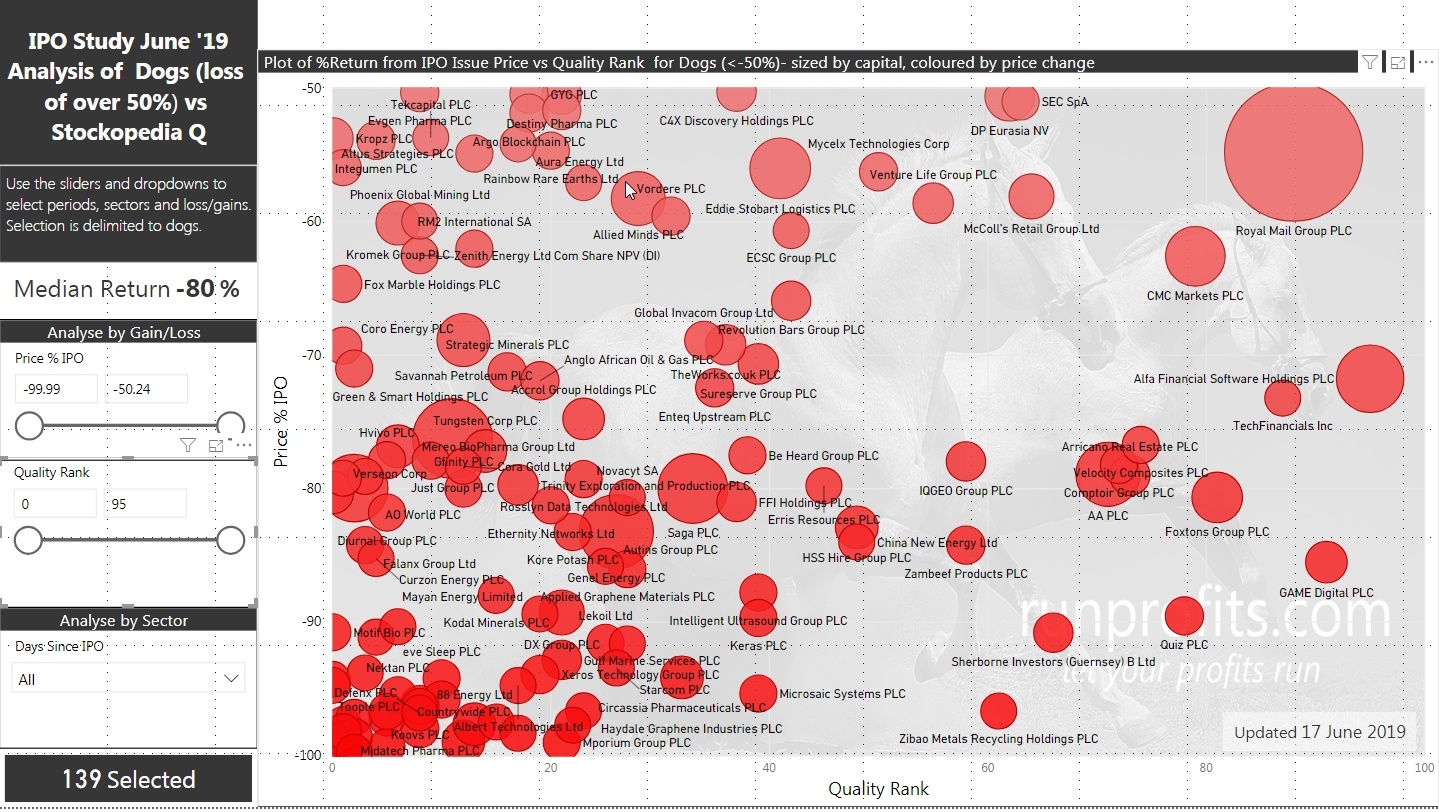
- Many of the losers went on to lose a lot with 38% of losers losing really big (>75%)
- A stop loss of 25% would have kept 143 of the 166 winners in play and only stopped-out 7 of the 51 multibaggers while removing 215 of the 230 losers.
- Given the number of highs in the first year, there is very good evidence of flipping in Year 1 possibly by both institutions and private investors.
- Taking a position in an IPO looks to be more of a traders’ game than an investors’ one (with all the caveats on quality of fundamental analysis)
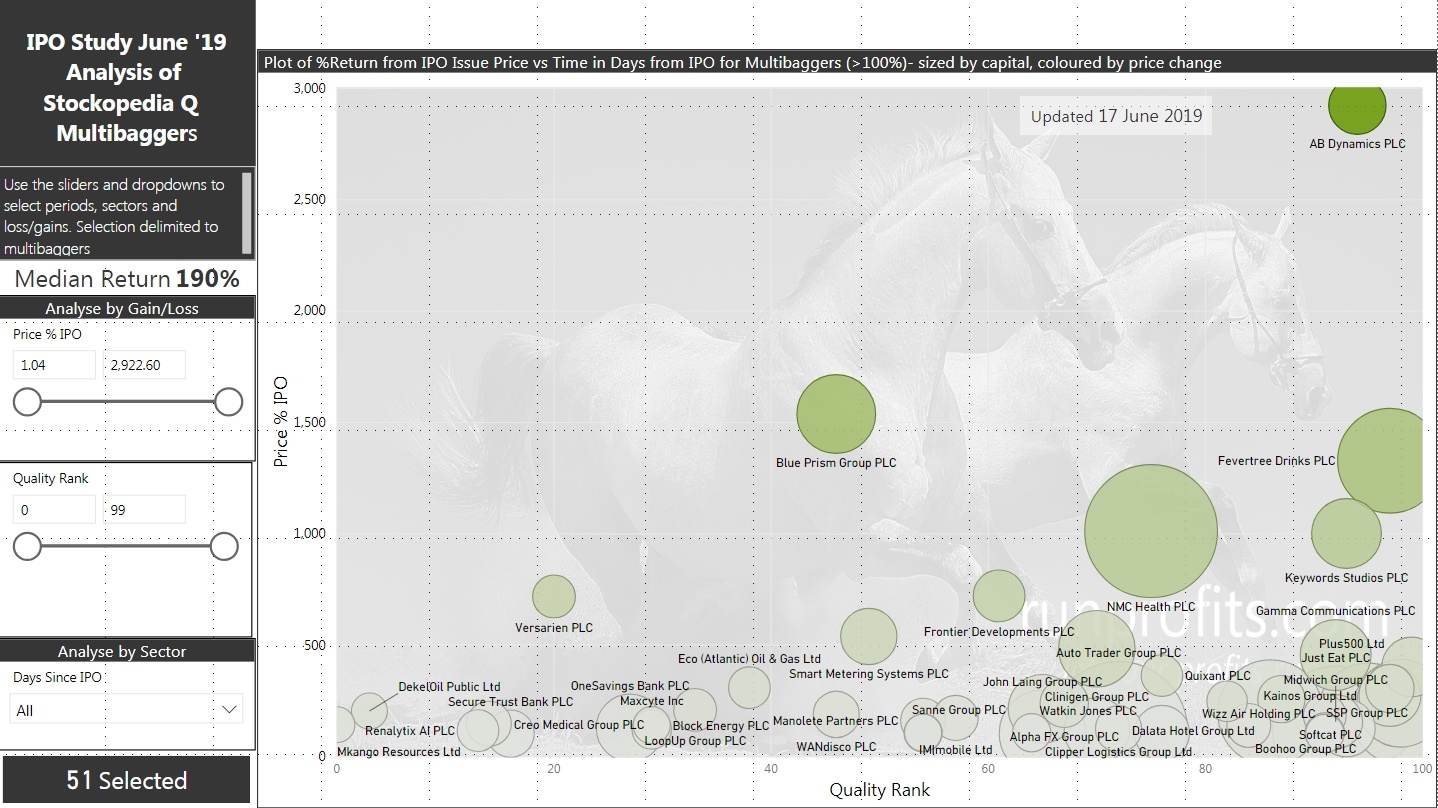
- Multibaggers tended to have good Stockopedia Quality and Momentum : 36 of the 51 had both Q and M greater than 50 while dogs had the opposite (126 of the 139 had Q below 50)
Rabbits and Assassins
This suggest some potential strategies around IPO placing that help to mitigate risk and look to capture the multibaggers (and try not to let them go) while releasing the dogs early before being thoroughly savaged.
The numbers suggest that allowing the price action post-placing to dictate one’s strategy seems to make sense i.e. assume taking a position in an IPO issue is a trade until price proves it to be an investment. Then let execution strategy and risk management navigate the price trajectory post-placing. This of course pretty much true for any trade or investment but what may be peculiar with IPOs is that once forged in the fire of price discovery, public markets rapidly resolves the good from the bad: the multibaggers from the dogs even as large holders of the original issued equity play out their hands. That the initial perceived value, the issue price, is a discrete price and not a range may give a very defined selling point. This may well skew behaviours and exaggerate price performance as most participants anchor to the same price point at least in the early years.
A stop loss of 25% would have kept 143 of the 166 winners in play and only stopped-out 7 of the 51 multibaggers while removing 215 of the 230 losers
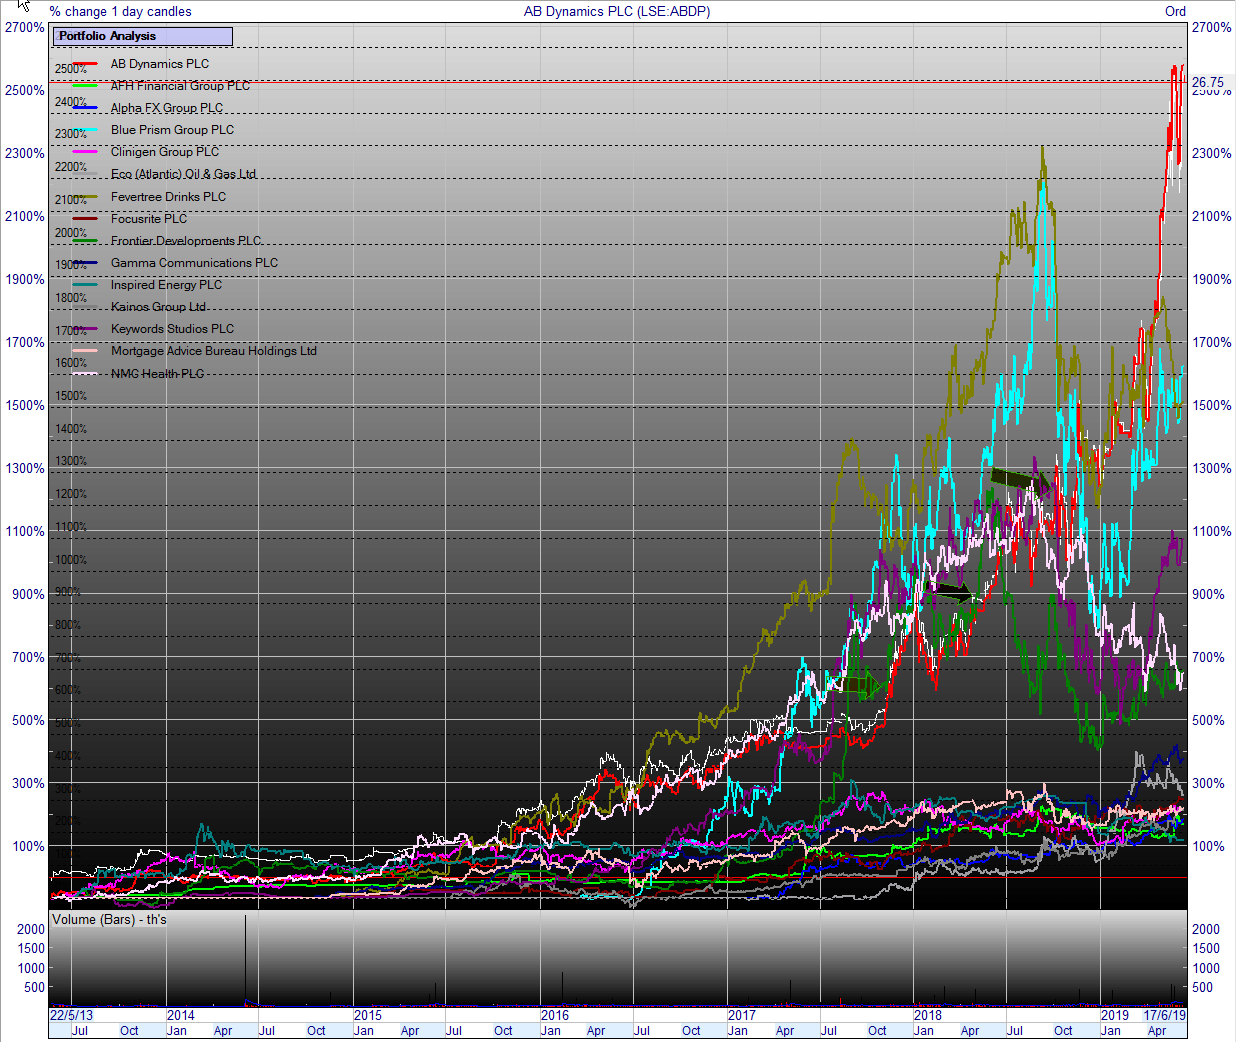
This study shows that a stop loss of 25% retains 86% of the winners and almost 90% of the multibaggers. Given the sample size and duration of the study these seem like a sensible parameter to use in trade execution. Building positions by adding to winners and letting go of losers (defined at least by a stop loss) concentrates capital in the best performers. To invoke Lee Freeman-Shor’s investing behavioural types, one needs to be an assassin and not a rabbit with IPOs- executing losers remorselessly. Again this is all good discipline and trade execution but the lack of historical data with IPOs adds additional uncertainty compared to long standing publicly quoted companies with years or even decades of published accounts. That risk can bring the huge rewards evidenced by AB Dynamics (+2922%) or Blue Prism (+1538%) which convert pre IPO promise into real growth and momentum (or at least supporting sentiment) or alternatively can lead to wipe-outs like Maistro or Block Commodities (both -99.8%).
Given the number of highs in Year 1, flipping is also a viable trading strategy with different risk parameters and expected returns.
The Voting and Weighing Machines
This comes back to the original question; should I take a stake in an IPO placing and is there really a danger of missing out? Only a few of the multibaggers ever got cheaper than their initial placing IPO price but all of them went on to make most of their returns several years after their placing dates. Relative to the rewards offered later on, the difference between the issue price and prices in early years suggest it might make more sense to wait for performance in the market rather than buying in the placing . Indeed. a number of IPOs which did go on to be multibaggers went through periods of underperformance in the initial years and did offer better buying opportunities (BOO, BLOW, LTG, WAND). This echoes Ben Graham’s observation that in the short-term markets tend to be voting machines while in the longer term they are weighing machines. While charts are always easier to read from right to left risk management using a stop-loss should work with the majority of nascent multibaggers
The concentration of highs in Year 1 is may have multiple sources. Institutional and private investor flipping may account for much of it. It is often difficult to predict the intentions of large private equity backers/major shareholders beyond lock-in periods but these can have major impacts on price performance. This is particularly true when liquidity is low owing to initial large institutional holdings. Equally price discovery in the market and changes in market sentiment may greatly impact early performance (especially when pre IPO hype gives way to even mild disappointment post-placing). An increase in the number of IPOs issued is often used to infer periods of exuberance of the overall market with potential pseudo-market timing effects (1). Finally, IPOs predicated on inflated/invented financials and sometimes overt fraud can be difficult to detect but are precipitous once discovered.
While none of the above is rocket science, the numbers do suggest that taking a position in an IPO is better viewed as a trade while an investment may be better made post IPO when the initial few years of flipping, disappointments and price discovery have played out. These conclusions are made within the obvious caveats that more rigorous analysis of individual placings should enhance success and root out the more obvious dogs though I am not sure it will necessary identify some of the less obvious multibaggers to-be.
Would you rather be right or make money?
May the odds be ever in your favour is very relevant in the Hunger Games when the outcome is so binary: life or death. Not so in trading or investing where it is how right or wrong that you are that really matters.
Rather than focus on the 60:40 win:loss ratio it is important to calculate the outcomes in the context of the amounts lost or gained as a result of those odds (expected values) . By using a stop-loss, one controls the loss - in this case 25% while the gains are a matter of trade management.
For example, if one took a £100 position in every one of the 408 placings.
Capital at risk is 408*100 = £40800
60% are losers = £24480 but stop loss is 25% so net loss is £6120
40% are gainers = £16320 with a median return of 60% so net gain is £26112
Total return is £26112 + (£24480-£6120) = £44472
Clearly you can be wrong more than you are right and still make money through trade execution and risk management.
Conclusion.
What is very clear from the data is that there are good chances of making profits from trading an IPO position bought at the placing by selling in Year 1: timing really does work...
BUT...
The real rewards come from allowing good trades to become better investments , trade management and the use of stop losses will support that and prevent the converse which is too often the case when holding on to, or even adding to, losers: stop losses really do work.
My opinion on IPOs has changed, from now on I’ll take an informed position but trade it until it proves otherwise.
if you found this article of use please give it a thumbs up at the top
More information at runprofits.com
Disclaimer
This is not financial advice. Our content is intended to be used and must be used for information and education purposes only. Please read our disclaimer and terms and conditions to understand our obligations.
20 comments
Thanks, very kind offer Gromley but I am ok to run them, maybe over the weekend: this has been a bit of a side project that grew organically as I found it of interest. I'll write a Part 2 to update
No doubt the delisted companies do have an impact on the overall results
@timarr, I'll defer to your expertise on bias: my misunderstanding of survival bias was based on the exclusion of failures to improve the overall proportion of success: those delisting will do so both from failure and success so there is not a skew to either in terms of selection.
Clearly it is outstanding and needed to improve the overall interpretation
... my misunderstanding of survival bias was based on the exclusion of failures to improve the overall proportion of success: those delisting will do so both from failure and success so there is not a skew to either in terms of selection.
You may be right, and I don't know one way or the other. However, I don't think we can assure ourselves of that without looking at the actual data. Survivorship bias doesn't automatically give a skewed better result, it might equally give a skewed worse one if a lot of recent IPOs attracted sizeable bids.
If I were a betting man, though, I'd bet against it: IPOs are generally favourable to insiders who know what they're selling so it would be surprising if a lot of companies then got bought out at a significant premium.
The other thing to be wary about is outliers. Generally in any cohort there are a few superstocks that massively outperform and bias the results. If (say) you had two ten baggers in 100 IPOs and investors on average bought 1 in 10 of them you'd have a high probability of getting worse results than the averages would suggest. I'd suggest that the size of the outperformance is less than the proportion of the stocks that outperform.
It's interesting, though. I was long a refusnick on IPOs but I've bought a few recently which have done OK. Still wake up in a cold sweat thinking about Accrol Group (LON:ACRL) though ...
timarr
It is a source of great frustration to me personally that universally the providers of stock price information expunge any de-listing companies from the public record. Which is why I have been working on capturing and retaining contemporaneous price information for as many companies as possible . My work on this is unfortunately only comparatively recent, but I might still be able to cast light on the fate of some of the 130.
For the others, it might be possible to make some form of qualitative assessment of outcomes. Good old "investegate" (or UK Wire as it always will be to me) do provide a useful archive. (For example if anyone wants to read up on the demise of Woolworths over a decade ago it's all there for you.)
I have a number of data mining tools at my disposa,l so would be happy to have a look at what conclusions could be tentatively drawn from the 130 if you have a list of names and/or epics?
Thank you for this useful and thought provoking article
"further whittled down by another 130 or so which didn’t appear in the datamining: the bulk of which seem to have delisted (some may have changed name)"
As mentioned above this would create some bias. Delisted implies take over or bankruptcy which are quite binary outcomes for investors' profits. Appreciate it could take too long to manually find and plug in the data though.
Looking at the chart of performance by time, it looks like (visually) a few jump up 50% - 100% within the first year, then not much happens for the next three years then from year five onwards the big gainers start grinding up with big wins over a few years.
As you say this implies a dual strategy - trading year one 'pops' and investing in growth companies four or five years post IPO when their serious growth phase seems to kick in.
This is a shape which mirrors the big tech firms in the USA as well, I recall Amazon, Facebook having the same sort of pattern. Year one exuberance for the new listing, then a few years of negative cash flow reality as the firm struggles to gain scale, burns money and holds successive funding rounds to stay alive. Then the (successful ones at least) hit critical mass on customers and earnings and zoom higher.
Thanks again for the article
Thanks, I intend to do a deeper dive on the big winners and characterise them in more detail
I am not sure bias is the right phrase for those that delisted - skew maybe but bias suggests a cognitive effect. Given the sample size and duration that amount is probably "about right" statistically given going broke or getting bought out are also outcomes of an IPO : it happens all the time and just is without bias.
.
As you say given the binary nature of that outcome then quantifying does become more manual but not impossible : at least on a first pass of "broke or bought": broke is easy as a zero, there is then a degree of bought wrt the IPO issue price. What it does add is the risk of losing everything which is of use.
The missing 130 IPOs represents nearly 25% of the total set - so it's clearly significant. To take a silly extreme position if the entire 130 went bust or got taken over at a significant premium then it would significantly skew the results.
Technically this is a bias, but not a cognitive one: it's survivorship bias, a form of selection bias, and the outcome is that the results usually look better than they really are. It's a well known problem in financial stock analysis and its always something to look for in backtesting: any back tests than only use current data are inherently flawed (personally I think all back tests are flawed, but I'm probably in a minority there).
Survivorship bias is often used by mutual fund managers to improve their performance figures. They never mention the failed funds that they quietly folded, they only promote the successful ones.
Even so, what would be interesting would be the common characteristics of the winners and losers. In the AIM research in this area the main factor was longevity of the company prior to IPO, but I'd guess levels of debt might be relevant as well.
timarr
We should assume that a company that has been around a long time pre-IPO is more likely to survive than a younger company, all other things being equal.
There's a 50% chance that the IPO occurs in the middle half of the company's life.
In 1969 J Richard Gott III worked out a method to estimate the expected life of the Berlin Wall (https://www.asc.ohio-state.edu/kagan.1/AS1138/Lectures/GottIII.html), which seems reasonable to apply to company lives.
Ever since reading about it I've paid attention to how long a company has been around when considering an investment.
I would imagine the 25% of non-surviving stocks would be a mixture of takeovers and failures, possibly more failures. If the latter, perhaps the overall conclusions would not be too different (median IPO performance still poor).
Anyone planning to amend their investment process in view of this study will either have to make an estimate on the effect of the missing stocks, or do the work to find out how they departed from the market. In my case, since I am unlikely to become a regular participant in IPOs, making estimates is a more likely outcome.
Appended to the full article - see below
Appendix: A note on Sectors, Countries
The total universe of 408 was analysed by sector, country and market as were the winners and losers to examine sector and country over/under-performance. Junior oilers and miners are fairly notorious for overpromising and under-delivering with sometimes spectacular losses. Many investors will shun companies from some countries owing to track records of frauds and limitations on prosecution in the event of fraud.
Figure 8 shows that more of the winners came from Financial Services, Support Services with an even more pronounced concentration of Support Services and Software companies in the multibaggers. Mining and oil and gas producers did concentrate in the losers with the ratio of mining doubling from 6% in the total universe to 12% in the dogs;
Figure 9 shows a similar segmentation by country, I suspect that this would change further if the 130 delisted companies were included since it contains several from Israel and China which have proven to be frauds. The plot shows a doubling (albeit from a low base ) of Israeli and BVI companies in the dogs : the percentage of UK companies increased from 81% in the total universe to 87% in the winners and decreased to 73% in the dogs. This does seem to confirm the bias against companies from these countries.
Thank you!
Chinese AIMs and sector analysis (resource stocks)?
Well look at that...
A stop loss of 25% would have kept 143 of the 166 winners in play and only stopped-out 7 of the 51 multibaggers while removing 215 of the 230 losers..
This was very interesting indeed! I cut losers at between 20 and 25% max of 30% in really exceptional circumstances so nice to see that it works in this scenario
This looks like a great piece of analysis and deserving of a much more detailed read and consideration (bring on the weekend!)
In the meantime though a couple of questions (and one piece of pedantry) sprang to mind on an initial skim.
The questions :
And my pedantry : Well I think from reading your text I think there were actually 23 multi-baggers and 28 baggers. (In fairness, you did define multibaggers as "any share that has more than doubled" so in your terms you are correct).
Anyway that's just from a very quick skim - I'll try to have a much more considered look in due course.
Thanks for sharing this.
Thanks Gromley, as ever insightful remarks
The 3000 refer to IPOs and placings dating back to the 1990s: the universe was selected from 2011 to 2019 to avoid the GFC and its aftermath and to concentrate on our new ultra low interest rate world. The selection criteria was purely date based and had no bias as they were fully representative of that total period
TBH my bias was upended by the research which is always good.
Given comments on win:loss ratios it strikes me that i should add something on expected values: that is where all the good stuff is. I intend to write some more from it as it is a nice microcosm on trading versus investing and the role of execution and risk management
Yes there is a skew from recency in the data: it's in the notes on the full version but I've appended bellow it doesn't materially change the outcome except to worsen the median return from the total universe. It underpins that IPOs have a maiden year or two when they tend to be profitable before diverging into winners and losers, multibaggers and dogs
I also include a plot of the total IPOs as a function of time.
3. Relative performances have been derived using time from IPO date: this will be skewed to some extent by more recent data: 30% of the total sample were placed in the last 3 years (removing these drops the median return to -24% for the total universe
Thank you for producing this outstanding piece of analysis.
I won't say much more before studying it comprehensively.
I have only bought two IPO's at launch, Alpha FX and Manolete, both of which make your good performers list. My reason in both cases was that they were listing to raise capital to expand their businesses to meet existing demand.
In Alpha's case they needed more regulatory capital to be able to take on customers that they were having to turn away and in Manolete's case they needed to open new offices. Those seemed "good" reasons for an IPO to me. There are plenty of "bad" reasons like the private equity cashing out element of floats such as Aston Martin.
I'm reading your conclusions as being "Run the winners, cut the losers"? But that there are more losers than winners.
I'm not sure there's a substitute for doing the fundamental research, reading the prospectus, etc. And if time doesn't allow that I would just stay away based on the win/lose ratio you found.
albeit the win:loss in Year 1 is outstanding and the risk is kept to 25% so the expected value of the multibaggers is the real prize
I'd be keen to know the performance of the 133 companies that 'de-listed'
This could radically change or reverse your conclusions, especially where the reason for delisting was a takeover.
Indeed but it will be a qual assessment : the list includes Patisserie Valerie, Naibu, MYSQUAR Cloud Tag ... with a concentration of companies domiciled in BVI and the Caymans.
Academic research puts the under performance at -8% to -28% so pretty much in keeping with the above